. 2018 Sep;17(9):1902-1916.
doi: 10.1158/1535-7163.MCT-18-0373. Epub 2018 Jul 11.

Therapeutic Targeting of KDM1A/LSD1 in Ewing Sarcoma with SP-2509 Engages the Endoplasmic Reticulum Stress Response

Affiliations

Therapeutic Targeting of KDM1A/LSD1 in Ewing Sarcoma with SP-2509 Engages the Endoplasmic Reticulum Stress Response

Kathleen I Pishas et al. Mol Cancer Ther. 2018 Sep.

Abstract

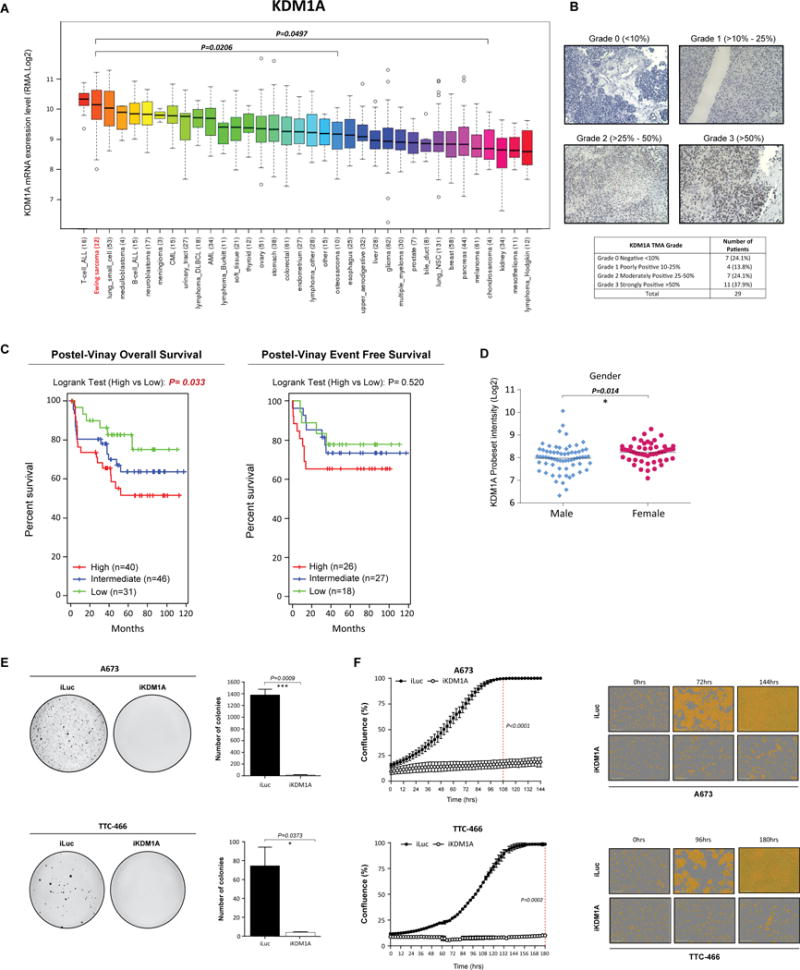
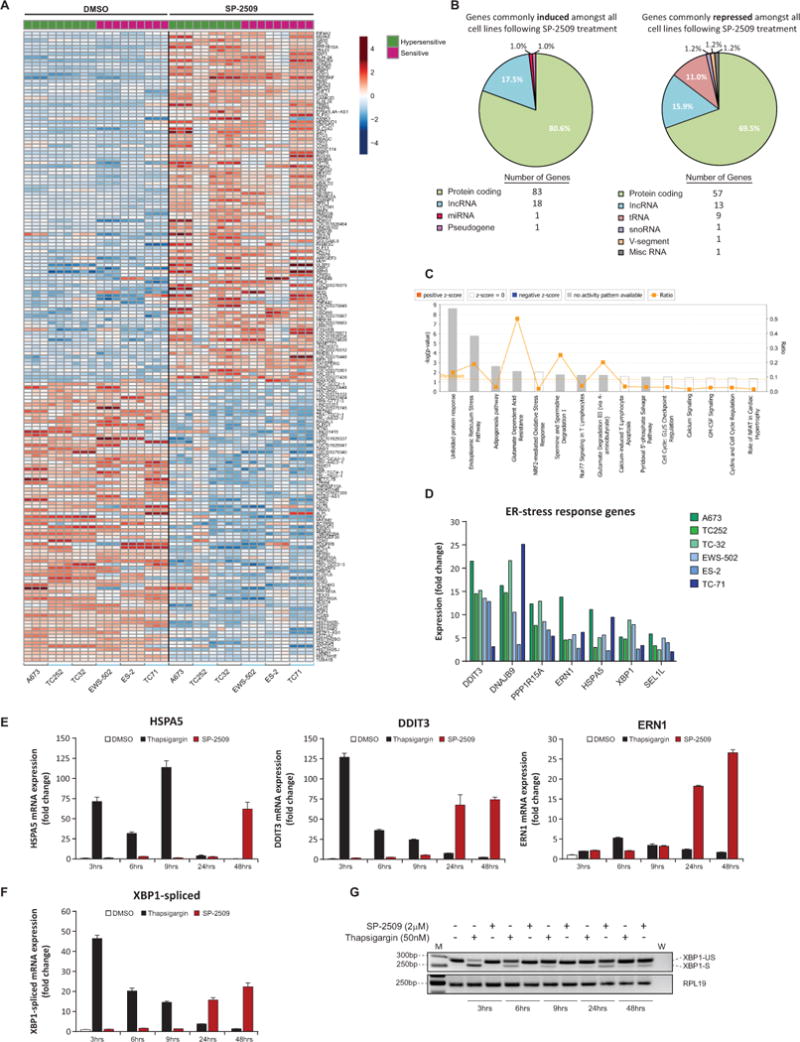
Multi-agent chemotherapeutic regimes remain the cornerstone treatment for Ewing sarcoma, the second most common bone malignancy diagnosed in pediatric and young adolescent populations. We have reached a therapeutic ceiling with conventional cytotoxic agents, highlighting the need to adopt novel approaches that specifically target the drivers of Ewing sarcoma oncogenesis. As KDM1A/lysine-specific demethylase 1 (LSD1) is highly expressed in Ewing sarcoma cell lines and tumors, with elevated expression levels associated with worse overall survival (P = 0.033), this study has examined biomarkers of sensitivity and mechanisms of cytotoxicity to targeted KDM1A inhibition using SP-2509 (reversible KDM1A inhibitor). We report, that innate resistance to SP-2509 was not observed in our Ewing sarcoma cell line cohort (n = 17; IC50 range, 81 -1,593 nmol/L), in contrast resistance to the next-generation KDM1A irreversible inhibitor GSK-LSD1 was observed across multiple cell lines (IC50 > 300 μmol/L). Although TP53/STAG2/CDKN2A status and basal KDM1A mRNA and protein levels did not correlate with SP-2509 response, induction of KDM1B following SP-2509 treatment was strongly associated with SP-2509 hypersensitivity. We show that the transcriptional profile driven by SP-2509 strongly mirrors KDM1A genetic depletion. Mechanistically, RNA-seq analysis revealed that SP-2509 imparts robust apoptosis through engagement of the endoplasmic reticulum stress pathway. In addition, ETS1/HIST1H2BM were specifically induced/repressed, respectively following SP-2509 treatment only in our hypersensitive cell lines. Together, our findings provide key insights into the mechanisms of SP-2509 cytotoxicity as well as biomarkers that can be used to predict KDM1A inhibitor sensitivity in Ewing sarcoma. Mol Cancer Ther; 17(9); 1902-16. ©2018 AACR.


Conflict of interest statement

Conflict of interest: Stephen L. Lessnick is a consultant/advisory board member for Salarius Pharmaceuticals. Sunil Sharma is a founder and has equity in Salarius Pharmaceuticals

Figures

Fig. 1
Fig. 1. KDM1A is highly expressed in Ewing sarcoma cell lines and tumors
(A) BROAD Institute Cancer Cell line expression data of KDM1A across 36 distinct cancer entities. (B) Representative immuno-histochemical analysis of KDM1A in Ewing sarcoma patient tumors. (C) Event free and overall survival of Ewing sarcoma patients stratified by high (median +0.5xMAD), intermediate and low (median -0.5xMAD) KDM1A expression. Expression data obtained from Postel-Vinay et al., 2012. (D) Correlation between KDM1A expression and patient gender. Expression data obtained as described in (D). Log-rank (Mantel Cox Test) used to determine survival significance. (E) Representative images and quantification of soft agar colonies of A673 and TTC-466 cells stably transduced with iKDM1A or iLuc control shRNA constructs following Puromycin selection. (F) Real-time live cell imaging (IncuCyte ZOOM) of A673 and TTC-466 cells transduced with iKDM1A or iLuc shRNA constructs. Cell proliferation measured for 144 and 180hrs respectively. Dashed line represents 100% confluency (iLuc). Representative phase contrast images are also depicted. Data represents mean ± SEM from three independent experiments for A673 cells and mean ± STDEV from two independent experiments for TTC-466 cells. Asterisks denote statistical significance (*P<0.05, ***P <0.001).
Fig 2
Fig 2. SP-2509 but not GSK-LSD1 significantly reduces the proliferative capacity of Ewing sarcoma cell lines
(A) SP-2509 hypersensitive (A673, TC252) and sensitive (ES-2) Ewing sarcoma cell lines treated with the indicated concentrations of SP-2509, GSK-LSD1, Doxorubicin or vehicle control (DMSO) for 96hrs. Proliferative capacity and induction of apoptosis (caspase 3/7 activity) was measured in real-time through IncuCyte ZOOM live cell imaging. Data represents mean ± SEM confluency or green object count, from three independent experiments. (B) Statistical analysis of proliferation or caspase 3/7 induction compared to vehicle control cells (ns: not significant). (C) Representative phase contrast and green fluorescence (caspase 3/7) images following 72hrs of treatment with the indicated agents.
Fig. 3
Fig. 3. Basal KDM1A mRNA and protein levels do mediate SP-2509 sensitivity in Ewing sarcoma
(A) Lack of correlation between TP53/STAG2/CDKN2A status, EWS/ETS translocation partner and SP-2509 sensitivity (IC50). (B) Relative mRNA expression (fold change) of KDM1A, KMD1A Exon-2a and KDM1B in the Ewing sarcoma cell line cohort. Expression normalized to IMR90 cells. Data represents mean mRNA expression ± STDEV from two independent experiments. (C) Lack of correlation between KDM1A, KMD1A Exon-2a and KDM1B mRNA expression levels and SP-2509 sensitivity (IC50). (D) Western blot analysis of KDM1A, KDM1B, FLI and TP53 protein expression in the cell line cohort. Cell lines are ranked in order of SP-2509 sensitivity (IC50). Data represents mean SP-2509 IC50 ± SEM from three independent experiments. Open symbols denote most (SK-N-MC) and least (TC-71) SP-2509 sensitive cell lines.
Fig. 4
Fig. 4. KDM1B mediates SP-2509 sensitivity in hypersensitive Ewing sarcoma cell lines
Relative (A) KDM1B and (B) KDM1A mRNA levels in A673 and EWS-502 cells following transduction with two unique KDM1B knockdown shRNA constructs (#3 and #7) or iLuc shRNA control. (C) Representative western blot analysis of KDM1B and KDM1A protein levels in A673 and EWS-502 cells following KDM1B knockdown. α-Tubulin was used a loading control. KDM1B densitometry normalized to α-Tubulin and relative to iLuc shRNA control is depicted. (D) Real-time live cell imaging (IncuCyte ZOOM) of A673 and EWS-502 cells transduced with KDM1B and iLuc shRNA constructs. Cell proliferation measured for 120hrs. (E) Cell viability analysis (Cell Titer Glo) of A673 and EWS-502 transduced with the indicated shRNA constructs and treated with SP-2509 (0-4μM) for 72hrs. Data represents mean ± SEM from three-four independent experiments. Asterisks denote statistical significance (*P < 0.05, **P < 0.01, ***P < 0.001, ****P < 0.0001).
Fig. 5
Fig. 5. SP-2509 cytotoxicity is mediated through the ER-stress response pathway
(A) Heatmap representation of genes commonly induced/repressed following SP-2509 treatment (2μM, 48hrs) across 6 ES cell lines compared to vehicle control (DMSO). Three independent replicates per treatment and cell line are depicted. Scale: Mean-centered rlog-transformed expression. (B) Distribution of SP-2509 regulated genes according to class. (C) IPA of the top canonical pathways associated with SP-2509 induced genes (>2 fold increase from vehicle control). (D) Normalized RNA-seq mRNA expression of ER-stress response genes following SP-2509 treatment across the Ewing sarcoma cell line cohort. (E/F) Relative mRNA expression levels of HSPA5, DDIT3, ERN1 and spliced XBP1 in TC252 cells following treatment with DMSO, Thapsigargin (50nM) or SP-2509 (2uM) for the indicated time periods. Data represents mean expression ± SEM from triplicate reactions. (G) PCR analysis of unspliced (XPB1-US) and spliced XBP1 (XPB1-S) in TC252 cells following treatment as in (E). “M” and “W” denote marker and water control respectively. RPL19 housekeeper was used as loading control.

References

    1. Delattre O, Zucman J, Plougastel B, Desmaze C, Melot T, Peter M, et al. Gene fusion with an ETS DNA-binding domain caused by chromosome translocation in human tumours. Nature. 1992;359(6391):162–5. - PubMed
    1. Sorensen PH, Lessnick SL, Lopez-Terrada D, Liu XF, Triche TJ, Denny CT. A second Ewing’s sarcoma translocation, t(21;22), fuses the EWS gene to another ETS-family transcription factor, ERG. Nature genetics. 1994;6(2):146–51. - PubMed
    1. Todorova R. Structure-function based molecular relationships in Ewing’s sarcoma. BioMed research international. 2015;2015:798426. - PMC - PubMed
    1. Marina NM, Liu Q, Donaldson SS, Sklar CA, Armstrong GT, Oeffinger KC, et al. Longitudinal follow-up of adult survivors of Ewing sarcoma: A report from the Childhood Cancer Survivor Study. Cancer. 2017 - PMC - PubMed
    1. Brohl AS, Solomon DA, Chang W, Wang J, Song Y, Sindiri S, et al. The genomic landscape of the Ewing Sarcoma family of tumors reveals recurrent STAG2 mutation. PLoS genetics. 2014;10(7):e1004475. - PMC - PubMed

Publication types

MeSH terms