

Myc and the Tip60 chromatin remodeling complex control neuroblast maintenance and polarity in Drosophila
- PMID: 29997178
- PMCID: PMC6092623
- DOI: 10.15252/embj.201798659
Myc and the Tip60 chromatin remodeling complex control neuroblast maintenance and polarity in Drosophila
Abstract
Stem cells establish cortical polarity and divide asymmetrically to simultaneously maintain themselves and generate differentiating offspring cells. Several chromatin modifiers have been identified as stemness factors in mammalian pluripotent stem cells, but whether these factors control stem cell polarity and asymmetric division has not been investigated so far. We addressed this question in Drosophila neural stem cells called neuroblasts. We identified the Tip60 chromatin remodeling complex and its interaction partner Myc as regulators of genes required for neuroblast maintenance. Knockdown of Tip60 complex members results in loss of cortical polarity, symmetric neuroblast division, and premature differentiation through nuclear entry of the transcription factor Prospero. We found that aPKC is the key target gene of Myc and the Tip60 complex subunit Domino in regulating neuroblast polarity. Our transcriptome analysis further showed that Domino regulates the expression of mitotic spindle genes previously identified as direct Myc targets. Our findings reveal an evolutionarily conserved functional link between Myc, the Tip60 complex, and the molecular network controlling cell polarity and asymmetric cell division.
Keywords: asymmetric cell division; chromatin remodeling; neuroblast; polarity; stem cell.
© 2018 The Authors.
Figures
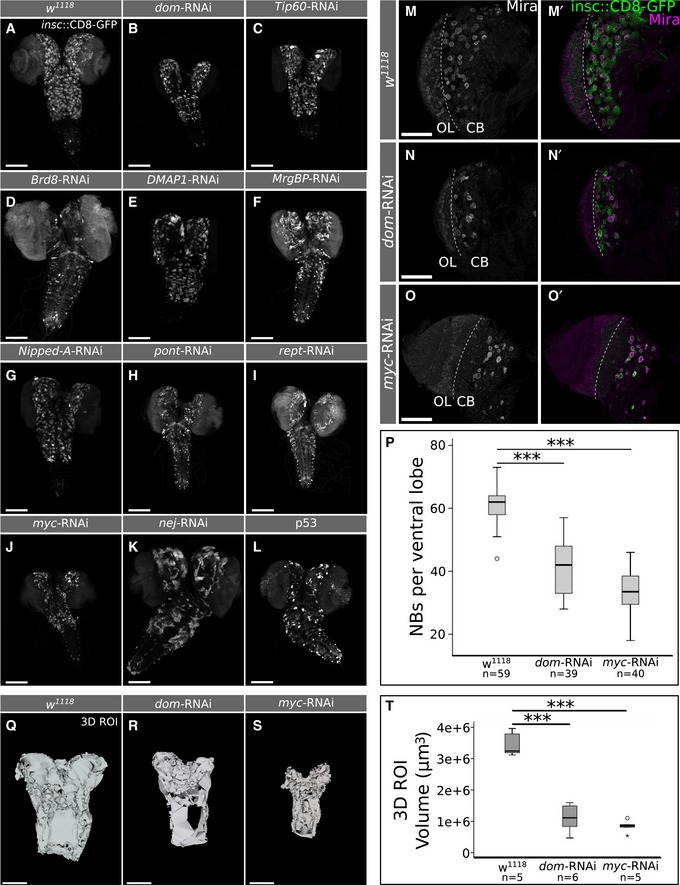
- A–L
Maximum intensity projections of larval brains expressing CD8‐GFP under control of insc::Gal4, marking NBs, and progeny. (A) Wild‐type control. (B–I) RNAi targeting Tip60 complex components. (J, K) RNAi targeting the potential Tip60 complex interactors myc (J) and nej (K). (L) Overexpression of p53.
- M–O
White prepupal ventral brain lobes. Mira‐positive NBs and insc expressing areas are reduced compared to wild‐type (M) upon dom (N) and myc (O) RNAi. OL: optic lobe, CB: central brain.
- P
RNAi targeting dom or myc reduces NB numbers significantly. ***P < 0.001 (ANOVA, Tukey's HSD test). n = number of white prepupal ventral brain lobes assessed.
- Q–S
A 3D region of interest (ROI) of GFP‐positive cells was determined in white prepupal central brains of a wild‐type control (Q), dom‐RNAi (R), and myc‐RNAi (S) to determine the overall volume of neural cells.
- T
Quantification of central brain volumes containing GFP‐positive cells shows a significant reduction upon dom and myc knockdown. ***P < 0.001 (ANOVA, Tukey's HSD test). n = number of 3D ROIs determined in white prepupal brains.

- A
Western blot against GFP was performed on dom::GFP‐Dom ovary lysate, since the ovary has a much higher expression level of dom::GFP‐Dom than the larval brain. w 1118 and GFP expressing ovary lysate served as control. GFP‐Dom has a predicted MW of ≈ 400 kDa, consistent with the size of the band in the dom::GFP‐Dom lane. No free GFP can be detected in dom::GFP‐Dom ovaries.
- B–F
Immunostaining of larval brain. (B–D) GFP‐Dom is expressed in Mira expressing NBs (B, C) can be detected in Pros expressing NB offspring cells (C) and is expressed by Repo positive glial cells, which were imaged at the brain surface area (D). pH3 marks mitotic cells. DAPI stains DNA. Dom is nuclear in all cells including NBs. Squares indicate regions shown at higher magnification in the bottom right corner of the same panel. (E, F) dom::GFP‐Dom brains without (E) and with knockdown of dom (VDRC 7787) using insc::Gal4 taken with the same settings. Knockdown of dom results in loss of the GFP‐Dom signal (F’). Scale bars in (B–D) = 20 μm, in (E, F) = 5 μm.

- A–D
insc::Gal4 was used to drive CD8‐GFP and transgene expression. Maximum intensity projections of larval brains are shown. (A) w 1118 control. (B) RNAi targeting dom. Control (A) and dom‐RNAi (B) third‐instar larval brains contain few CD8‐GFP‐positive cells in the posterior‐most end of the ventral nerve cord (brackets) where many NBs undergo apoptosis in the first‐instar larval stage. (C) P35 overexpression leads to ectopic lineages, especially well visible in the posterior‐most end of the ventral nerve cord (bracket). (D) Overexpression of P35 together with dom‐RNAi does not restore all neural cells but maintains ectopic lineages (bracket).
- E
Quantification of NBs in white prepupal ventral brain lobes of the genotypes shown in (A–D). ***P < 0.001 (ANOVA; Tukey's HSD test). n = number of individuals analyzed. NBs were identified by Mira expression. The box represents the 1st to 3rd quartiles; the median is given as line. The whiskers show highest and lowest data points.
- F, G
White prepupal ventral brain lobes stained for Mira to mark NBs and Dcp‐1 to mark apoptotic cells. In both the w 1118 control (F) and upon dom‐RNAi (VDRC 7787) (G), no Dcp‐1‐positive NBs can be observed. OL: optic lobe, CB: central brain. Squares indicate magnifications.
- H
Quantification of apoptotic NBs based on stainings as shown in (F, G). In both larval and white prepupal ventral brain lobes, no apoptotic NBs can be observed. ns, not significant (Kruskal–Wallis test). n = number of ventral brain lobes.

- A
In mitotic, pH3 positive, control (w 1118) NBs Baz and Mira localize to opposite sides of the cortex.
- B–D
Knockdown (RNAi by insc::Gal4) of dom (B, C) or myc (D).
- E
Quantification of cortical polarity in larval NBs based on Baz localization. ***P < 0.001 (Kruskal–Wallis test; Mann–Whitney U‐test with Bonferroni correction). n = number of individual brains assessed. For each, a minimum of five mitotic NBs located in the ventral brain lobe region were examined.
- F
The amount of mitotic NBs is significantly decreased upon dom or myc knockdown. ***P < 0.001 (Kruskal–Wallis test; Mann–Whitney U‐test with Bonferroni correction). n = number of ventral brain lobes analyzed. pH3 was used to mark mitotic cells. NBs were identified by Mira expression. The mitotic index is defined as the percentage of Mira‐positive NBs showing pH3 staining.

- A–C
Time series of larval NB divisions visualized by CD8‐GFP expression under control of insc::Gal4. (A) Wild‐type control. (B) RNAi targeting dom. (C) RNAi targeting myc. Mother NB cells (mc) are marked in pink, daughter cells (dc1 and dc2) are marked in turquoise and orange as shown in (D). Elapsed time in min is given in the upper right corner of each panel.
- D
Daughter cell size ratios (dc1: bigger daughter cell) of single NB divisions. ***P < 0.001 (Kruskal–Wallis test; Mann–Whitney U‐test with Bonferroni correction). n = single NB divisions analyzed by live imaging.
- E
NB diameters in fixed mitotic larval NBs (prior to cytokinesis). Control NBs (w 1118) are significantly bigger than dom or myc‐RNAi NBs. ***P < 0.001 (Kruskal–Wallis test; Mann–Whitney U‐test). n = number of NBs.
- F
Mitotic NBs are significantly bigger than interphase NBs in the control (w 1118), but not upon knockdown of dom or myc. *P < 0.05; ns, not significant (Wilcoxon signed rank test with Bonferroni correction). Mitotic NBs were defined as pH3 positive and prior to onset of cytokinesis. Interphase NBs were determined as pH3 negative. n = number of NBs.

- A–D
Larval control (w 1118) interphase NB shows cytoplasmic localization of Pros (A). RNAi targeting dom (B), myc (C), or H2Av (D) was induced by insc::Gal4 and leads to Pros nuclear entry. pH3 marks mitotic cells. Arrowheads indicate NB nuclei.
- E
Quantification of NBs with normal, cytoplasmic localization of Pros. Knockdown of dom, myc, or H2Av leads to a significant increase of NBs with Pros nuclear entry in contrast to the wild‐type. ***P < 0.001 (Kruskal–Wallis test; Mann–Whitney U‐test with Bonferroni correction). n = number of individual brains. Per individual, five or more interphase NBs in the ventral central brain region were scored.
- F–H
H4K8 acetylation (Ac) in wild‐type larval NBs (F) is readily detectable in the nucleus. Knockdown of dom (G) or myc (H) by RNAi under control of insc::Gal4 leads to reduced H4K8Ac levels in NB nuclei. NB nuclei are marked by arrowheads.
- I
Quantification of the mean fluorescence intensity of H4K8Ac staining in NB nuclei. Confocal images were taken with identical settings. Knockdown of dom or myc significantly reduces the H4K8Ac levels compared to the wild‐type control. ***P < 0.001 (ANOVA; Tukey's HSD test).

- A–H
Immunostaining of larval interphase NBs marked with Mira and by absence of pH3 staining. (A) In the wild‐type control, Pros is cytoplasmic and not detectable in the nucleus (arrowhead) stained with Hoechst. (B–H) insc::Gal4 was used to drive RNAi targeting Tip60 complex members. Upon knockdown, Pros localizes to interphase NB nuclei (arrowheads).
- I
Boxplot showing sizes of mitotic NBs prior to cytokinesis. Knockdown of the ribosomal protein RpL10Aa leads to significantly smaller NBs. ***P < 0.001 (independent samples t‐test). n = number of NBs.
- J
Larval w 1118 control interphase NB shows cytoplasmic localization of Pros. Arrowheads indicate NB nuclei.
- K
RNAi targeting RpL10Aa induced by insc::Gal4 leads to Pros nuclear entry. pH3 marks mitotic cells. Arrowheads indicate NB nuclei.
- L
The localization of Pros is cytoplasmic in 100% of w 1118 control NBs. RpL10Aa knockdown leads to a significant decrease of NBs with normal Pros localization. *P < 0.05 (Mann–Whitney U‐test). n = number of individual brains assessed. Per individual five or more interphase NBs have been assessed in the ventral region of the central brain lobes.
- M
In mitotic, pH3‐positive, w 1118 control, NBs Baz and Mira localize to opposite sides of the cortex.
- N
Knockdown of RpL10Aa via insc::Gal4 does not influence NB polarity.
- O
Assessment of NB polarity based on Baz staining. ns, not significant (Mann–Whitney U‐test). n = number of individual brains. Per individual at least five NBs have been analyzed in the ventral region of the central brain lobes.

- A–C
Immunostaining of L3 brains of indicated genotypes. Mira marks NBs (arrowheads), Hoechst marks nuclei. H2Av co‐localizes with Hoechst staining. Scale bars = 5 μm.
- D
Quantification of H2Av‐staining intensity as indicated in (A–C). Knockdown of dom and myc increases H2Av intensity. **P < 0.01 (Kruskal–Wallis test; Mann–Whitney U‐test with Bonferroni correction). n = number of NBs analyzed. The box represents the 1st to 3rd quartiles; the median is given as line. The whiskers show highest and lowest data points.

GO‐term analysis was performed using DAVID. Fold enrichment is presented as −log (P‐value). Clusters are indicated by color code; enrichment score is noted in brackets. The analysis revealed an enrichment of GO‐terms for neural differentiation. Cluster 10 contains GO‐terms for NB development.
Analysis of Myc ChIP data from L3 larvae (GSE 49774) shows that Myc occupies the aPKC promoter region (red box). IGV was used to visualize the publicly available bam files.
ChIP analysis of Myc and Dom on the RpS6 promoter. Immunoprecipitated DNA was compared to Input and is shown as percentage. IgG serves as a control to identify background levels. Error bars represent standard deviations. n = 3 biological replicates.

- A
Potential dom targets belonging to GO‐term “establishment and maintenance of NB polarity” (GO45196). Log2FoldChange (magenta) and fold enrichment [green, presented as −log(P‐value)] of the three identified genes aPKC (CG42783, log2FC = −0.65, P adj =8.01E−18), Cdc42 (CG12530, log2FC = −0.22, P adj =0.019) and mgr (CG6719, log2FC = −0.3, P adj =0.048) are plotted.
- B–D
Immunostaining of larval brains confirms reduced aPKC protein levels compared to the w 1118 control (B) upon dom (C) and myc (D) RNAi driven by insc::Gal4. Mira marks NBs.
- E, F
ChIP analysis of Myc (E) and Dom (F) on the aPKC promoter region. Immunoprecipitated DNA was compared to Input and is shown as percentage. IgG is used as a control to identify background levels. Error bar represents standard deviation. n = 3.
- G, H
Maximum intensity projections of larval brains expressing CD8‐GFP under control of insc::Gal4. (G) Wild‐type (w 1118) control. (H) RNAi targeting aPKC.
- I, J
3D region of interest (ROI) of GFP‐positive cells in white prepupal central brains of a wild‐type control (I) and aPKC‐RNAi (J).
- K
Central brain volume is significantly reduced upon aPKC knockdown. ***P < 0.001 (independent samples t‐test).
- L
Quantification of NB numbers in white prepupal ventral brain lobes. ***P < 0.001 (independent samples t‐test). n = number of ventral brain lobes assessed.
- M, N
NB polarity in w 1118 control NBs (M) and upon aPKC knockdown (N). Mitotic NBs are marked with pH3.
- O
Quantification of cortical polarity (based on Baz localization) in aPKC‐depleted larval NBs. ***P < 0.001 (Mann–Whitney U‐test). n = number of individual brains assessed. For each individual, five or more mitotic NBs located in the ventral brain lobe region were examined.
- P
Time series of a symmetrically dividing, aPKC‐depleted larval NB. insc::Gal4 was used to drive aPKC‐RNAi and CD8‐GFP. The mother NB cell (mc) is marked in pink; daughter cells (dc1 and dc2) are marked in turquoise and orange as shown in (Q). Elapsed time in min is given in the upper right corner of each panel.
- Q
Daughter cell size ratios (dc1: bigger daughter cell) of single NB divisions. ***P < 0.001 (independent samples t‐test). n = single NB divisions analyzed by live imaging.
- R
Compared to wild‐type NBs, aPKC knockdown NBs are significantly smaller. ***P < 0.001 (Mann–Whitney U‐test). n = number of NBs measured. NBs were analyzed in mitosis, prior to cytokinesis.
- S, T
In larval w 1118 control interphase NBs (S), Pros is cytoplasmic. (T) Larval interphase NBs depleted of aPKC by RNAi display Pros nuclear entry. Arrowheads point at NB nuclei.
- U
Quantification of aPKC‐depleted NBs with normal, cytoplasmic Pros localization, and comparison with the wild‐type. ***P < 0.001 (Mann–Whitney U‐test). n = number of individual brains analyzed. A minimum of five NBs in the ventral lobe per individual were scored.

- A–F
Maximum intensity projections of larval brains expressing CD8‐GFP under control of insc::Gal4. (A) Wild‐type (w 1118) control. (B, C) RNAi targeting dom (B) or myc (C). (D) Overexpression of aPKC. (E, F) Overexpression of aPKC partially restores the number of neural cells upon dom (E) or myc (F) knockdown.
- G
Quantification of NB numbers in white prepupal ventral brain lobes. ***P < 0.001; ns, not significant (Tukey's HSD test). n = number of ventral brain lobes assessed.
- H–J
Cortical polarity in mitotic (pH3 positive) w 1118 NBs (H) and upon aPKC overexpression in dom‐RNAi (I) and myc‐RNAi (J).
- K
Quantification of cortical NB polarity (based on Baz localization). ***P < 0.001; *P < 0.05; ns, not significant (Mann–Whitney U‐test with Bonferroni correction). n = number of individual brains assessed. For each individual, at least five mitotic NBs located in the ventral brain lobe region were examined.
- L
Mitotic NB diameter measured prior to cytokinesis. ***P < 0.001; *P < 0.05; ns, not significant (Mann–Whitney U‐test). n = number of NBs.
- M–O
aPKC overexpression in interphase NBs (M) does not affect cytoplasmic localization of Pros. aPKC overexpression in dom‐RNAi (N) and myc‐RNAi (O) does not prevent Pros nuclear entry in NBs. Arrowheads depict NB nuclei.
- P
Quantification of interphase NBs with cytoplasmic Pros. ***P < 0.001; ns, not significant (Mann–Whitney U‐test with Bonferroni correction).
- Q, R
Time series of dom‐RNAi (Q) and myc‐RNAi (R) NBs with aPKC overexpression dividing symmetrically. The mother cell (mc) is highlighted in pink. The resulting daughter cells (dc1 and dc2) are shown in turquoise and orange. Elapsed time in min is given in the upper right corner of each panel.
- S
Dotplot showing daughter cell ratios. Both dom‐ and myc‐depleted NBs with aPKC overexpression show symmetric divisions in 13.89 and 26.09%, respectively. n = single NB divisions analyzed by live imaging.

- A–C
Time series NBs of indicated genotypes dividing into three cells (marked in pink, turquoise, and yellow). Note that cell 2 in (B) is slightly out of focus. In (C), cell 2 moves out of focus prior to the second division.
- D–J
Tub staining of mitotic NBs marked with Mira and pH3 of genotypes as shown. Spindle orientation is highlighted in the right panel. Note that spindle and nuclear morphology is abnormal in dom‐ and myc‐depleted NBs (G–J).
- K
Model for the function of Myc and the Tip60 complex in postembryonic NBs. Myc binds to Bap55, Pont, and Rept and might recruit the Tip60 complex to promoter regions of regulated genes via this interaction. Regulation of gene expression appears to be influenced by H2Av incorporation and histone acetylation. We identified aPKC as a common target of Myc and the Tip60 component Dom. Moreover, Dom and Myc regulate spindle organization and additional unidentified regulators of NB fate. Mutation or knockdown of Myc or Tip60 complex members results in loss of NB polarity, which can be restored by aPKC overexpression, as well as symmetric divisions, Pros nuclear entry and NB loss.
Similar articles
-
Interplay between the transcription factor Zif and aPKC regulates neuroblast polarity and self-renewal.Dev Cell. 2010 Nov 16;19(5):778-85. doi: 10.1016/j.devcel.2010.10.007. Dev Cell. 2010. PMID: 21074726
-
Drosophila melanogaster Neuroblasts: A Model for Asymmetric Stem Cell Divisions.Results Probl Cell Differ. 2017;61:183-210. doi: 10.1007/978-3-319-53150-2_8. Results Probl Cell Differ. 2017. PMID: 28409305 Review.
-
Drosophila Aurora-A kinase inhibits neuroblast self-renewal by regulating aPKC/Numb cortical polarity and spindle orientation.Genes Dev. 2006 Dec 15;20(24):3464-74. doi: 10.1101/gad.1489406. Genes Dev. 2006. PMID: 17182871 Free PMC article.
-
The Rap1-Rgl-Ral signaling network regulates neuroblast cortical polarity and spindle orientation.J Cell Biol. 2011 Nov 14;195(4):553-62. doi: 10.1083/jcb.201108112. J Cell Biol. 2011. PMID: 22084305 Free PMC article.
-
The Case of the Scribble Polarity Module in Asymmetric Neuroblast Division in Development and Tumorigenesis.Int J Mol Sci. 2020 Apr 20;21(8):2865. doi: 10.3390/ijms21082865. Int J Mol Sci. 2020. PMID: 32325951 Free PMC article. Review.
Cited by
-
Effect of fibronectin, FGF-2, and BMP4 in the stemness maintenance of BMSCs and the metabolic and proteomic cues involved.Stem Cell Res Ther. 2021 Mar 6;12(1):165. doi: 10.1186/s13287-021-02227-7. Stem Cell Res Ther. 2021. PMID: 33676544 Free PMC article.
-
Arc Regulates Transcription of Genes for Plasticity, Excitability and Alzheimer's Disease.Biomedicines. 2022 Aug 11;10(8):1946. doi: 10.3390/biomedicines10081946. Biomedicines. 2022. PMID: 36009494 Free PMC article.
-
Splice variants of DOMINO control Drosophila circadian behavior and pacemaker neuron maintenance.PLoS Genet. 2019 Oct 28;15(10):e1008474. doi: 10.1371/journal.pgen.1008474. eCollection 2019 Oct. PLoS Genet. 2019. PMID: 31658266 Free PMC article.
-
OsARP6 Is Involved in Internode Elongation by Regulating Cell-Cycle-Related Genes.Biomolecules. 2021 Jul 26;11(8):1100. doi: 10.3390/biom11081100. Biomolecules. 2021. PMID: 34439766 Free PMC article.
-
The transcription elongation factors Spt4 and Spt5 control neural progenitor proliferation and are implicated in neuronal remodeling during Drosophila mushroom body development.Front Cell Dev Biol. 2024 Oct 9;12:1434168. doi: 10.3389/fcell.2024.1434168. eCollection 2024. Front Cell Dev Biol. 2024. PMID: 39445331 Free PMC article.
References
-
- Albertson R, Doe CQ (2003) Dlg, Scrib and Lgl regulate neuroblast cell size and mitotic spindle asymmetry. Nat Cell Biol 5: 166–170 - PubMed
-
- Bachmann A, Knust E (2008) The use of P‐element transposons to generate transgenic flies. Methods Mol Biol 420: 61–77 - PubMed
-
- Bello BC, Hirth F, Gould AP (2003) A pulse of the Drosophila Hox protein Abdominal‐A schedules the end of neural proliferation via neuroblast apoptosis. Neuron 37: 209–219 - PubMed
Publication types
MeSH terms
Substances
LinkOut - more resources
Full Text Sources
Other Literature Sources
Molecular Biology Databases
Miscellaneous
