. 2018 Sep 12;92(19):e00648-18.
doi: 10.1128/JVI.00648-18. Print 2018 Oct 1.

Nup153 Unlocks the Nuclear Pore Complex for HIV-1 Nuclear Translocation in Nondividing Cells

Affiliations

Nup153 Unlocks the Nuclear Pore Complex for HIV-1 Nuclear Translocation in Nondividing Cells

Cindy Buffone et al. J Virol. .

Abstract

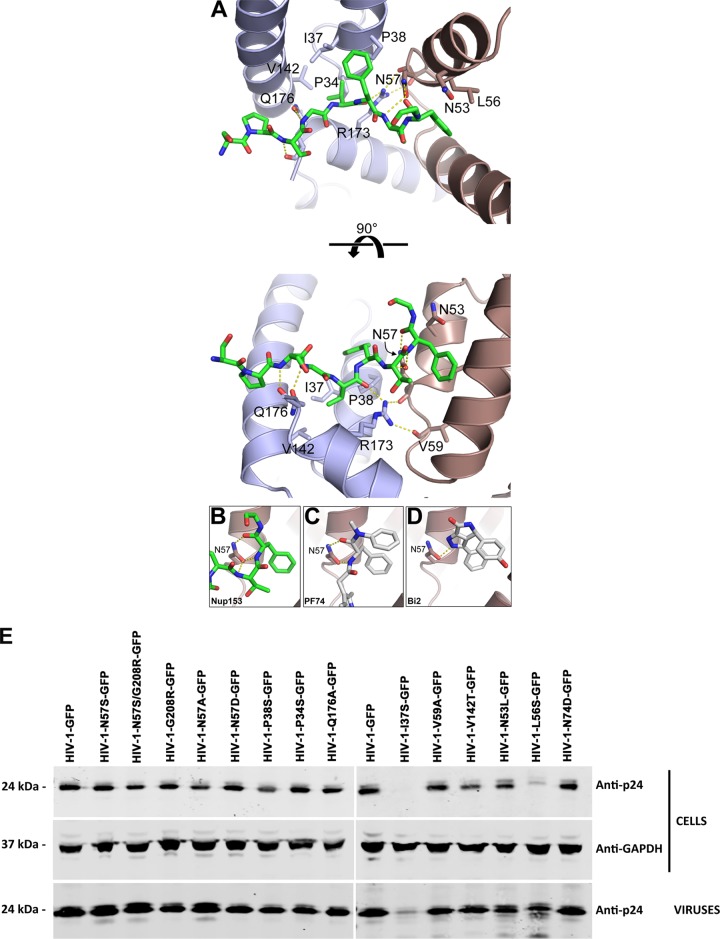
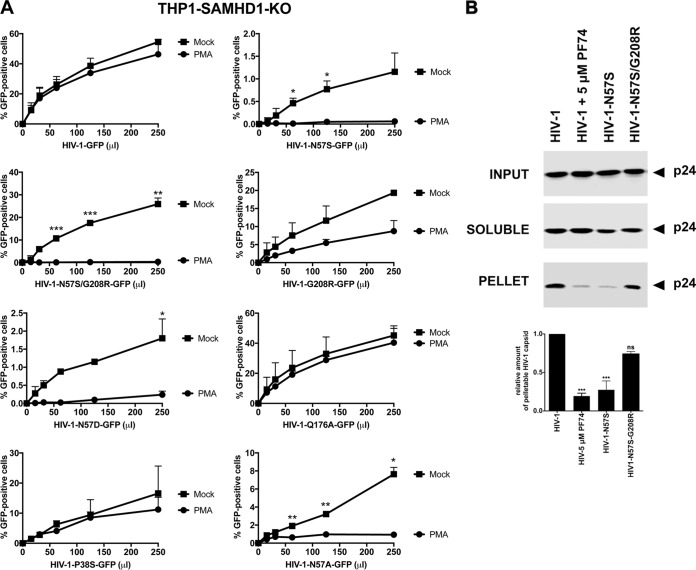
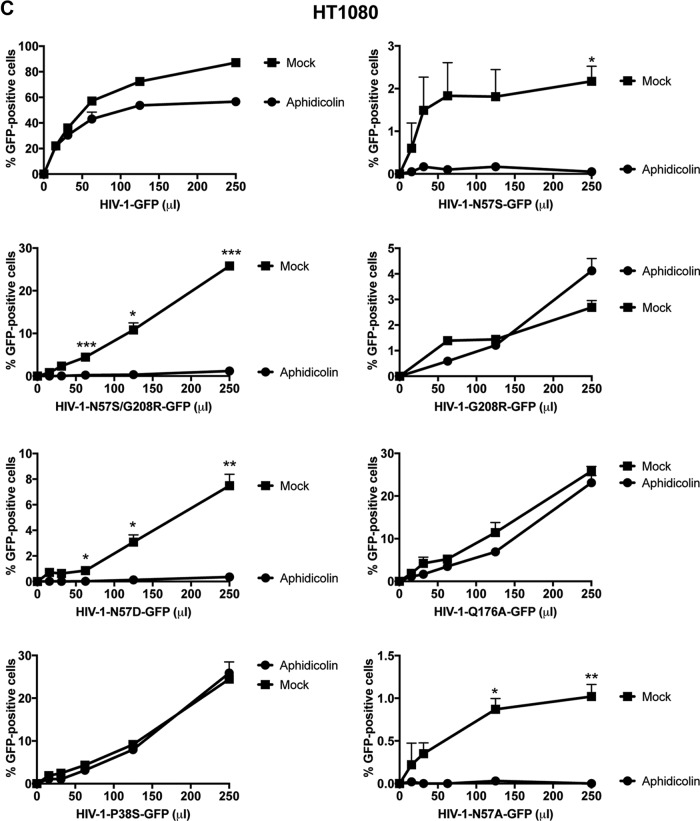
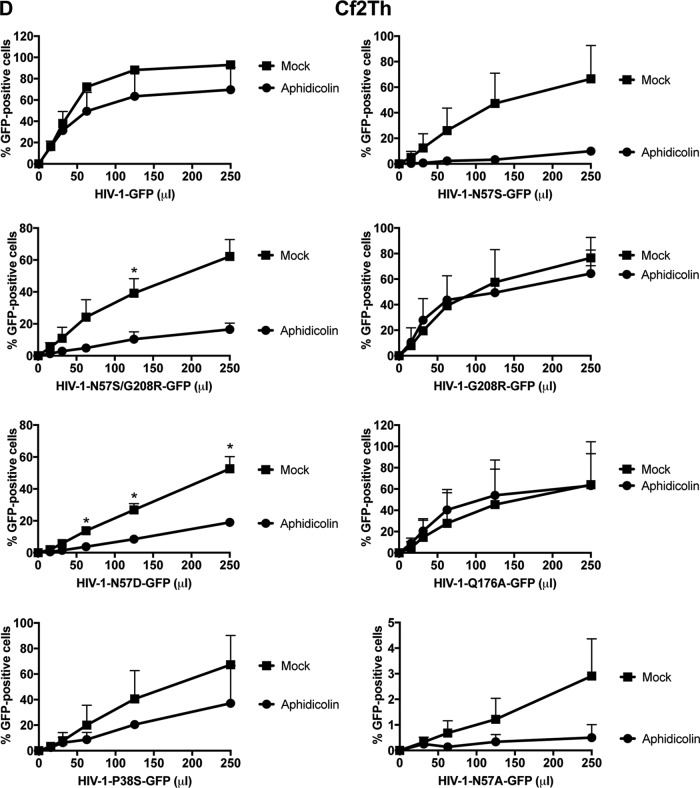
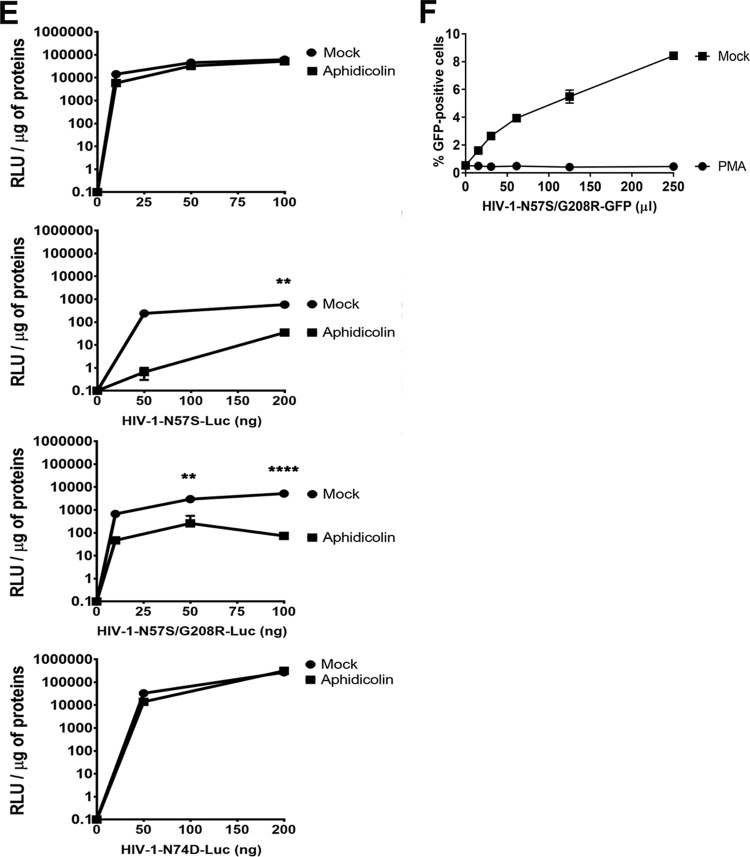
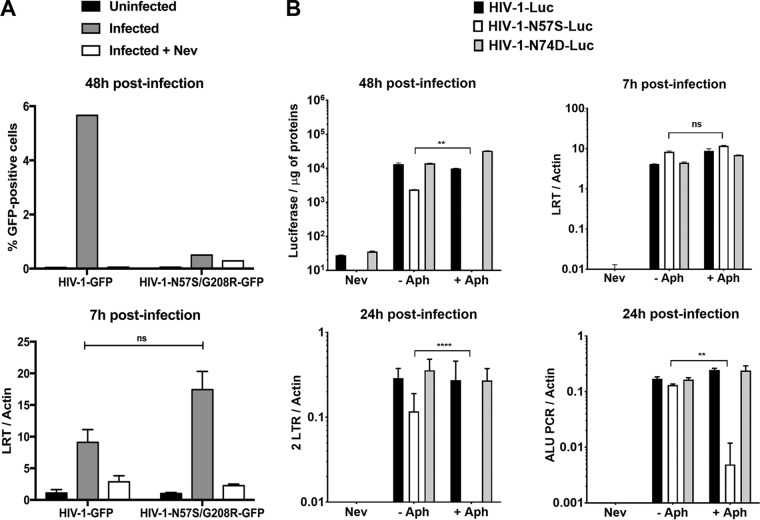
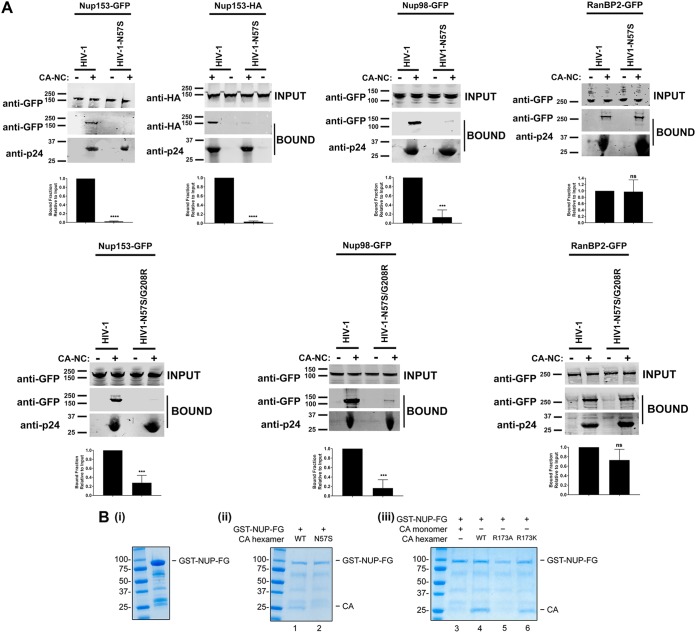
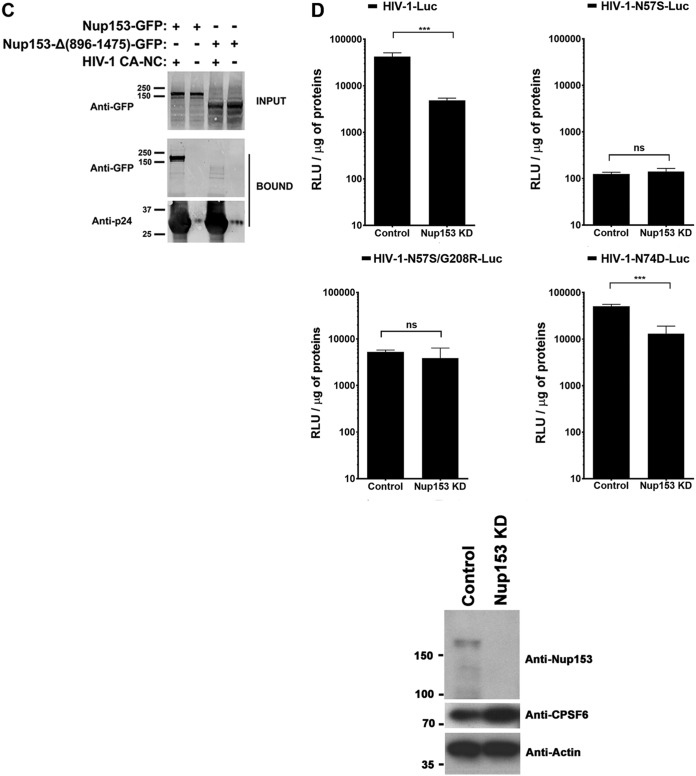
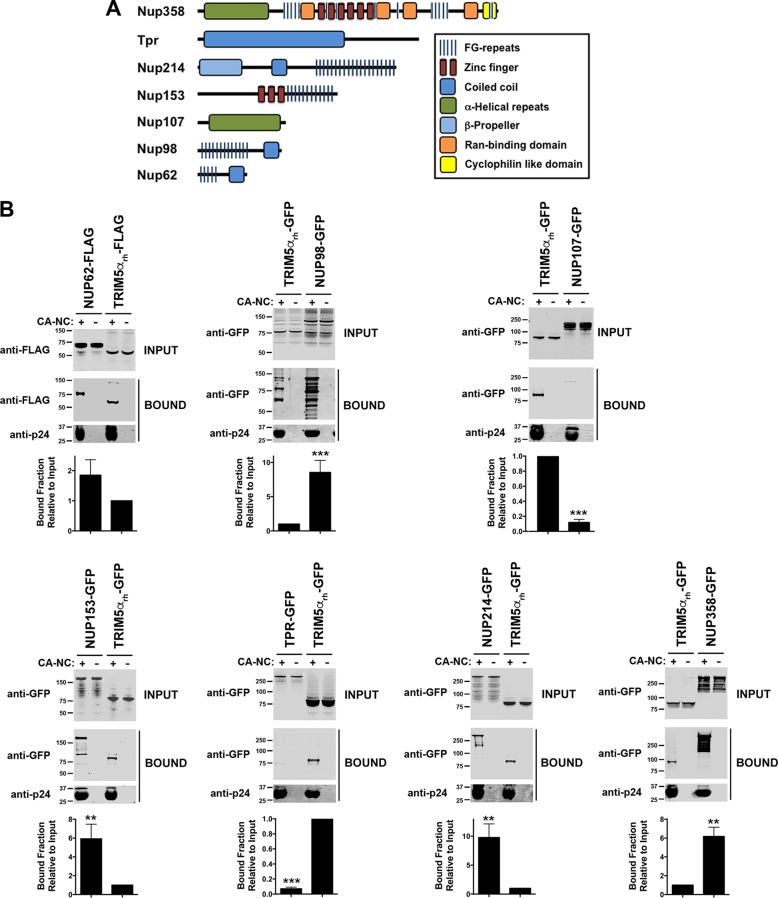
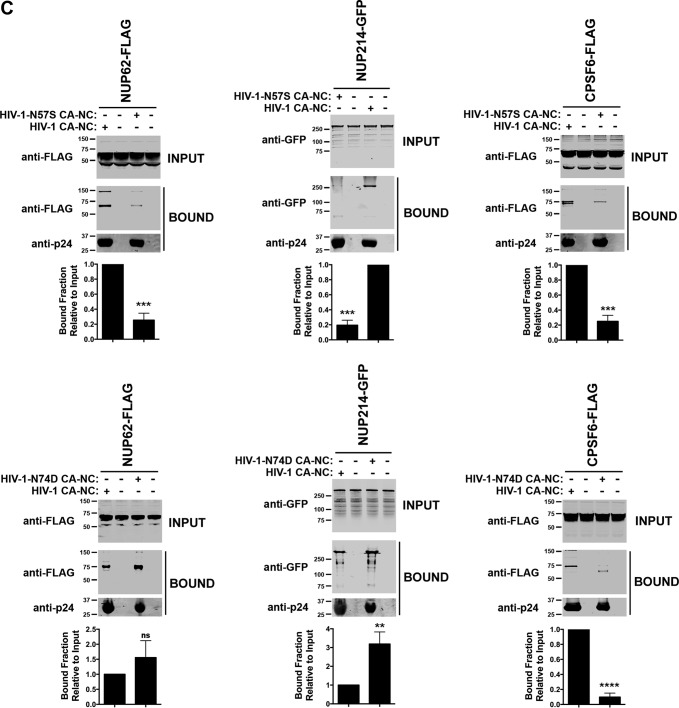
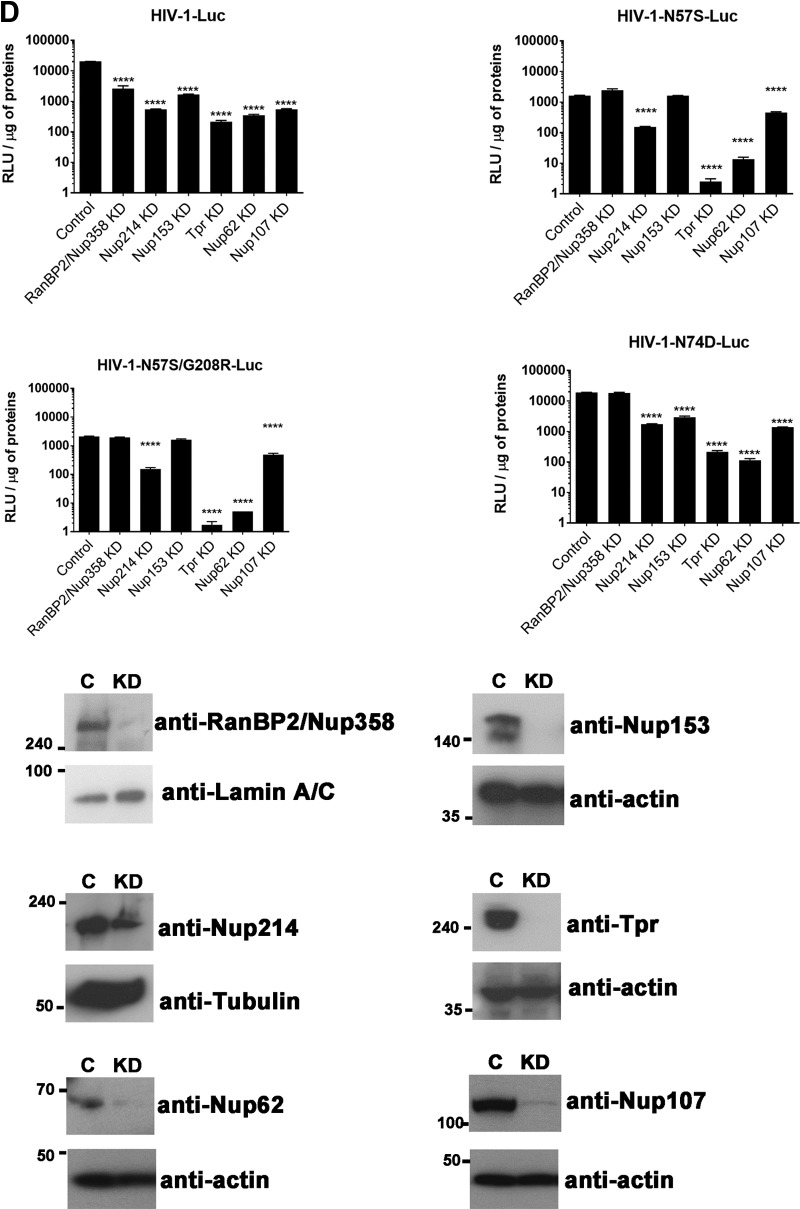
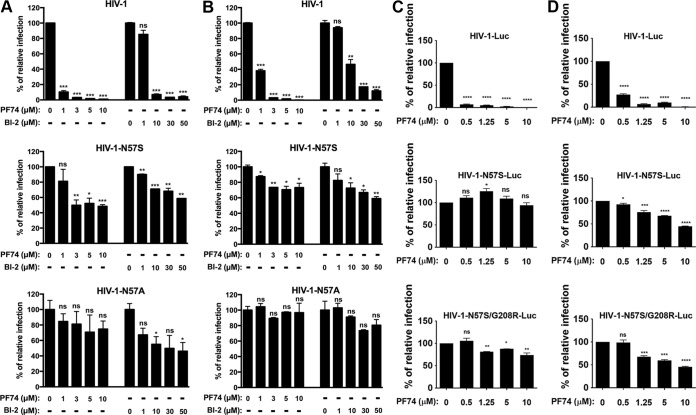
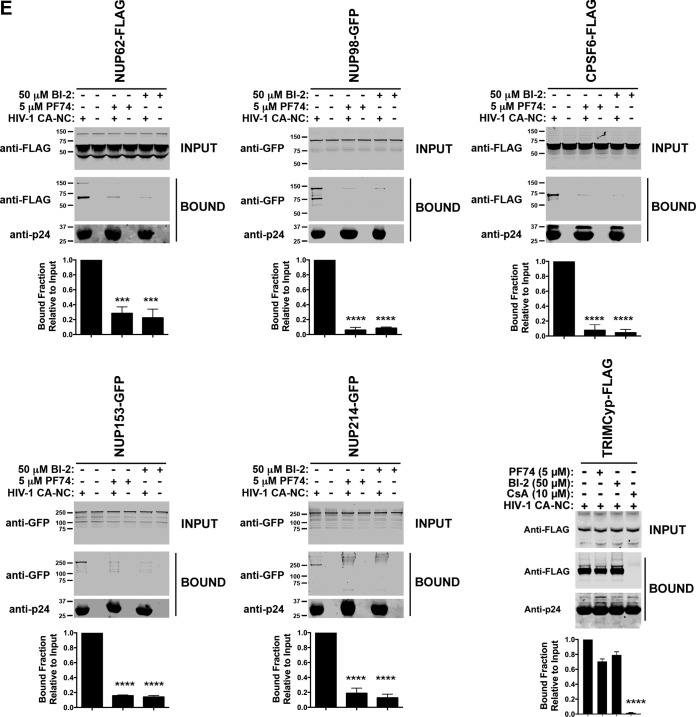
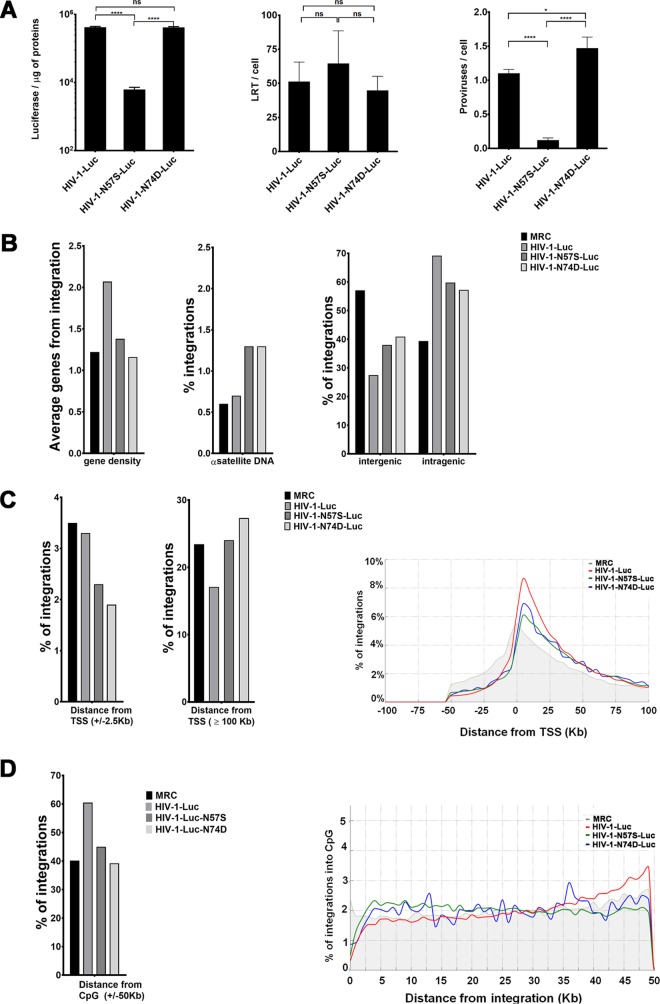
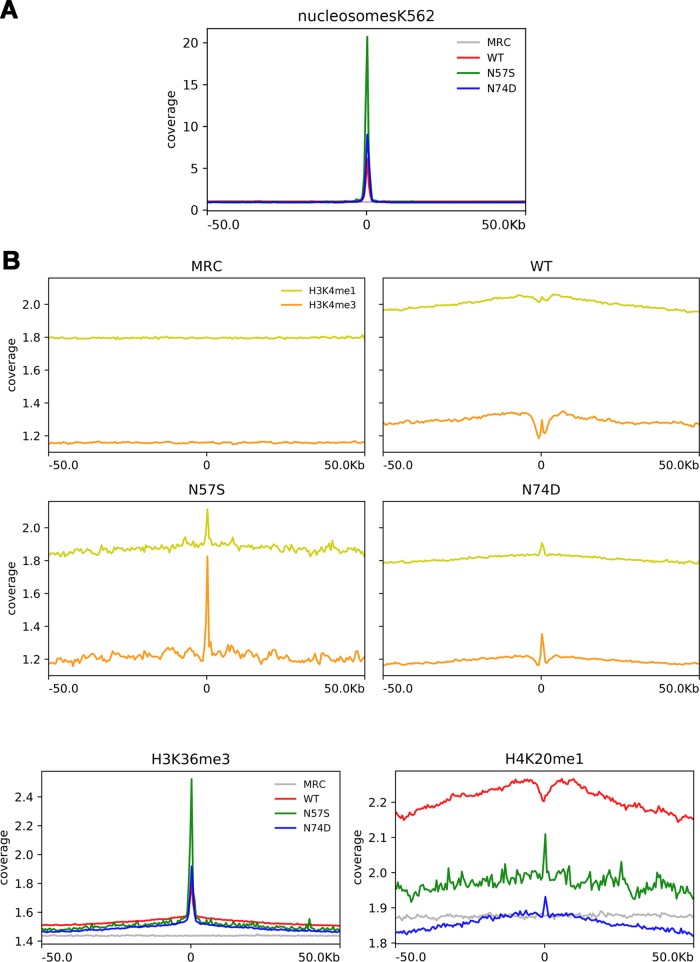
Human immunodeficiency virus type 1 (HIV-1) displays the unique ability to infect nondividing cells. The capsid of HIV-1 is the viral determinant for viral nuclear import. To understand the cellular factors involved in the ability of HIV-1 to infect nondividing cells, we sought to find capsid mutations that allow the virus to infect dividing but not nondividing cells. Because the interaction of capsid with the nucleoporin protein 153 (Nup153) is important for nuclear import of HIV-1, we solved new crystal structures of hexameric HIV-1 capsid in complex with a Nup153-derived peptide containing a phenylalanine-glycine repeat (FG repeat), which we used to guide structure-based mutagenesis of the capsid-binding interface. HIV-1 viruses with mutations in these capsid residues were tested for their ability to infect dividing and nondividing cells. HIV-1 viruses with capsid N57 substitutions infected dividing but not nondividing cells. Interestingly, HIV-1 viruses with N57 mutations underwent reverse transcription but not nuclear translocation. The mutant capsids also lost the ability to interact with Nup153 and CPSF6. The use of small molecules PF74 and BI-2 prevented the interaction of FG-containing nucleoporins (Nups), such as Nup153, with the HIV-1 core. Analysis of integration sites in HIV-1 viruses with N57 mutations revealed diminished integration into transcriptionally active genes in a manner resembling that of HIV-1 in CPSF6 knockout cells or that of HIV-1-N74D. The integration pattern of the N57 mutant HIV-1 can be explained by loss of capsid interaction with CPSF6, whereas capsid interaction with Nup153 is required for HIV-1 to infect nondividing cells. Additionally, the observed viral integration profiles suggested that integration site selection is a multiparameter process that depends upon nuclear factors and the state of the cellular chromatin.IMPORTANCE One of the key advantages that distinguish lentiviruses, such as HIV-1, from all other retroviruses is its ability to infect nondividing cells. Interaction of the HIV-1 capsid with Nup153 and CPSF6 is important for nuclear entry and integration; however, the contribution of each of these proteins to nuclear import and integration is not clear. Using genetics, we demonstrated that these proteins contribute to different processes: Nup153 is essential for the HIV-1 nuclear import in nondividing cells, and CPSF6 is important for HIV-1 integration. In addition, nuclear factors such as CPSF6 and the state of the chromatin are known to be important for integration site selection; nevertheless, the preferential determinant influencing integration site selection is not known. This work demonstrates that integration site selection is a multiparameter process that depends upon nuclear factors and the state of the cellular chromatin.

Keywords: CPSF6; HIV integration; HIV nuclear import; HIV-1; NPC; Nup153; capsid binding; integration; nondividing cells; nuclear import.


Figures

FIG 1
FIG 1
Structure of Nup153 FG in complex with hexameric HIV-1 capsid. (A) Structure of NUP153 FG peptide (green) in its binding pocket within the hexameric HIV-1 capsid. The capsid side chains that contact the peptide are shown as sticks and labeled. N57 is binding Nup153 (B), PF74 (C) (42), and BI2 (D) (43). Hydrogen bonds are shown as dashed yellow lines. (E) Production and maturation of HIV-1 capsid mutants viruses. The indicated HIV-1 viruses were produced in human 293T cells. Producer cells and purified viruses were analyzed for HIV-1 capsid expression by Western blotting using anti-p24 antibodies. Producer cells validated for glyceraldehyde-3-phosphate dehydrogenase (GAPDH) expression were used as loading controls. Experiments were performed three times, and a representative example is shown.
FIG 2
FIG 2
HIV-1 viruses bearing changes on the capsid residue N57 are not able to infect nondividing cells. (A) PMA-treated (PMA) or untreated (Mock) THP-1–SAMHD1 knockout (KO) cells were challenged with increasing amounts of the indicated HIV-1-GFP viruses. Infection was determined by measuring the percentage of GFP-positive cells at 48 hpi. PMA-treated THP-1–SAMHD1 KO cells are used as a model of noncycling cells. (B) HIV-1-N57S/G208R recovers core stability during infection. Canine Cf2Th cells were challenged with the indicate viruses, and core stability was assayed by performing the fate-of-the-capsid assay. Eight hpi, cells were lysed and a postnuclear fraction (INPUT) was separated into SOLUBLE and PELLET fractions by using a 50% sucrose gradient, as described in Materials and Methods. INPUT, SOLUBLE, and PELLET fractions were analyzed for capsid using anti-p24 antibodies. PELLET represents the fraction of capsid that is forming cores. Experiments were performed at least three times, and a representative example is shown. (C to E) Human HT1080 (C), dog Cf2Th (D), or human HeLa (E) cells pretreated for 12 h with 0.5 μg/ml aphidicolin were challenged with increasing amounts of the indicated HIV-1 viruses. The use of 0.5 μg/ml of aphidicolin for 12 h stops the cell cycle at S phase, as determined by analyzing DNA content per cell using propidium iodide. Infection was determined by measuring the percentage of GFP-positive cells or the luciferase activity at 48 hpi, and standard deviations for triplicates are shown. Results were analyzed using two-tailed Student's t test. Differences were considered statistically significant at a P value of <0.05 (*), <0.01 (**), or <0.001 (***) or were nonsignificant. (F) PMA-treated (PMA) or untreated (Mock) U937 cells were challenged with increasing amounts of HIV-1-N57S/G208R-GFP viruses. Infection was determined by measuring the percentage of GFP-positive cells at 48 hpi. Experiments were performed at least three times, and a representative example is shown.
FIG 2
FIG 2
HIV-1 viruses bearing changes on the capsid residue N57 are not able to infect nondividing cells. (A) PMA-treated (PMA) or untreated (Mock) THP-1–SAMHD1 knockout (KO) cells were challenged with increasing amounts of the indicated HIV-1-GFP viruses. Infection was determined by measuring the percentage of GFP-positive cells at 48 hpi. PMA-treated THP-1–SAMHD1 KO cells are used as a model of noncycling cells. (B) HIV-1-N57S/G208R recovers core stability during infection. Canine Cf2Th cells were challenged with the indicate viruses, and core stability was assayed by performing the fate-of-the-capsid assay. Eight hpi, cells were lysed and a postnuclear fraction (INPUT) was separated into SOLUBLE and PELLET fractions by using a 50% sucrose gradient, as described in Materials and Methods. INPUT, SOLUBLE, and PELLET fractions were analyzed for capsid using anti-p24 antibodies. PELLET represents the fraction of capsid that is forming cores. Experiments were performed at least three times, and a representative example is shown. (C to E) Human HT1080 (C), dog Cf2Th (D), or human HeLa (E) cells pretreated for 12 h with 0.5 μg/ml aphidicolin were challenged with increasing amounts of the indicated HIV-1 viruses. The use of 0.5 μg/ml of aphidicolin for 12 h stops the cell cycle at S phase, as determined by analyzing DNA content per cell using propidium iodide. Infection was determined by measuring the percentage of GFP-positive cells or the luciferase activity at 48 hpi, and standard deviations for triplicates are shown. Results were analyzed using two-tailed Student's t test. Differences were considered statistically significant at a P value of <0.05 (*), <0.01 (**), or <0.001 (***) or were nonsignificant. (F) PMA-treated (PMA) or untreated (Mock) U937 cells were challenged with increasing amounts of HIV-1-N57S/G208R-GFP viruses. Infection was determined by measuring the percentage of GFP-positive cells at 48 hpi. Experiments were performed at least three times, and a representative example is shown.
FIG 3
FIG 3
Infection of nondividing cells by HIV-1-N57S is stopped after reverse transcription but prior to nuclear translocation. (A) PMA-treated THP-1–SAMHD1 knockout (KO) cells were challenged with the indicated DNase-pretreated HIV-1-GFP viruses. (Upper) Infection was determined by measuring the percentage of GFP-positive cells by flow cytometry at 48 hpi. (Lower) In parallel, cells from similar infections were lysed at 7 hpi and total DNA extracted. The DNA samples collected at 7 hpi postinfection were used to determine the levels of late reverse transcripts by real-time PCR. As a control, we used 10 μM the reverse transcription inhibitor nevirapine (Nev). Late reverse transcript levels were normalized to actin. (B) Similarly, HeLa cells pretreated with 0.5 μg/ml aphidicolin for 12 h were subsequently infected by the indicated DNase-pretreated HIV-1–Luc viruses. (Upper) Infection was determined by measuring luciferase activity at 48 hpi. In parallel, cells from similar infections were lysed at 7 and 24 hpi, and total DNA was extracted. The DNA samples collected at 7 hpi were used to determine the levels of late reverse transcripts by real-time PCR. (Lower) HIV-1 2-LTR circles, a marker for nuclear import, were quantified by real-time PCR of DNA samples collected at 24 hpi. In addition, integration was measured by Alu-PCR in DNA samples collected at 24 hpi. The levels of late reverse transcripts, 2-LTR circle, and products of Alu-PCR were normalized to actin. Nevirapine was used as a control. Experiments were repeated at least three times, and a representative example is shown. Results were analyzed using two-tailed Student's t test. Differences were considered statistically significant at a P value of <0.05 (*), <0.01 (**), <0.001 (***), or <0.0001 (****) or were nonsignificant (ns).
FIG 4
FIG 4
HIV-1 capsids bearing the N57S change do not bind Nup-153. (A) The ability of Nup153-GFP, Nup153-HA, Nup98-GFP, and RanBP2/Nup358-GFP to bind the indicated in vitro-assembled HIV-1 CA-NC complexes was measured as described in Materials and Methods. INPUT and BOUND fractions were analyzed by Western blotting using anti-GFP, anti-HA, or anti-p24 antibodies. Experiments were repeated at least three times, and a representative experiment is shown. (B) GST protein fused to the Nup153 residues 896 to 1475 containing the FG repeat (GST-NUP-FG) binds to HIV-1 hexameric capsid. (i) Purified GST-NUP-FG proteins were incubated with hexameric capsids bearing the indicated changes. (ii and iii) Subsequently, complexes were pulldown using glutathione beads and analyzed by SDS-PAGE. (C) The ability of Nup153 that does not contain FG repeats [Nup153Δ(896-1475)-GFP] to bind the indicated in vitro-assembled HIV-1 CA-NC complexes was measured as described in Materials and Methods. Similarly, INPUT and BOUND fractions were analyzed by Western blotting using anti-GFP or anti-p24 antibodies. Experiments were repeated at least three times, and a representative experiment is shown. (D) HIV-1-N57S virus infection of Nup-153-depleted cells. Nup153-depleted HeLa cells (Nup153 KD) were challenged with the indicated HIV-1-Luc viruses. (Upper) Infection was determined by measuring luciferase activity 48 h postinfection. (Lower) Depletion of Nup153 was achieved transiently using shRNA, and expression knockdown was confirmed by Western blotting using anti-Nup153 antibodies, as described in Materials and Methods. Results were analyzed using two-tailed Student's t test. Differences were considered statistically significant at a P value of <0.05 (*), <0.01 (**), <0.001 (***), or <0.0001 (****) or were nonsignificant (ns). Experiments were repeated at least three times, and a representative example is shown.
FIG 4
FIG 4
HIV-1 capsids bearing the N57S change do not bind Nup-153. (A) The ability of Nup153-GFP, Nup153-HA, Nup98-GFP, and RanBP2/Nup358-GFP to bind the indicated in vitro-assembled HIV-1 CA-NC complexes was measured as described in Materials and Methods. INPUT and BOUND fractions were analyzed by Western blotting using anti-GFP, anti-HA, or anti-p24 antibodies. Experiments were repeated at least three times, and a representative experiment is shown. (B) GST protein fused to the Nup153 residues 896 to 1475 containing the FG repeat (GST-NUP-FG) binds to HIV-1 hexameric capsid. (i) Purified GST-NUP-FG proteins were incubated with hexameric capsids bearing the indicated changes. (ii and iii) Subsequently, complexes were pulldown using glutathione beads and analyzed by SDS-PAGE. (C) The ability of Nup153 that does not contain FG repeats [Nup153Δ(896-1475)-GFP] to bind the indicated in vitro-assembled HIV-1 CA-NC complexes was measured as described in Materials and Methods. Similarly, INPUT and BOUND fractions were analyzed by Western blotting using anti-GFP or anti-p24 antibodies. Experiments were repeated at least three times, and a representative experiment is shown. (D) HIV-1-N57S virus infection of Nup-153-depleted cells. Nup153-depleted HeLa cells (Nup153 KD) were challenged with the indicated HIV-1-Luc viruses. (Upper) Infection was determined by measuring luciferase activity 48 h postinfection. (Lower) Depletion of Nup153 was achieved transiently using shRNA, and expression knockdown was confirmed by Western blotting using anti-Nup153 antibodies, as described in Materials and Methods. Results were analyzed using two-tailed Student's t test. Differences were considered statistically significant at a P value of <0.05 (*), <0.01 (**), <0.001 (***), or <0.0001 (****) or were nonsignificant (ns). Experiments were repeated at least three times, and a representative example is shown.
FIG 5
FIG 5
HIV-1-N57S viruses do not interact with Nups containing FG repeats. (A) Several Nups that do or do not contain FG repeats are shown. (B) Binding of Nups to HIV-1 capsid. The ability of the indicated Nups to bind in vitro-assembled HIV-1 CA-NC complexes was measured as described in Materials and Methods. INPUT and BOUND fractions were analyzed by Western blotting using anti-GFP or anti-p24 antibodies. As a positive control, we measured the ability of rhesus TRIM5α (TRIM5αrh) to bind in vitro-assembled HIV-1 CA-NC complexes. (C) Binding of Nups to HIV-1 capsids bearing the mutation N57S or N74D. Similarly, the ability of the indicated Nups to bind in vitro-assembled HIV-1 CA-NC bearing the mutation N57S or N74D was measured. INPUT and BOUND fractions were analyzed by Western blotting using anti-GFP or anti-p24 antibodies. As a control, we measured the ability of CPSF6 to bind in vitro-assembled HIV-1 CA-NC complexes bearing the mutation N57S or N74D. Results were analyzed using two-tailed Student's t test. Differences were considered statistically significant at a P value of <0.05 (*), <0.01 (**), <0.001 (***), or <0.0001 (****) or were nonsignificant (ns). (D) HIV-1-N57S virus infection of cells depleted for the expression of different Nups. HeLa cells depleted for the expression of the different Nups were challenged with the indicated HIV-1-Luc viruses. (Upper) Infection was determined by measuring luciferase activity 48 h postinfection. Statistical analysis by one-way analysis of variance was applied (****, P < 0.0001). (Lower) Depletion of the indicated Nup was achieved transiently using shRNA, and expression knockdown was confirmed by Western blotting using the indicated antibodies, as described in Materials and Methods. Experiments were repeated at least three times, and a representative experiment is shown.
FIG 5
FIG 5
HIV-1-N57S viruses do not interact with Nups containing FG repeats. (A) Several Nups that do or do not contain FG repeats are shown. (B) Binding of Nups to HIV-1 capsid. The ability of the indicated Nups to bind in vitro-assembled HIV-1 CA-NC complexes was measured as described in Materials and Methods. INPUT and BOUND fractions were analyzed by Western blotting using anti-GFP or anti-p24 antibodies. As a positive control, we measured the ability of rhesus TRIM5α (TRIM5αrh) to bind in vitro-assembled HIV-1 CA-NC complexes. (C) Binding of Nups to HIV-1 capsids bearing the mutation N57S or N74D. Similarly, the ability of the indicated Nups to bind in vitro-assembled HIV-1 CA-NC bearing the mutation N57S or N74D was measured. INPUT and BOUND fractions were analyzed by Western blotting using anti-GFP or anti-p24 antibodies. As a control, we measured the ability of CPSF6 to bind in vitro-assembled HIV-1 CA-NC complexes bearing the mutation N57S or N74D. Results were analyzed using two-tailed Student's t test. Differences were considered statistically significant at a P value of <0.05 (*), <0.01 (**), <0.001 (***), or <0.0001 (****) or were nonsignificant (ns). (D) HIV-1-N57S virus infection of cells depleted for the expression of different Nups. HeLa cells depleted for the expression of the different Nups were challenged with the indicated HIV-1-Luc viruses. (Upper) Infection was determined by measuring luciferase activity 48 h postinfection. Statistical analysis by one-way analysis of variance was applied (****, P < 0.0001). (Lower) Depletion of the indicated Nup was achieved transiently using shRNA, and expression knockdown was confirmed by Western blotting using the indicated antibodies, as described in Materials and Methods. Experiments were repeated at least three times, and a representative experiment is shown.
FIG 6
FIG 6
Small-molecule inhibitors PF74 and BI-2 prevent the binding of Nups containing FG repeats to the HIV-1 capsid. (A) HIV-1 viruses bearing changes on residue N57 are resistant to the inhibitory effects of PF74 and BI-2. Human HT1080 cells were challenged with the indicated HIV-1-GFP viruses in the presence of increasing concentrations of PF74 or BI-2. Infection was determined by measuring the percentage of GFP-positive cells 48 h postinfection. The percentage of infection relative to that of untreated samples is shown. Similar experiments were performed using human HeLa (B), dog Cf2Th (C), and human Jurkat (D) as target cells. (E) Binding of Nups to HIV-1 capsid is inhibited by PF74 and BI-2. The ability of the indicated Nups to bind in vitro-assembled HIV-1 CA-NC complexes in the presence of PF74 or BI-2 was measured as described in Materials and Methods. As a specificity control, we tested the ability of TRIMCyp to bind in vitro-assembled HIV-1 CA-NC complexes in the presence of PF74, BI-2, or cyclosporine (CsA). INPUT and BOUND fractions were analyzed by Western blotting using anti-GFP, anti-FLAG, or anti-p24 antibodies. As a positive control, we measured the ability of CPSF6 to bind in vitro-assembled HIV-1 CA-NC complexes in the presence of PF74 or BI-2. Results were analyzed using two-tailed Student's t test. Differences were considered statistically significant at a P value of <0.05 (*), <0.01 (**), <0.001 (***), or <0.0001 (****) or were nonsignificant (ns).
FIG 6
FIG 6
Small-molecule inhibitors PF74 and BI-2 prevent the binding of Nups containing FG repeats to the HIV-1 capsid. (A) HIV-1 viruses bearing changes on residue N57 are resistant to the inhibitory effects of PF74 and BI-2. Human HT1080 cells were challenged with the indicated HIV-1-GFP viruses in the presence of increasing concentrations of PF74 or BI-2. Infection was determined by measuring the percentage of GFP-positive cells 48 h postinfection. The percentage of infection relative to that of untreated samples is shown. Similar experiments were performed using human HeLa (B), dog Cf2Th (C), and human Jurkat (D) as target cells. (E) Binding of Nups to HIV-1 capsid is inhibited by PF74 and BI-2. The ability of the indicated Nups to bind in vitro-assembled HIV-1 CA-NC complexes in the presence of PF74 or BI-2 was measured as described in Materials and Methods. As a specificity control, we tested the ability of TRIMCyp to bind in vitro-assembled HIV-1 CA-NC complexes in the presence of PF74, BI-2, or cyclosporine (CsA). INPUT and BOUND fractions were analyzed by Western blotting using anti-GFP, anti-FLAG, or anti-p24 antibodies. As a positive control, we measured the ability of CPSF6 to bind in vitro-assembled HIV-1 CA-NC complexes in the presence of PF74 or BI-2. Results were analyzed using two-tailed Student's t test. Differences were considered statistically significant at a P value of <0.05 (*), <0.01 (**), <0.001 (***), or <0.0001 (****) or were nonsignificant (ns).
FIG 7
FIG 7
HIV-1 infection and integration site distribution. Shown is integration site distribution for wild-type and N57S and N74D HIV capsid mutant viruses: intergenic, intragenic, gene density, and alpha satellite. (A) Jurkat cells were challenged with the indicated HIV-1-Luc viruses. (Left) Infectivity was determined by measuring luciferase reporter activity at 48 hpi. (Middle) Late reverse transcription (LRT) was measured by quantitative PCR at 7 hpi as described in Materials and Methods. (Right) The number of proviruses integrated to the genome per cell (proviruses/cell) was determined using Alu-PCR. Asterisks indicate statistical significance in comparisons of one virus to another virus (determined by paired two-tailed Student's t tests; ns, nonsignificant; *, P < 0.05; ****, P < 0.0001). (B, left) Histograms representing the average gene density. (Middle) Percentage of integrations having an α-satellite region within an interval of 50 kb. (Right) Percentage of integrations classified as inter- or intragenic; intragenic integrations are those localized within 50 kb of a gene. (C, left) Percentage of integrations having a TSS within a 2.5-kb window. (Middle) Histogram recapitulating the percentage of integration sites at a distance of ≥100 kb from the TSS. (Right) Plots of the percentage of integrations grouped by distance from TSS in a 100-kb window; the matched random control (MRC) is represented in gray. (D, left) Percentage of integrations falling within a 50-kb window from any CpG island. (Right) Plot representing the percentage of integrations grouped by their distance from any CpG in a 0- to 50-kb range.
FIG 8
FIG 8
Analysis of nucleosome density around viral integration sites and the relationship between integration frequency and epigenetic mark density. (A) The plot shows the mean normalized coverage in 100-kb windows around the viral integration sites of each virus (WT, N57S, and N74D), as well as of matched random controls (MRC) for nucleosome density feature (data available for K562 cells in the UCSC database). (B) The plots show the mean normalized coverage for different histone modifications (derived from ChIP-seq data) in 100-kb windows around the viral integration sites of each virus (WT, N57S, and N74D) as well as of matched random controls (MRC). The plots show curve coverage signal for H3K4me1, H3K4me3, H3K36me3, and H4K20me1. Coverage was normalized to the number of tags.

References

    1. Rubin H, Temin HM. 1959. A radiological study of cell-virus interaction in the Rous sarcoma. Virology 7:75–91. doi:10.1016/0042-6822(59)90178-3. - DOI - PubMed
    1. Lewis PF, Emerman M. 1994. Passage through mitosis is required for oncoretroviruses but not for the human immunodeficiency virus. J Virol 68:510–516. - PMC - PubMed
    1. Roe T, Reynolds TC, Yu G, Brown PO. 1993. Integration of murine leukemia virus DNA depends on mitosis. EMBO J 12:2099–2108. - PMC - PubMed
    1. Lewis P, Hensel M, Emerman M. 1992. Human immunodeficiency virus infection of cells arrested in the cell cycle. EMBO J 11:3053–3058. - PMC - PubMed
    1. Miller MD, Farnet CM, Bushman FD. 1997. Human immunodeficiency virus type 1 preintegration complexes: studies of organization and composition. J Virol 71:5382–5390. - PMC - PubMed

Publication types

MeSH terms

Substances