. 2018 Sep 6;132(10):1050-1063.
doi: 10.1182/blood-2018-03-836601. Epub 2018 Jul 11.

Therapeutic vulnerability of multiple myeloma to MIR17PTi, a first-in-class inhibitor of pri-miR-17-92

Affiliations

Therapeutic vulnerability of multiple myeloma to MIR17PTi, a first-in-class inhibitor of pri-miR-17-92

Eugenio Morelli et al. Blood. .

Abstract

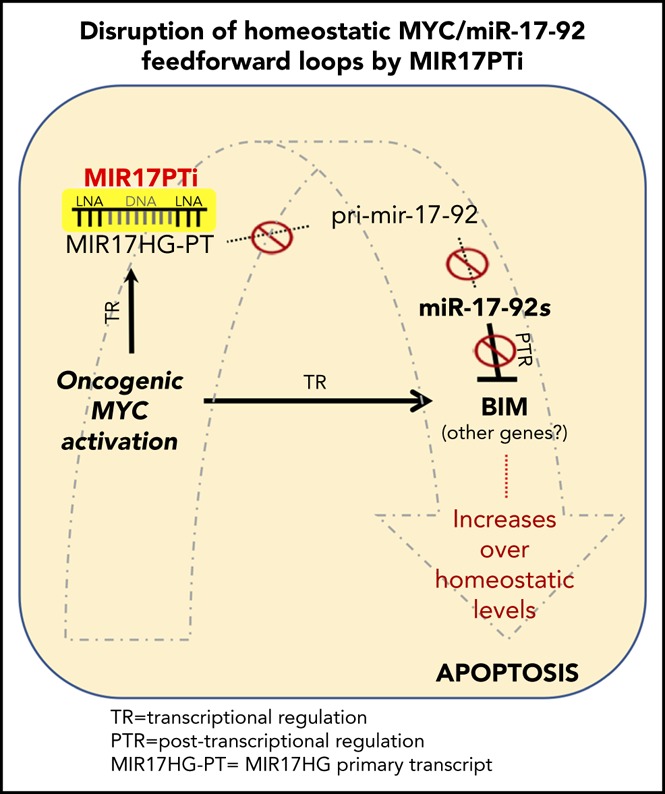
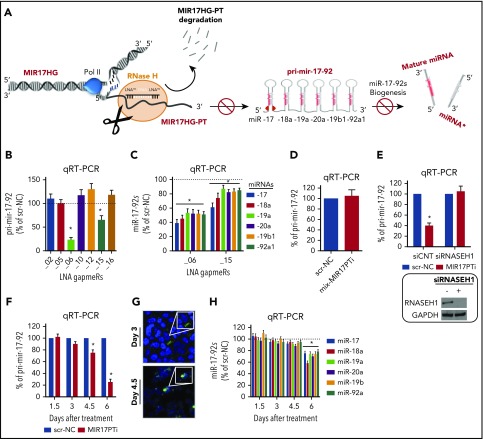
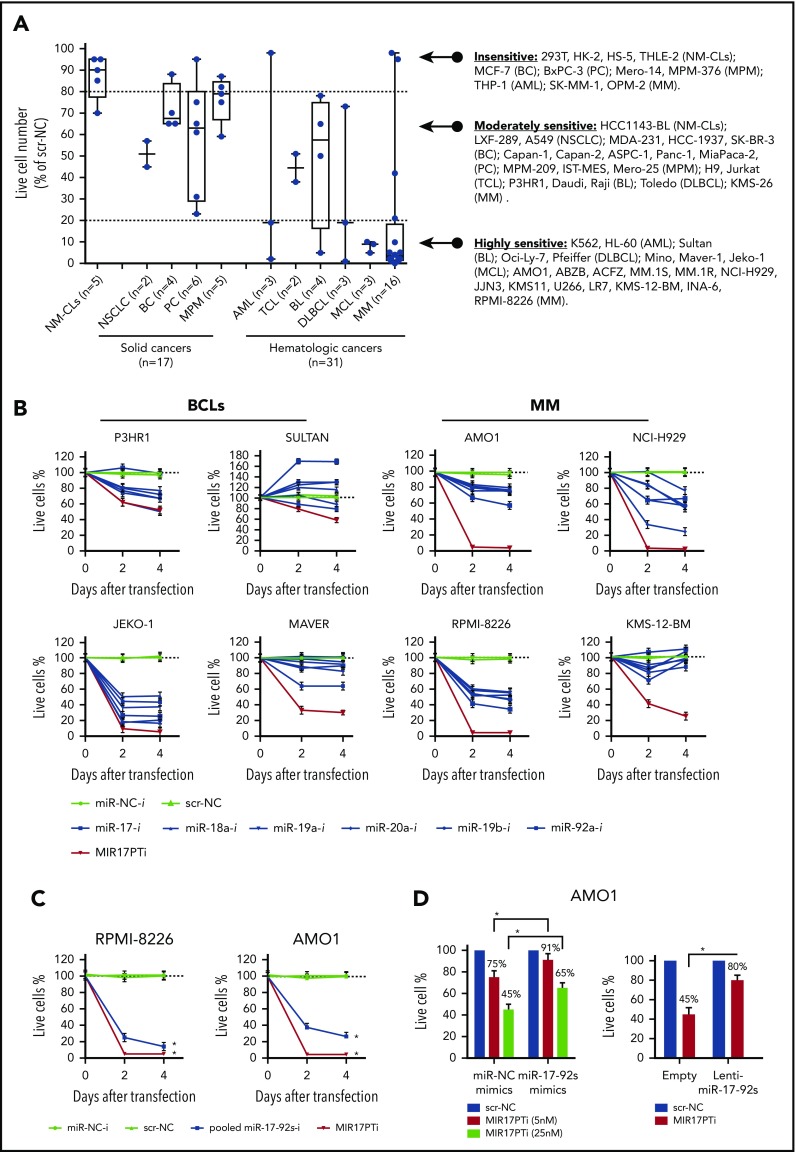
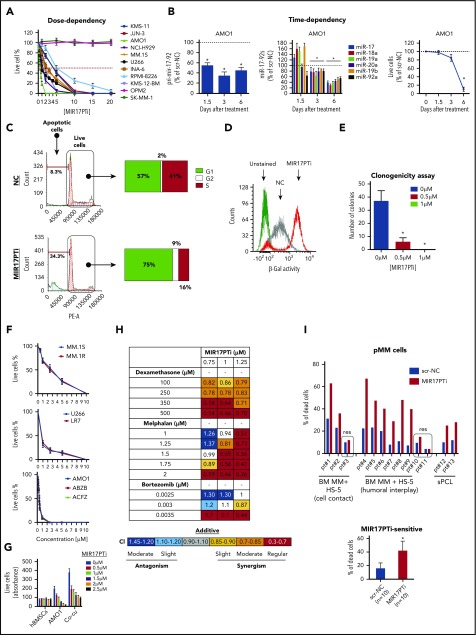
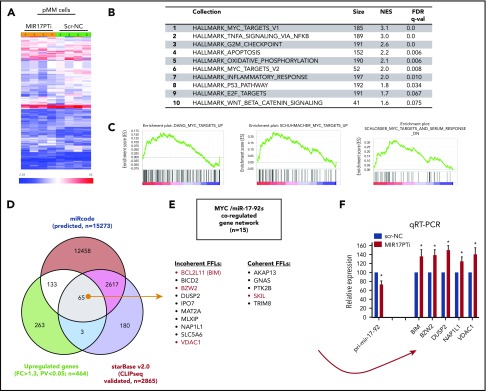
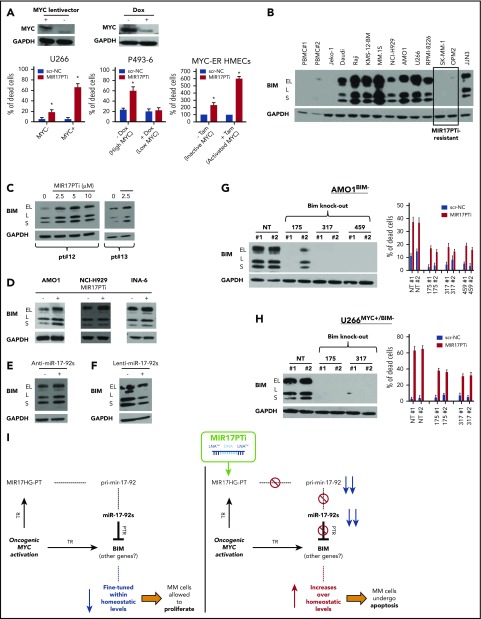
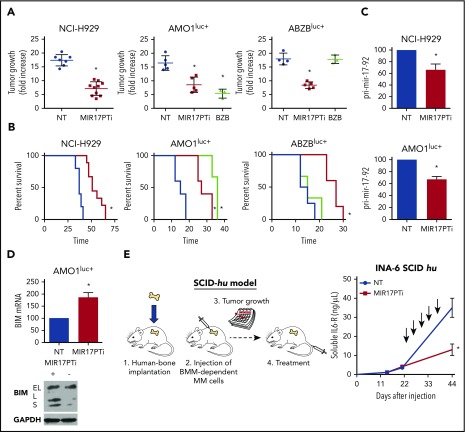
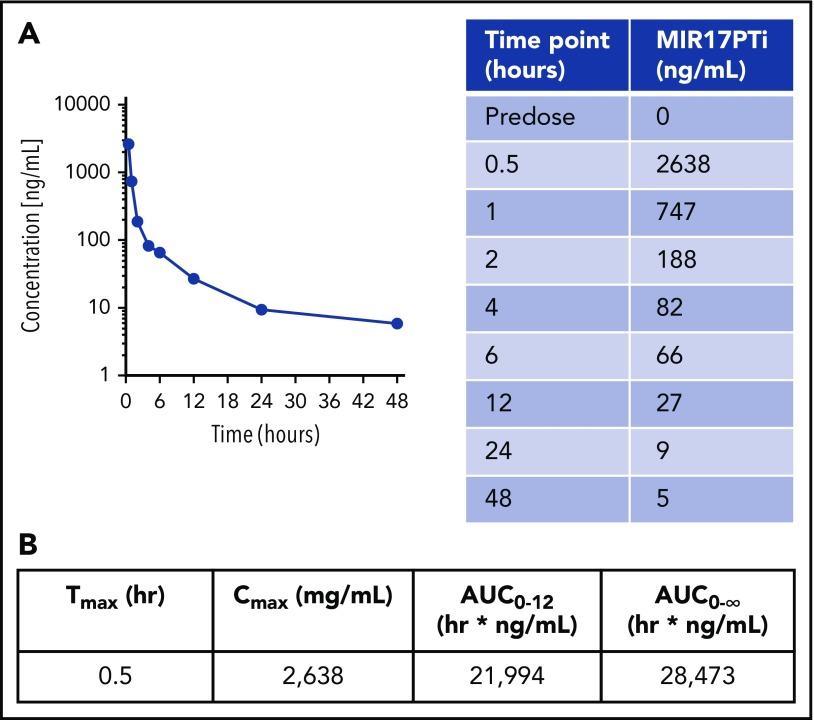
The microRNA (miRNA) cluster miR-17-92 is oncogenic and represents a valuable therapeutic target in c-MYC (MYC)-driven malignancies. Here, we developed novel LNA gapmeR antisense oligonucleotides (ASOs) to induce ribonuclease H-mediated degradation of MIR17HG primary transcripts and consequently prevent biogenesis of miR-17-92 miRNAs (miR-17-92s). The leading LNA ASO, MIR17PTi, impaired proliferation of several cancer cell lines (n = 48) established from both solid and hematologic tumors by on-target antisense activity, more effectively as compared with miR-17-92 inhibitors. By focusing on multiple myeloma (MM), we found that MIR17PTi triggers apoptosis via impairment of homeostatic MYC/miR-17-92 feed-forward loops (FFLs) in patient-derived MM cells and induces MYC-dependent synthetic lethality. We show that alteration of a BIM-centered FFL is instrumental for MIR17PTi to induce cytotoxicity in MM cells. MIR17PTi exerts strong in vivo antitumor activity in nonobese diabetic severe combined immunodeficient mice bearing clinically relevant models of MM, with advantageous safety and pharmacokinetic profiles in nonhuman primates. Altogether, MIR17PTi is a novel pharmacological tool to be tested in early-phase clinical trials against MM and other MYC-driven malignancies.


Conflict of interest statement

Conflict-of-interest disclosure: N.M.F. is an employee of Exiqon. The remaining authors declare no competing financial interests.

Figures

None
Graphical abstract
Figure 1.
Figure 1.
Development of MIR17PTi. (A) Illustration summarizing the activity of LNA gapmeRs with regard to the miR-17-92 cluster. (B) qRT-PCR analysis of pri-mir-17-92 expression in 293T 2 days after transfection with miR-17-92 LNA gapmeRs or scr-NC (25 nM). (C) qRT-PCR analysis of miR-17-92s in 293T 2 days after transfection with mir-17-92 LNA gapmeRs or scr-NC (25 nM). (D) qRT-PCR analysis of pri-mir-17-92 expression in 293T 2 days after transfection with mix-MIR17PTi or scr-NC (25 nM). (E) qRT-PCR analysis of pri-mir-17-92 (left) and western blotting of RNase H1 (right) in 293T cotransfected with either small interfering RNAs (siRNAs) targeting RNase H1 (siRNASE H1; 25 nM) or scrambled siRNAs (siCNT; 25 nM) and MIR17PTi or scr-NC (25 nM; 3-day time point). GAPDH was used as protein loading control. (F) qRT-PCR analysis of pri-mir-17-92 in 293T during a time-course exposure (days 1.5, 3, 4.5, and 6, every 36 hours) to MIR17PTi or scr-NC (10 µM). (G) Confocal microscopy analysis of 293T after 3 or 4.5 days of exposure to FAM-labeled MIR17PTi (10 µM). Cell nuclei are evidenced by 4′,6-diamidino-2-phenylindole staining (original magnification ×40). (H) qRT-PCR analysis of miR-17-92s in 293T during a time-course exposure (days 1.5, 3, 4.5, and 6, every 36 hours) to MIR17PTi or scr-NC (10 µM). The qRT-PCR results are average expression levels after normalization with GAPDH (for pri-mir-17-92) or RNU44 (for miR-17-92s) and ΔΔCt calculations. Data from 1 of 3 independent experiments are shown in each panel. *P < .05.
Figure 2.
Figure 2.
In vitro anticancer activity of MIR17PTi. (A) CCK-8 assay of CCLs (n = 48) and nonmalignant cell lines (NM-CLs; n = 5) exposed for 6 days to MIR17PTi or scr-NC (10 µM). Data are represented as percentage of MIR17PTi-treated live cells (absorbance), as compared with scr-NC. Dashed lines indicate 20% (upper line) and 80% (bottom line) growth inhibition. (B) CCK-8 proliferation assay of 8 CCLs (P3HR1 [diffuse large B cell lymphoma (DLBCL)], SULTAN [Burkitt lymphoma (BL)], JeKo-1, Maver [mantle cell lymphoma (MCL)], AMO1, KMS-12-BM, NCI-H929, RPMI-8226 [MM]) transfected with indicated miRNA inhibitors or MIR17PTi (25 nM). Data are represented as compared (percentage) with live cells after scr-NC transfection. (C) CCK-8 proliferation assay of RPMI-8226 and AMO1 after transfection with miR-NC-inhibitors (150 nM) or pooled miR-17-92 inhibitors (25 nM each) or scr-NC (25 nM) or MIR17PTi (25 nM). Data are represented as compared (percentage) with live cells after mock (RNase-free water) transfection. (D) CCK-8 proliferation assay of: AMO1 2 days after cotransfection with scr-NC (5 or 25 nM; showed as single point because no difference was detected in percentage of live cells) or MIR17PTi (5 or 25 nM) and miR-NC-mimics (60 nM) or pooled miR-17-92 mimics (10 nM each) (left) and AMO1 transduced with an empty lentiviral vector or an miR-17-92 lentiviral vector and then exposed for 6 days to scr-NC or MIR17PTi (0.5 µM) (right). Data from 1 of 3 independent experiments are shown in each panel. *P < .05. AML, acute myeloid leukemia; BC, breast cancer; MPM, malignant pleural mesothelioma; PC, pancreatic cancer; TCL, T-cell leukemia.
Figure 3.
Figure 3.
In vitro activity of MIR17PTi in HMCLs and primary MM (pMM) cells. (A) Dose-dependent activity of MIR17PTi (6-day time point) in HMCLs (n = 10) as assessed by CCK-8 proliferation assay. Live cells are represented as compared (percentage) with untreated controls. (B) Time-dependent activity of MIR17PTi (1 µM) in AMO1, as assessed by qRT-PCR analysis of pri-mir-17-92 (left) and miR-17-92s (middle). The results shown are average pri-mir-17-92 or miRNA expression levels after normalization with glyceraldehyde-3-phosphate dehydrogenase or RNU44 and ΔΔCt calculation (expressed as percentage). Time-dependent activity of MIR17PTi (1 µM) in AMO1, as assessed by CCK-8 assay (right pane). (C) Cell-cycle analysis of AMO1 exposed for 6 days to MIR17PTi (1 µM) or sc-NC (1 µM). (D) Flow cytometric analysis of senescent AMO1 cells (β-galactosidase positive) exposed for 6 days to MIR17PTi (1 µM) o scr-NC (1 µM). (E) Methylcellulose clonogenic assay of AMO1 exposed to MIR17PTi (1 µM) o scr-NC (1 µM; 2-week time point). (F) CCK-8 proliferation assay of HMCLs sensitive (MM.1S, U266, AMO1) or resistant (MM.1R, LR7, ABZB, ACFZ) to conventional anti-MM agents (dexamethasone, melphalan, bortezomib, carfilzomib) exposed to different concentrations of MIR17PTi for 6 days. (G) CCK-8 assay of human bone marrow (BM) stromal cells (hBMSCs), AMO1, or AMO1 cocultured with hBMSCs after 6 days of exposure to indicated concentrations of MIR17PTi. (H) Table showing combination indexes resulting from combinatorial treatments of AMO1 with MIR17PTi and dexamethasone or melphalan or bortezomib (6-day time point). (I) Flow cytometric analysis of 7-AAD–stained pMM cells (n = 13) exposed for 8 days to MIR17PTi or scr-NC (2.5 µM). pMM cells were cultured adherent to GFP+ HS-5 stromal cells (patients 1-3; patients with intramedullary disease) or physically separated from HS-5 by membranes (patients 4-11; patients with intramedullary disease) or alone (patients 12-13; patients with extramedullary disease at relapse [secondary plasma-cell leukemia (sPCL)]). Lower panel (within the frame) shows median activity of MIR17PTi in sensitive pMM cells (n = 10) from the left panel. *P < .05.
Figure 4.
Figure 4.
Molecular perturbation induced by MIR17PTi in pMM cells. (A) Hierarchical clustering of pMM cells (n = 4; patients 5, 6, 7, and 9) exposed for 6 days to MIR17PTi (2.5 µM) or equimolar scr-NC. (B) Table of gene sets from the Hallmark collection enriched with genes upregulated by MIR17PTi (positive phenotype) in sensitive pMM cells (patients 5, 6, 7, and 9). Number of genes in each set (size), the normalized enrichment score (NES), and test of statistical significance (false discovery rate [FDR] q value) are highlighted. (C) Enrichment plots of 3 representative transcriptional signatures of MYC-upregulated target genes in the positive phenotype of sensitive pMM cells exposed to MIR17PTi (2.5 µM) for 6 days. (D) Venn diagram–intersecting genes upregulated by MIR17PTi with genes predicted to be miR-17-92 targets (by miRcode) and genes validated as miR-17-92 interactors in CLIP sequencing experiments (starBase v2.0). (E) Representation of MYC/miR-17-92 FFLs. In red are reported genes with a fold change (FC) increase >1.5. (F) qRT-PCR analysis of pri-mir-17-92 and BIM, BZW2, DUSP2, NAP1L1, or VDAC1 messenger RNAs (mRNAs) in pMM cells (n = 3) exposed to MIR17PTi (2.5 µM) for 6 days. The results shown are average pri-mir-17-92 or mRNA expression levels after normalization with glyceraldehyde-3-phosphate dehydrogenase and ΔΔCt calculations. *P < .05.
Figure 5.
Figure 5.
Molecular mechanism underlying MIR17PTi proapoptotic activity. (A) 7-AAD flow cytometric assay of U266MYC−/U266MYC+ after 6 days of treatment with MIR17PTi (2.5 µM) or scr-NC (2.5 µM); western blotting of MYC protein in U266MYC− and U266MYC+ is reported. Glyceraldehyde-3-phosphate dehydrogenase (GAPDH) was used as protein loading control (left). 7-AAD flow cytometric assay of P493-6 after 6 days of treatment with MIR17PTi (2.5 µM) or scr-NC (2.5 µM), in presence or absence of doxycycline (dox); western blotting of MYC protein in P493-6 cultured for 2 days with or without doxycycline is reported. GAPDH was used as protein loading control (middle). Trypan blue exclusion staining in MYC-ER human mammary epithelial cells (HMECs) 2 days after transfection with MIR17PTi (50 nM) or scr-NC (50 nM) and cultured with or without tamoxifen (tam) (right). (B) Western blotting of BIM in lysates from healthy donor peripheral blood mononuclear cells (PBMCs; n = 2), Jeko-1 (mantle cell lymphoma; BIM null), Daudi, Raji (Burkitt lymphoma), and indicated HMCLs. GAPDH was used as protein loading control. (C) Western blot analysis of BIM in lysates from pMM cells (patients 12 and 13; extramedullary MM) exposed to MIR17PTi for 6 days at indicated concentrations. GAPDH was used as protein loading control. (D) Western blotting of BIM in AMO1, NCI-H929, or INA-6 exposed for 6 days to MIR17PTi (AMO1, 1 µM; NCI-H929 and INA-6, 2.5 µM) or equimolar scr-NC. GAPDH was used as protein loading control. (E) Western blot analysis of BIM in lysates from AMO1 transfected with miR-NC inhibitor (150 nM) or pooled miR-17-92 inhibitors (25 nM each; 2-day time point). GAPDH was used as protein loading control. (F) Western blot analysis of BIM in lysates from AMO1 transduced with an empty lentiviral vector or an miR-17-92 lentiviral vector. GAPDH was used as protein loading control. (G) Western blot analysis of BIM (upper panel) and flow cytometric analysis of 7-AAD–stained cells (lower panel) in CRISPR/CAS9 genome-edited AMO1BIM− cells. GAPDH was used as protein loading control. Flow cytometry was performed after 6 days of exposure to MIR17PTi (1 µM) or scr-NC (1 µM). (H) Western blot analysis of BIM (upper panel) and flow cytometric analysis of 7-AAD–stained cells (lower panel) in CRISPR/CAS9 genome-edited U266MYC+/BIM− cells. GAPDH was used as protein loading control. Flow cytometry was performed after 6 days of exposure to MIR17PTi (2.5 µM) or scr-NC (2.5 µM). (I) Proposed model of MYC/miR-17-92 FFLs and MIR17PTi mechanism of action in MM cells. Data from 1 of 3 independent experiments are shown in each panel. *P < .05. NT, not targeting; PTR, posttranscriptional regulation; TR, transcriptional regulation.
Figure 6.
Figure 6.
In vivo anti-MM activity of MIR17PTi. (A) In vivo growth inhibition of NCI-H929, AMO1luc+, or ABZBluc+ subcutaneous xenografts by MIR17PTi (2 mg/kg). Treatments were performed on days 1, 4, 8, 15, and 22 (NCI-H929) or 1, 4, 8, and 11 (AMO1luc+ and ABZBluc+). Mice were also treated with bortezomib (BZB) as positive control (1 mg/kg on days 1, 4, 8, and 11). Numbers of xenografted mice: NCI-H929, n = 17 (no treatment [NT], n = 7; MIR17PTi, n =10); AMO1luc+, n = 13 (NT, n = 5; MIR17PTi, n = 5; BZB, n = 3); ABZBluc+, n = 12 (NT, n = 4; MIR17PTi, n = 5; BZB, n = 3). Treatments were performed systemically (IV). Tumor volumes at day 33 (NCI-H929) or day 12 (AMO1luc+ and ABZBluc+) after the first treatment are reported. Supporting images and BLI measurements are shown in supplemental Figure 14. (B) Survival curves (Kaplan-Meier) relative to mice reported in panel A (log-rank test P < .05). Survival was evaluated from the first day of treatment until death or euthanasia. Percentage of mice alive is shown. (C) qRT-PCR analysis of pri-mir-17-92 in retrieved NCI-H929 (n = 3) or AMO1luc+ (n = 1) subcutaneous xenografts 2 days after the last dose of the treatment period with MIR17PTi (on days 1, 4, 8, and 11), as compared with tumor retrieved from untreated animals (NCI-H929, n = 1; AMOluc+, n = 1). Animals used for this analysis were not considered for tumor growth and survival evaluations. The results shown are average pri-mir-17-92 expression levels after normalization with glyceraldehyde-3-phosphate dehydrogenase (GAPDH) and ΔΔCt calculations. (D) qRT-PCR analysis (left) and western blotting (right) of BIM in retrieved tumors (AMO1) from MIR17PTi-treated (n = 1) or -untreated (n = 1) mice. The qRT-PCR results shown are average BIM expression levels after normalization with GAPDH and ΔΔCt calculations. GAPDH was used as protein loading control. (E) Schematic representation of SCID-hu model (left) and INA-6 growth within human fetal bone chips subcutaneously implanted in NOD SCID mice (right). Plasmatic levels of soluble interleukin-6 receptor (IL-6R) were used to evaluate tumor growth. Systemic treatments with MIR17PTi (2 mg/kg; days 1, 4, 8, 15, and 22) started at day 22. Effects of MIR17PTi were evaluated at the end of treatment (day 44). A total of 8 mice were treated as follows: NT (n = 4), MIR17PTi (n = 4). *P < .05. BMM, BM microenvironment.
Figure 7.
Figure 7.
PK profile of MIR17PTi in Cynomolgus monkeys. (A) Plasmatic PK profile of MIR17PTi after injection of a Cynomolgus monkey with a single dose (0.504 mg/kg) (left). Sampling was performed at the time points indicated in the table (right). (B) Plasmatic PK parameters of MIR17PTi in Cynomolgus monkeys. AUC, area under the concentration-time curve.

Comment in

References

    1. Concepcion CP, Bonetti C, Ventura A. The microRNA-17-92 family of microRNA clusters in development and disease. Cancer J. 2012;18(3):262-267. - PMC - PubMed
    1. Mogilyansky E, Rigoutsos I. The miR-17/92 cluster: a comprehensive update on its genomics, genetics, functions and increasingly important and numerous roles in health and disease. Cell Death Differ. 2013;20(12):1603-1614. - PMC - PubMed
    1. He L, Thomson JM, Hemann MT, et al. . A microRNA polycistron as a potential human oncogene. Nature. 2005;435(7043):828-833. - PMC - PubMed
    1. Chesi M, Robbiani DF, Sebag M, et al. . AID-dependent activation of a MYC transgene induces multiple myeloma in a conditional mouse model of post-germinal center malignancies. Cancer Cell. 2008;13(2):167-180. - PMC - PubMed
    1. Ott G, Rosenwald A, Campo E. Understanding MYC-driven aggressive B-cell lymphomas: pathogenesis and classification. Blood. 2013;122(24):3884-3891. - PubMed

Publication types

MeSH terms