. 2018 Aug;30(8):1824-1847.
doi: 10.1105/tpc.18.00361. Epub 2018 Jul 11.

Interorganelle Communication: Peroxisomal MALATE DEHYDROGENASE2 Connects Lipid Catabolism to Photosynthesis through Redox Coupling in Chlamydomonas

Affiliations

Interorganelle Communication: Peroxisomal MALATE DEHYDROGENASE2 Connects Lipid Catabolism to Photosynthesis through Redox Coupling in Chlamydomonas

Fantao Kong et al. Plant Cell. 2018 Aug.

Abstract

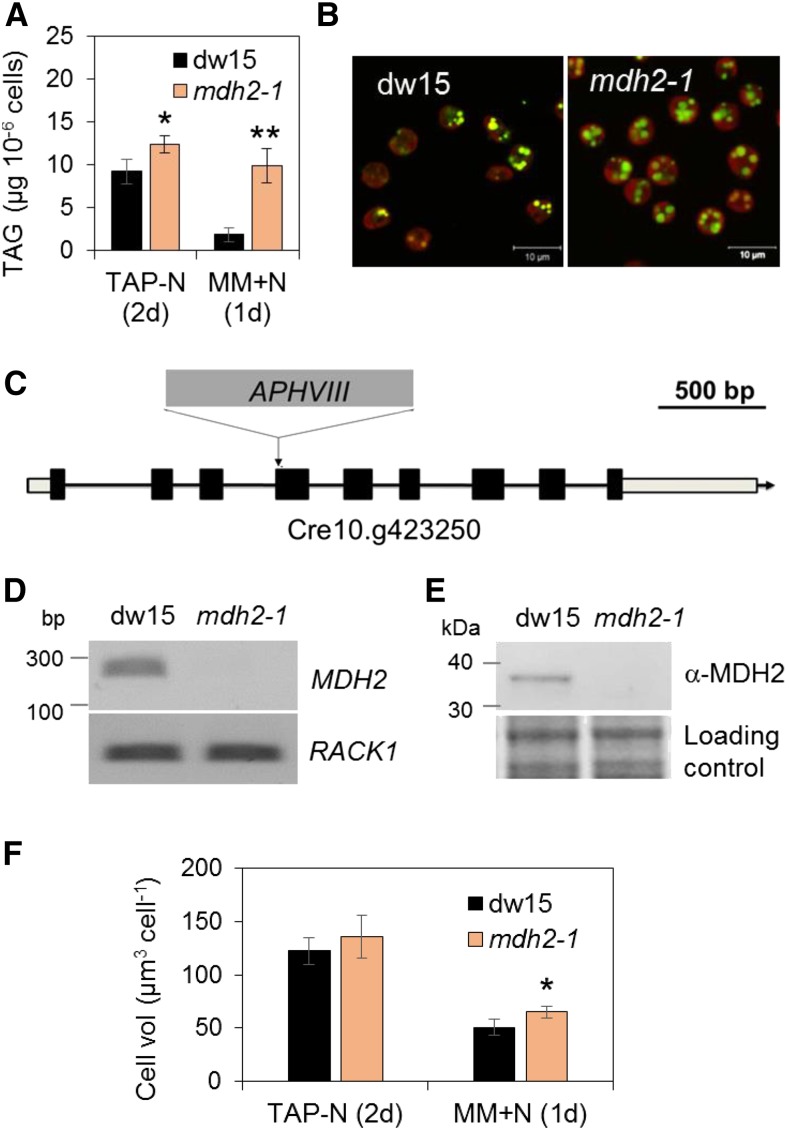
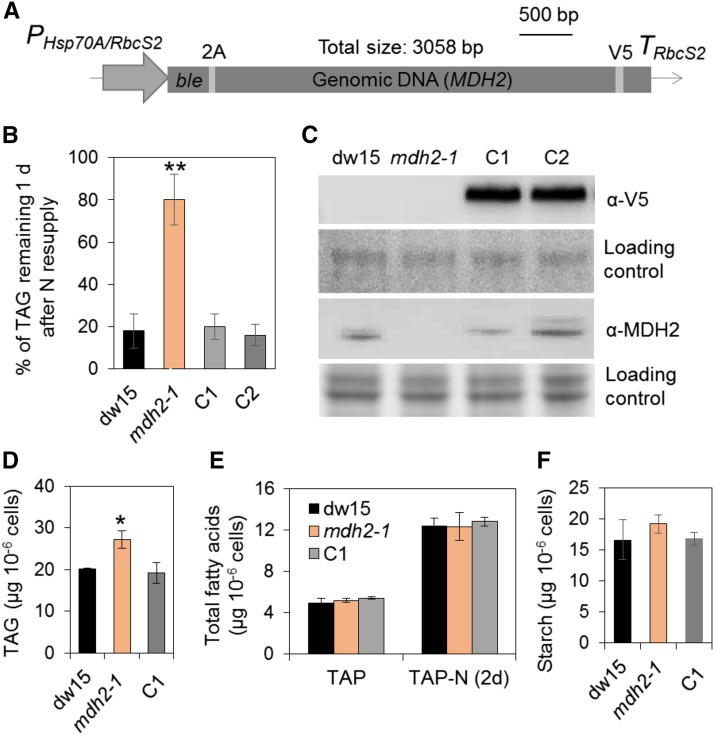
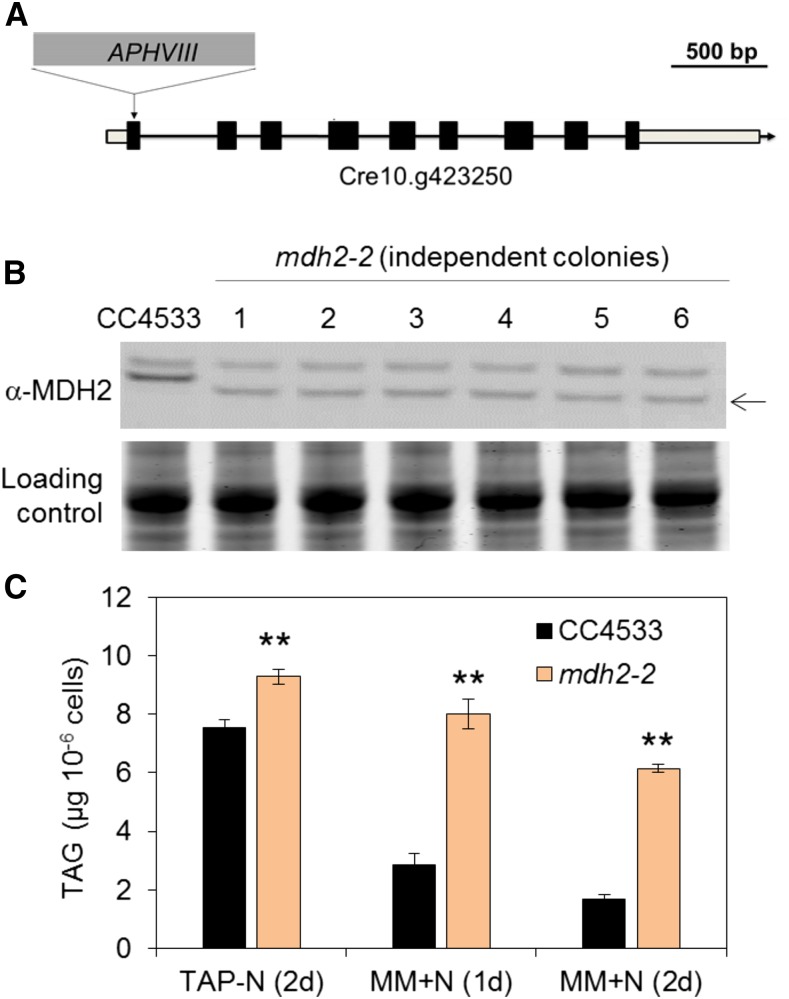
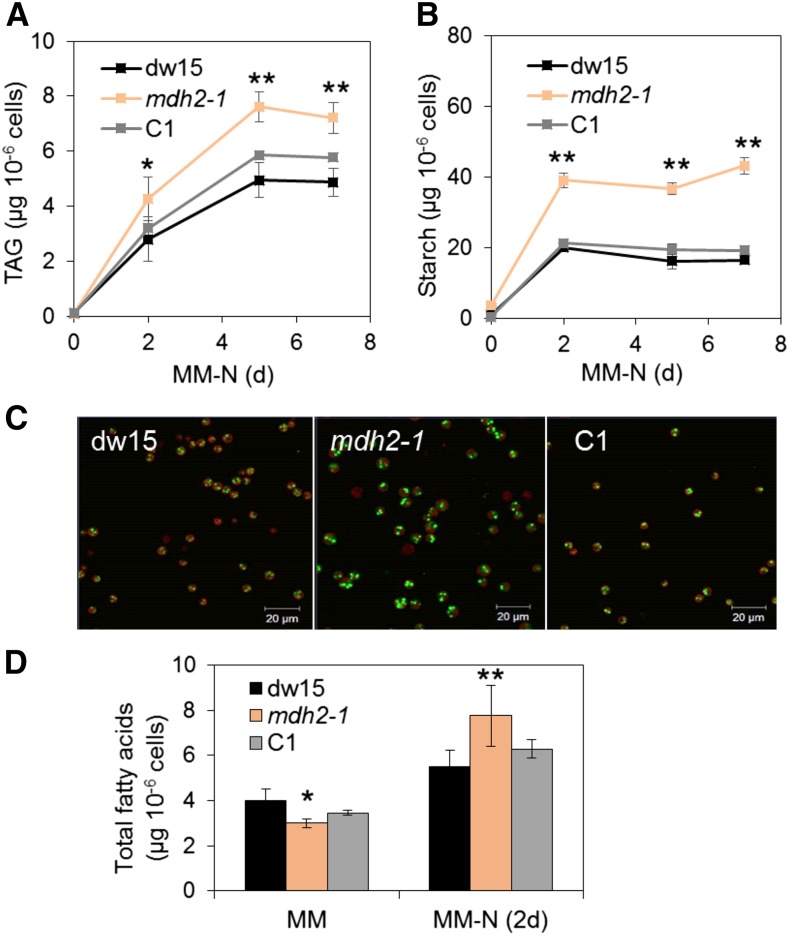
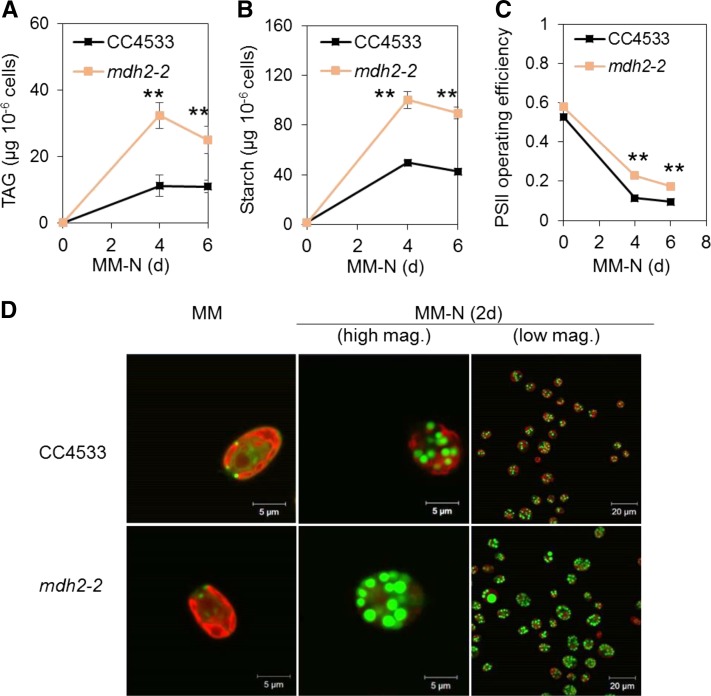
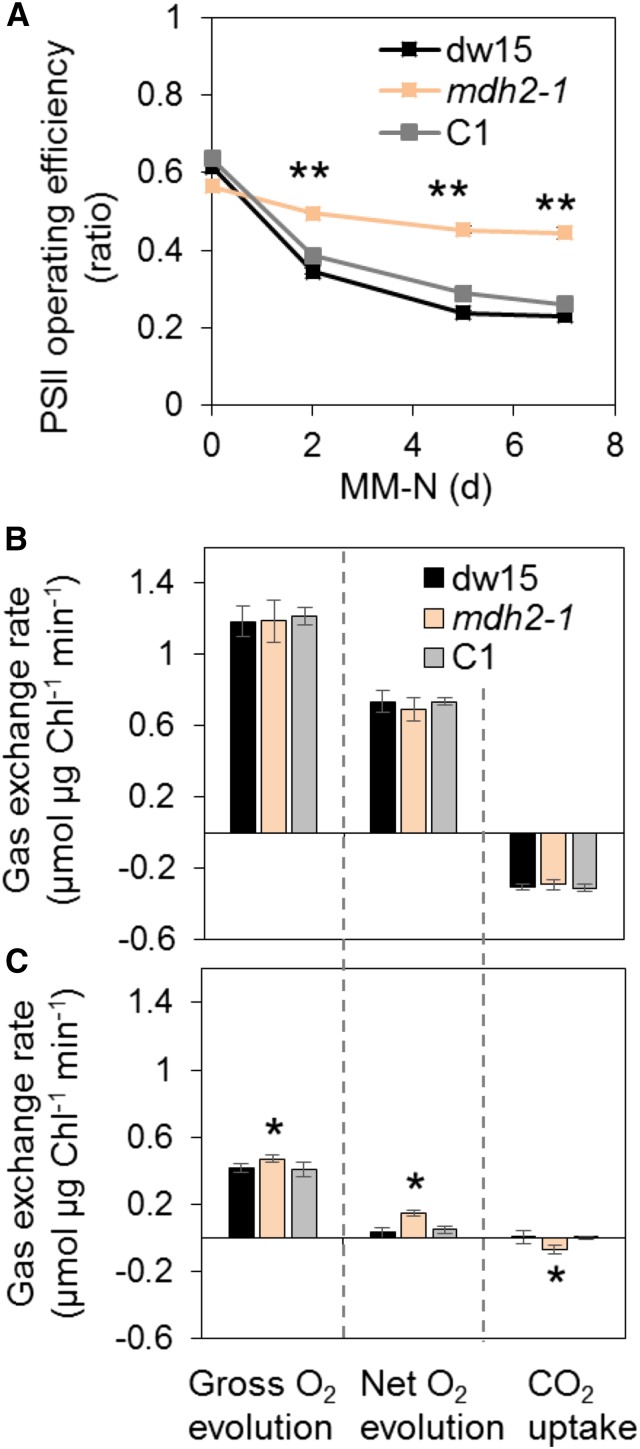
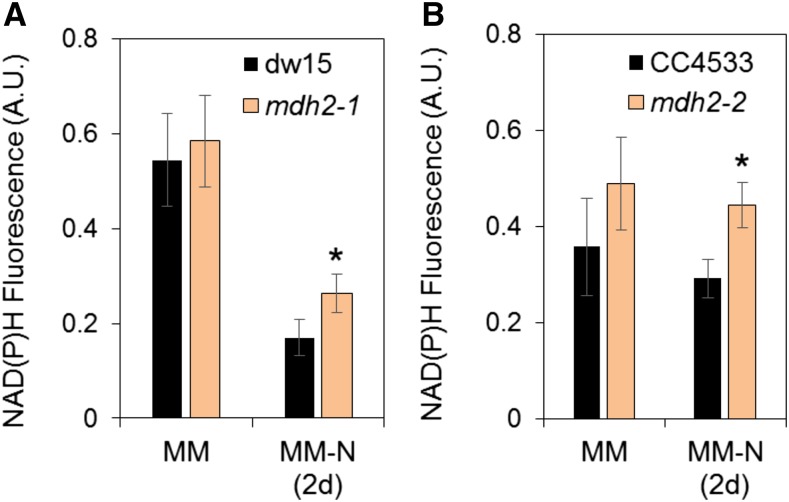
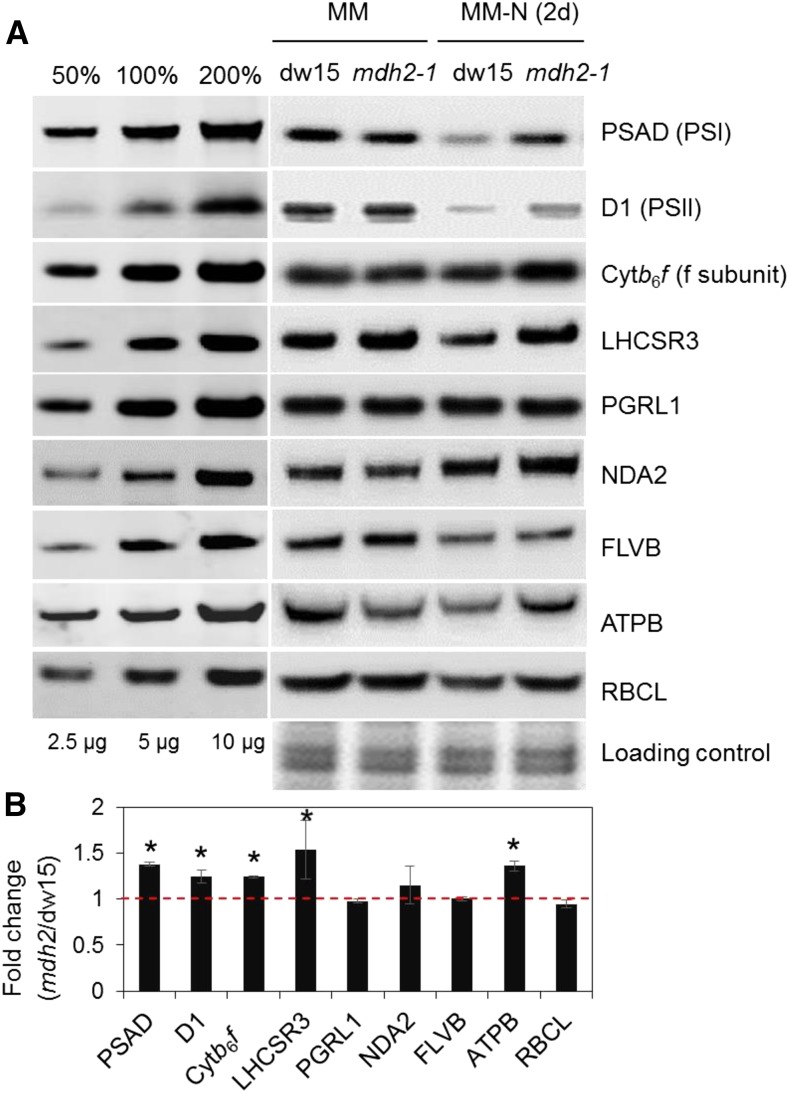
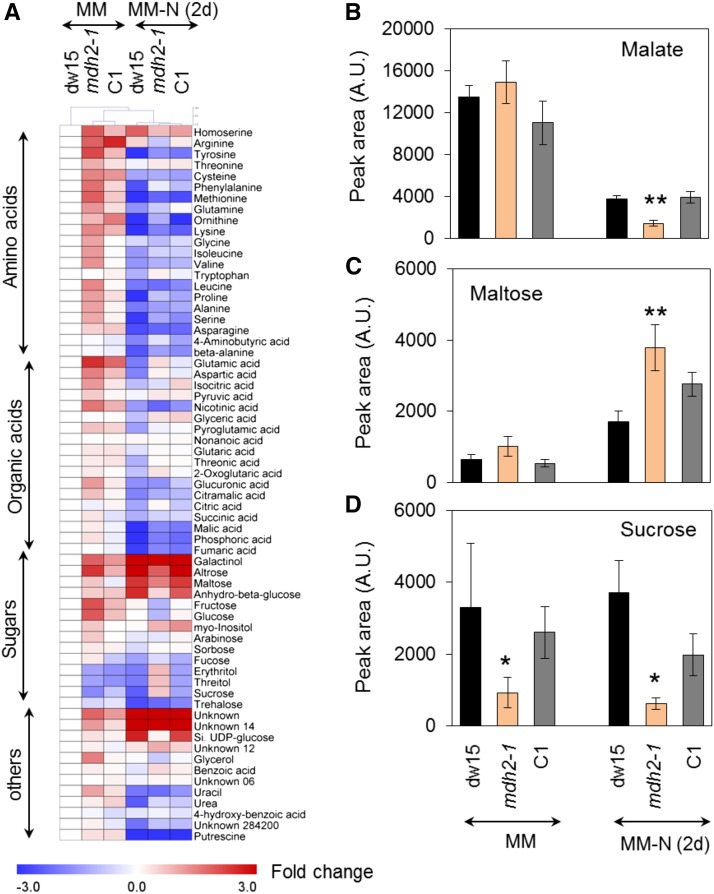
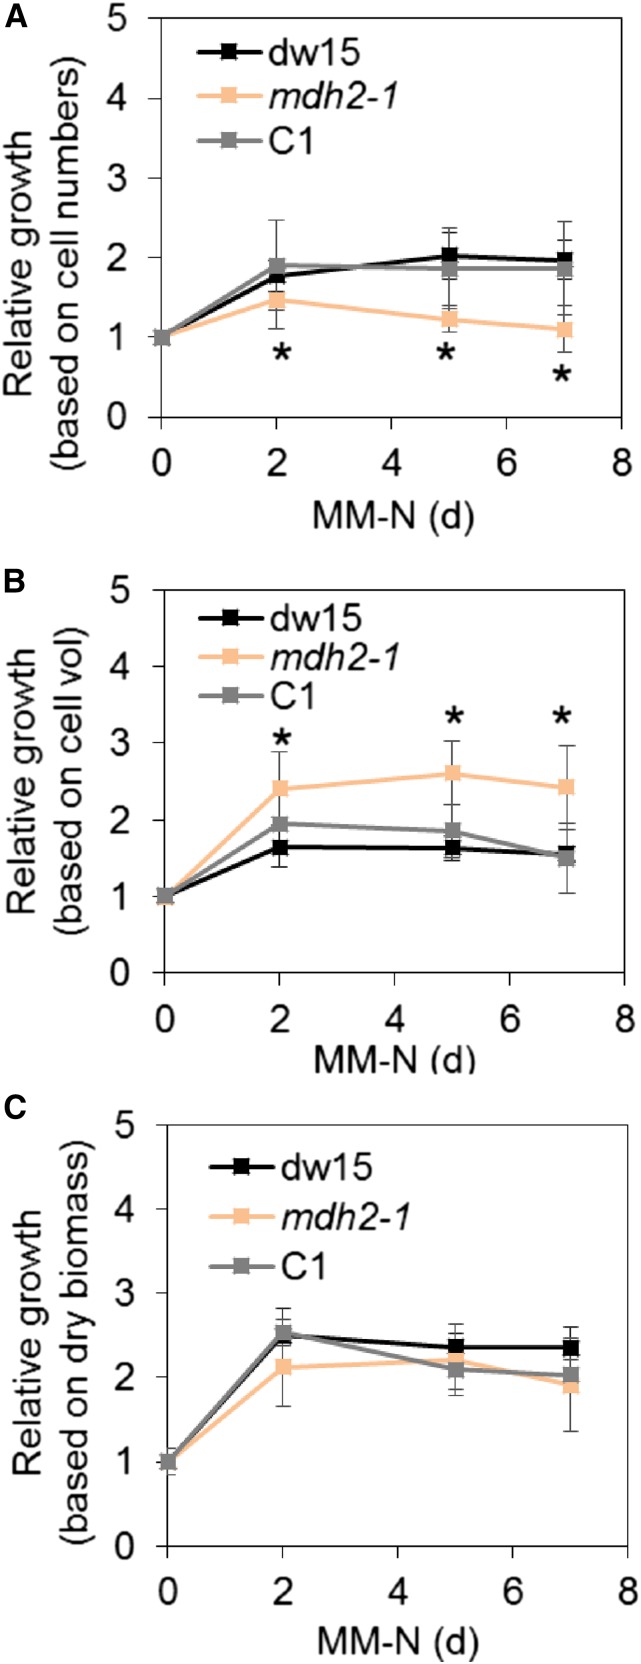
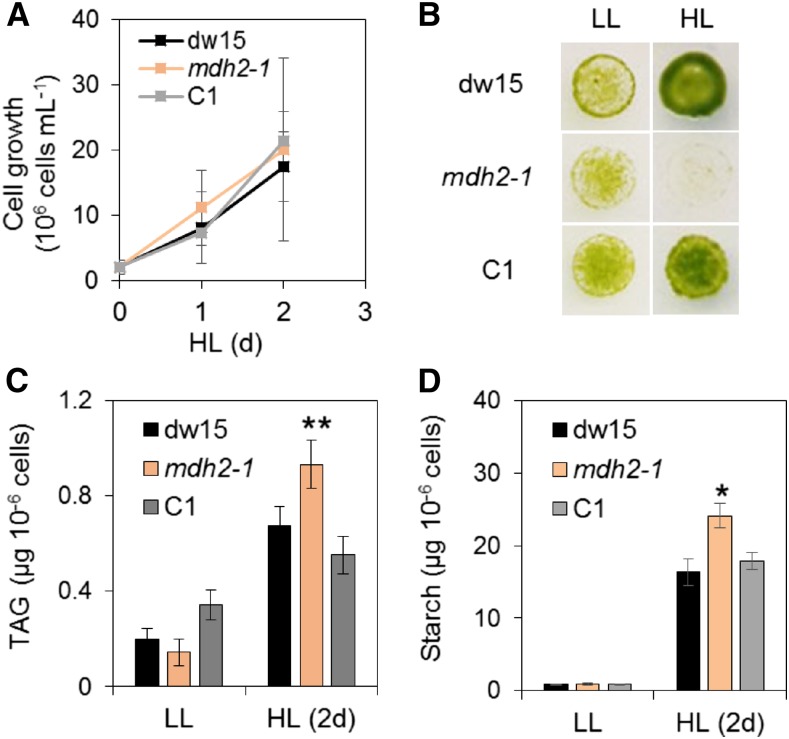
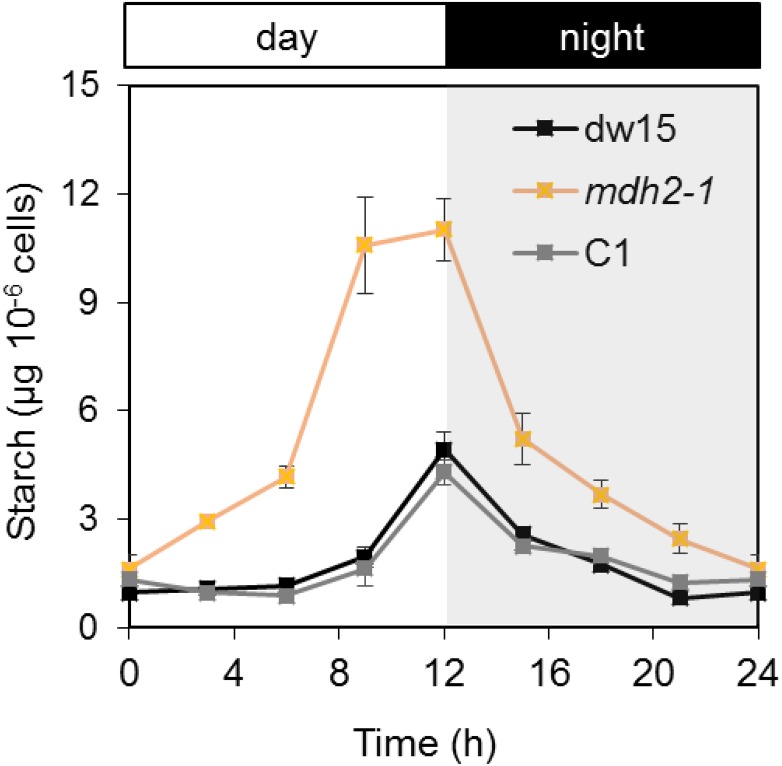
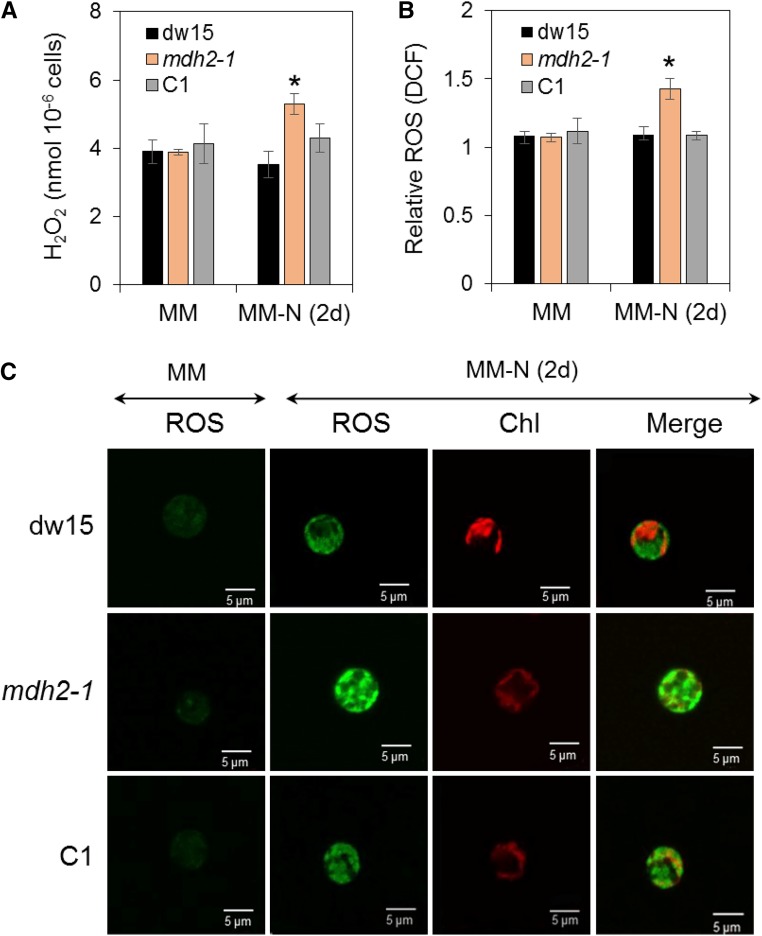
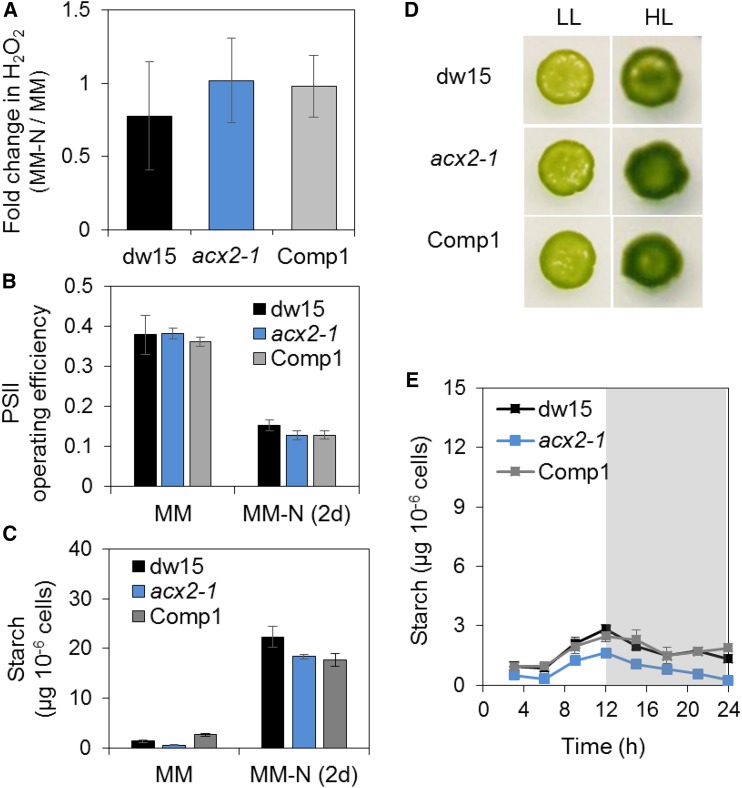
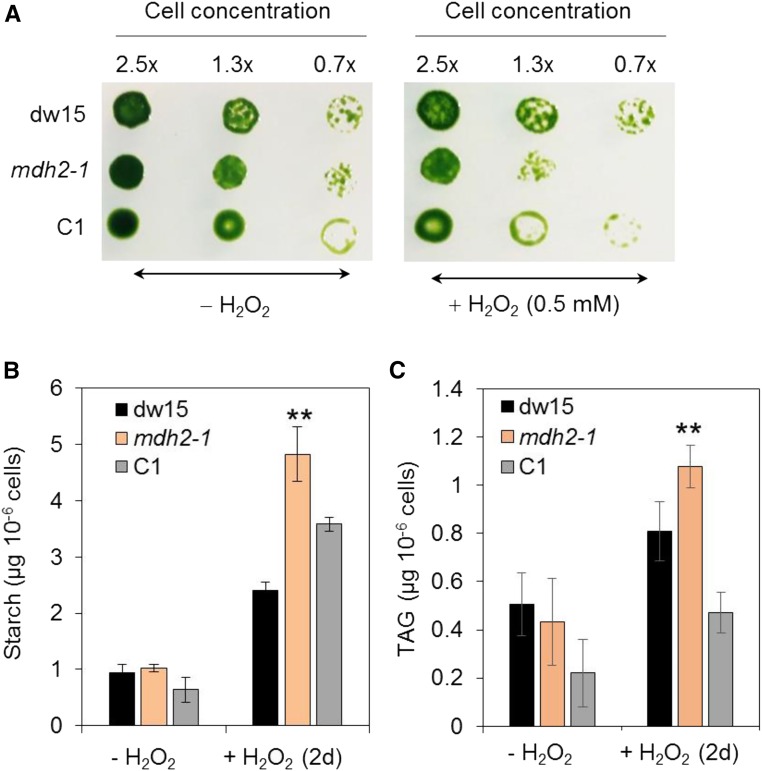
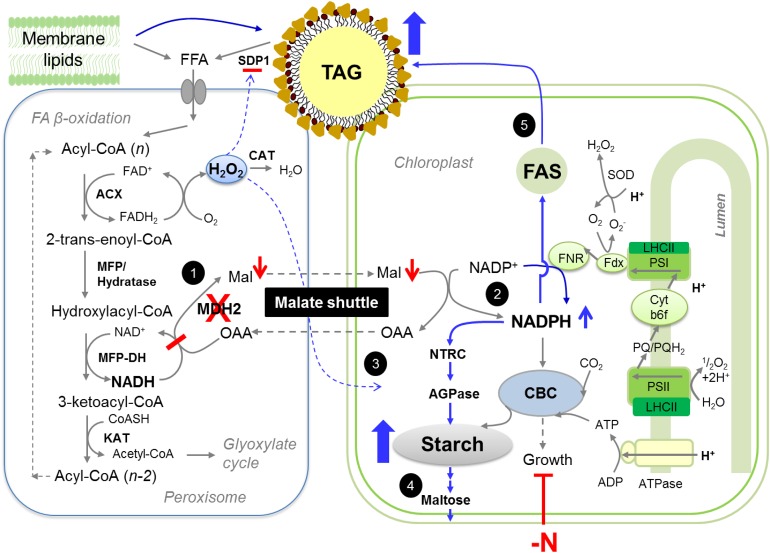
Plants and algae must tightly coordinate photosynthetic electron transport and metabolic activities given that they often face fluctuating light and nutrient conditions. The exchange of metabolites and signaling molecules between organelles is thought to be central to this regulation but evidence for this is still fragmentary. Here, we show that knocking out the peroxisome-located MALATE DEHYDROGENASE2 (MDH2) of Chlamydomonas reinhardtii results in dramatic alterations not only in peroxisomal fatty acid breakdown but also in chloroplast starch metabolism and photosynthesis. mdh2 mutants accumulated 50% more storage lipid and 2-fold more starch than the wild type during nitrogen deprivation. In parallel, mdh2 showed increased photosystem II yield and photosynthetic CO2 fixation. Metabolite analyses revealed a >60% reduction in malate, together with increased levels of NADPH and H2O2 in mdh2 Similar phenotypes were found upon high light exposure. Furthermore, based on the lack of starch accumulation in a knockout mutant of the H2O2-producing peroxisomal ACYL-COA OXIDASE2 and on the effects of H2O2 supplementation, we propose that peroxisome-derived H2O2 acts as a regulator of chloroplast metabolism. We conclude that peroxisomal MDH2 helps photoautotrophs cope with nitrogen scarcity and high light by transmitting the redox state of the peroxisome to the chloroplast by means of malate shuttle- and H2O2-based redox signaling.


Figures

Figure 1.
Figure 1.
Isolation of the mdh2-1 (Lb9G9) Mutant Impaired in TAG Breakdown during N Recovery. (A) TAG content 2 d after N deprivation and 1 d after N resupply in mixotrophically grown cells. (B) Visualization of LDs in cells upon N resupply (1 d) by staining with BODIPY. (C) The insertion site of the cassette APHVIII in mdh2-1. (D) RT-PCR analysis. (E) Immunoblot analysis using anti-MDH2 antibodies. (F) Cell volume determination. Cells were first grown mixotrophically in N-deprived conditions. After N resupply, cells were kept in the dark in MM medium (1 d) then were stained with BODIPY, and pseudocolors were used: lipid droplet in green and chlorophyll in red. The housekeeping gene used for RT-PCR is RACK1. For immunoblots, samples were loaded at equal total protein amount and stained by Coomassie blue. RACK1, Receptor of activated protein C kinase 1. Values are the mean of biological replicates (i.e., independent shaking flask cultures; n = 5, sd). Biological replicates refer to cells that were grown in independent flasks. Asterisks indicate statistically significant changes compared with the parental line dw15 by paired-sample Student’s t test (*P ≤ 0.05 and **P ≤ 0.01).
Figure 2.
Figure 2.
Genetic Complementation of mdh2-1 Mutant. (A) The construct used for genetic transformation. (B) Restoration of TAG levels to that of the wild type in the complemented lines. (C) Immunoblot detection of MDH2 in complemented lines using anti-V5 and anti-MDH2 antibodies. (D) TAG analysis during mixotrophic N deprivation. (E) Total FA quantification. (F) Starch analysis during mixotrophic N deprivation. TAG and starch contents were determined in N-deprived cells (2–3 d) and in N-resupplied cells (1 d). Two independent transformants (C1 and C2) were analyzed, and each line with three biological replicates (i.e., independent shaking flask cultures) and two technical replicates (i.e., different sampling from the same flask). Values are the mean of biological replicates (n = 3, sd). Asterisks indicate statistically significant changes compared with the control strains (dw15 and C1) by paired-sample Student’s t test (*P ≤ 0.05 and **P ≤ 0.01). Cells were grown in mixotrophic conditions under constant light. PHsp70A/RbcS2, the heat shock protein 70A and Rubisco small subunit promoter; ble, antibiotic resistance marker gene; TRbcS2, RbcS2 terminator; 2A, FMDV 2A self-cleaving peptide. For immunoblots, samples were loaded at equal total protein amounts. Loading controls were stained by Ponceau red for the upper panel and Coomassie blue for the lower panel.
Figure 3.
Figure 3.
mdh2-2 Mutant Characterization. (A) The insertion site of the cassette APHVIII in mdh2-2. (B) Immunoblot analysis using anti-MDH2 antibodies. (C) TAG content analysis. Cells were grown in mixotrophic conditions under constant light. TAG contents were determined in N-deprived cells (2 d) and in N-resupplied cells (1d and 2d). Values are the mean of biological replicates (i.e., independent shaking flask cultures; n = 3, sd). Asterisks indicate statistically significant changes compared with parental strain (CC4533) by paired-sample Student’s t test (**P ≤ 0.01). Note: We have screened six independent lines, and all of them possessed a hybridizing signal just below the expected size, suggesting the likely formation of a truncated protein (black arrow). For immunoblot, samples were loaded at equal total protein amounts. Loading controls were stained by Coomassie blue.
Figure 4.
Figure 4.
The mdh2-1 Mutant Overaccumulates TAG and Starch during Photoautotrophic N Deprivation. (A) TAG content. (B) Starch content. (C) Confocal microscopy image of LDs in N-deprived cells (2 d). (D) Total FA content. Cells were cultivated under constant light in photoautotrophic conditions with additional supply of 2% CO2 in the air. Values are the mean of biological replicates (i.e., independent shaking flask cultures; n = 6, sd). Cells were stained with BODIPY, and pseudocolors were used: lipid droplet in green and chlorophyll in red. Asterisks represent statistically significant difference from both control strains (the parental line dw15 and C1) by paired-sample Student’s t test (*P ≤ 0.05 and ** P ≤ 0.01). C1, one representative complemented line.
Figure 5.
Figure 5.
mdh2-2 Overaccumulates TAG and Starch, and Possesses Higher Photosynthetic Activity during Photoautotrophic N Deprivation. (A) TAG content. (B) Starch content. (C) PSII operating efficiency. (D) LD imaging after cells being stained by BODIPY. Cells were cultivated under constant light in photoautotrophic conditions with additional supply of CO2 at 2% in the air. Values are the mean of biological replicates (i.e., independent shaking flask cultures; n = 6, sd). Actinic light (200 µmol m−2 s−1) supplied by a red LED source was used for PSII yield measurement. Asterisks indicate statistically significant changes compared with the parental strain (CC4533) by paired-sample Student’s t test (**P ≤ 0.01). Cells were stained with BODIPY, and pseudocolors were used: lipid droplet in green and chlorophyll in red. mag., magnification.
Figure 6.
Figure 6.
mdh2-1 Displays Higher Photosynthetic Yield during Photoautotrophic N Deprivation. (A) Measurement of PSII operating efficiency. (B) and (C) Measurements of O2 production and net CO2 fixation using MIMS in N-replete (B) and in N-deprived cells (C). Cells were cultivated under constant light in photoautotrophic conditions with additional supply of 2% CO2 in the air. Values are the mean of biological replicates (i.e., independent shaking flask cultures; n = 3, sd). Actinic light (200 µmol m−2 s−1) supplied by a red LED was used for PSII yield measurement, whereas for MIMS analyses, light was supplied by a green LED source. Asterisks indicate statistically significant difference from both control strains (dw15 and C1) by paired-sample Student’s t test (*P ≤ 0.05 and **P ≤ 0.01). C1, one representative complemented line.
Figure 7.
Figure 7.
Measurement of NAD(P)H Fluorescence during Photoautotrophic N Starvation. (A) NADPH fluorescence in mdh2-1 and its parental strain dw15. (B) NADPH fluorescence in mdh2-2 and its parental strain CC4533. Cells were grown to a constant OD under continuous light in photoautotrophic condition (+2% CO2 supplemented in the air), then NADPH fluorescence was measured before (MM) and after N deprivation (MM-N 2 d). Cells were kept in the dark for 1 min before an actinic light exposure (at 70 µmol photons m−2 m−1 provided by a red LED). Values are the mean of the NAD(P)H fluorescence level obtained across the 20-s light exposure (i.e., independent shaking flask cultures; n = 3, sd). Original NAD(P)H fluorescence traces are shown in Supplemental Figure 10. Asterisks indicate significant difference compared with their respective parental strains by paired-sample Student’s t test (*P ≤ 0.05). A.U., arbitrary unit.
Figure 8.
Figure 8.
Immunoblot Analyses of Photosystem Proteins during Photoautotrophic N Deprivation. (A) Representative images of immunoblot analysis. (B) Quantification of signal intensities from cells being N-starved for 2 d. Proteins were collected from cells before (MM) and after photoautotrophic (+2% CO2 supplemented in the air) N deprivation (MM-N, 2d) under constant light. Representative images of immunoblot analysis are shown. Signals for (B) were averaged from three biological replicates (i.e., independent shaking flask cultures) for N-starved cells (n = 3; sd). Asterisks indicate significant difference from the parental strain dw15 by paired-sample Student’s t test (*P ≤ 0.05). Samples were loaded at equal total protein amounts and stained using Coomassie blue.
Figure 9.
Figure 9.
Metabolomics Analysis of Polar Metabolites in Photoautotrophically Grown Cells before and 2 d after N Deprivation. (A) A heat map view of metabolic changes. (B) Intracellular malate content. (C) Intracellular maltose content. (D) Intracellular sucrose content. Cells were cultivated under constant light in photoautotrophic conditions with additional supply of 2% CO2 in the air. Values are the mean of biological replicates (i.e., independent shaking flask cultures; n = 8, sd). Asterisks indicate significant difference from control strains by paired-sample Student’s t test (*P ≤ 0.05 and **P ≤ 0.01). A.U., arbitrary unit.
Figure 10.
Figure 10.
Cell Growth during Photoautotrophic N Deprivation. (A) Relative growth based on cell number per milliliter of culture. (B) Relative growth based on cell volume per milliliter of culture. (C) Relative growth based on dry biomass per milliliter of culture. Cells were cultivated under constant light in photoautotrophic N starvation conditions with additional supply of CO2 at 2% in the air. Cell growth was monitored every day using a Coulter counter. Then, cell concentration was normalized to that before N deprivation (which is set as 1). Values are the mean of biological replicates (i.e., independent shaking flask cultures; n = 11, sd). Asterisks indicate statistically significant difference from control strains by paired-sample Student’s t test (*P ≤ 0.05). Cell vol, cellular volume.
Figure 11.
Figure 11.
HL Response of the mdh2-1 Mutant during Photoautotrophic Growth. (A) Growth kinetics in liquid cultures under HL. (B) Growth comparison on agar plates. (C) TAG content on a per cell basis. (D) Starch content on a per cell basis. Cells were cultivated under constant light (either HL or LL) in photoautotrophic conditions with additional supply of 2% CO2 in the air. Light was provided by a cool LED white light. The same number of cells were inoculated on MM agar plate and kept under continuous light to monitor cell growth. Images were taken 6 d after cells being deposited. Values are the mean of biological replicates (i.e., independent shaking flask cultures; n = 4, sd). Asterisks indicate significant difference from control strains by paired-sample Student’s t test (*P ≤ 0.05 and **P ≤ 0.01). LL, 50 µmol m−2 s−1; HL, 500 µmol m−2 s−1.
Figure 12.
Figure 12.
Starch Accumulation during Photoautotrophic Diurnal Growth. Cells were cultivated in a diurnal cycle of 12 h light/12 h dark in a controlled incubation chamber supplied with 2% CO2 in air. Light was supplied via fluorescent tubes at an intensity of 100 µmol m−2s−1. Values are the mean of biological replicates (i.e., independent shaking flask cultures; n = 4, sd). Shaded area refers to the night period.
Figure 13.
Figure 13.
Determination of H2O2 Level during Photoautotrophic N Deprivation. (A) Extracellular H2O2 level determined by Amplex Red. (B) Relative DCF fluorescence level. (C) Intracellular ROS level determined using H2DCFDA staining. Cells were cultivated under constant light in photoautotrophic conditions with additional supply of 2% CO2 in the air. Values are the mean of biological replicates (i.e., independent shaking flask cultures; n = 4, sd). Asterisks indicate significant difference compared with control strains (dw15 and C1) by paired-sample Student’s t test (*P < 0.05). C1, the complemented line.
Figure 14.
Figure 14.
Effect of Silencing ACX2 on Starch Accumulation and HL Response. (A) Fold change in H2O2 production in acx2-1. (B) Operating PSII efficiency. (C) Starch content before and after N deprivation (2 d). (D) Light sensitivity test. (E) Starch content during diurnal growth. Cells were grown in liquid culture under constant light with additional supply of 2% CO2 and then the same number of cells was inoculated on MM agar plate and kept under continuous light (supplied by cool LED white light) to monitor cell growth at 25°C. Images were taken 7 d after cells being deposited. Actinic light (200 µmol m−2 s−1) supplied by a red LED source was used for PSII yield measurement. LL, 50 µmol m−2 s−1; HL, 500 µmol m−2 s−1. Shown are the parental strain dw15, acx2-1, and one complemented line (Comp1). Shaded area refers to the night period. Values are the mean of biological replicates (i.e., independent shaking flask cultures; n = 4, sd).
Figure 15.
Figure 15.
Effect of H2O2 Supplementation on TAG and Starch Content during Photoautotrophic Growth. (A) Cell growth. (B) Starch content per cell. (C) TAG content per cell. Cells were cultivated under constant light in photoautotrophic conditions with additional supply of 2% CO2 in the air. Cells were collected before and 2 d after H2O2 addition (0.5 mM). A given number of cells was deposited on MM agar plates with or without addition of H2O2. Images were taken 7 d after cells being deposited. Values are the mean of biological replicates (i.e., independent shaking flask cultures; n = 4, sd). Asterisks indicate statistically significant difference from control strains (dw15 and C1) by paired-sample Student’s t test (**P ≤ 0.01).
Figure 16.
Figure 16.
Tentative Model Explaining Redirection of Metabolism in the Absence of MDH2 during Photoautotrophic N Deprivation. FA degradation starts with hydrolysis of TAGs and membrane lipids by lipases. FAs released enter the peroxisomes via an ABC transporter and subsequently are degraded to acetyl-CoAs by the core FA β-oxidation spiral, which consists of four enzymatic activities (ACX, MFP-hydratase, MFP-DH, and KAT). MDH2 plays a role in oxidation of NADH, which is generated by hydroxylacyl-CoA dehydrogenase (MFP-DH) at the third step of β-oxidation spiral. In the absence of MDH2, NADH is likely accumulated, thereby increasing the reduction state of peroxisome. This would result in two metabolic changes in peroxisome: a decrease in malate export and an increase in H2O2 level. These two metabolites would in turn significantly alter photosynthesis and chloroplast metabolism. Activated pathways in the mutant are indicated by blue arrows, whereas downregulated pathways are indicated by red arrows. Based on results obtained from this study and current literature, we propose a cascade of events leading to the observed phenotypes in mdh2 mutants: “High oil” phenotype (events 1, 2, and 5): A block in FA β-oxidation combined with increased de novo FA synthesis contributes to higher TAG accumulation. “High starch” phenotype (events 2 to 4): During N starvation, the more active CO2 fixation and photosynthesis in the mdh2-1 mutant provides more NADPH and carbon precursors for starch synthesis. The increased level of NADPH in chloroplast activates AGPase for starch synthesis and also activates several starch-degrading enzymes; therefore, it results in an increased carbon flux into and out of the starch route. Higher amounts of starch indicate high sink capacity, therefore sustaining photosynthesis. As a consequence, more NADPH is produced by photochemical reactions, and this further activates AGPase, together resulting in the 100 to 300% increase in starch content. “High H2O2” phenotype (event 3): The higher level of H2O2 in the mutant is supported by the 2-fold increase in the H2O2-generating reaction catalyzed by ACX activity. Once it is transmitted to chloroplast, H2O2 activates the starch synthesis pathway, as supported further by the observation of starch overaccumulation in wild-type cells supplemented with exogenous H2O2. “Sustained photosynthesis” (events 1 and 2): A blockage in FA β-oxidation at the step of MDH2 will result in less malate being produced in the peroxisome. Malate, a recognized electron carrier, can be transported to other compartments via the dicarboxylate transporter. When malate level is high, less NADP+ is available as electron acceptor at PSI, therefore downregulating photosynthesis. Conversely, in the absence of MDH2, the malate level is decreased, and more NADP+ is available to accept electrons from PSI. ACX, acyl-CoA oxidase; CAT, catalase; CBC, Calvin-Benson-Bassham cycle; CTS1, comatose 1; DH, dehydrogenase; FAD, flavin adenine dinucleotide; FFA, free fatty acid; Fdx, ferredoxin; FNR, ferredoxin-NADP+ reductase; KAT, ketoacyl-CoA thiolase; LHC, light-harvesting complex; Mal, malate; MFP, multifunctional protein; NTRC, NADP:thioredoxin reductase C; OAA, oxaloacetate; PQ, plastoquinone; SDP1, sugar dependent 1; SOD, superoxide dismutase.
None

Similar articles

Cited by

References

    1. Aboelmy M.H., Peterhansel C. (2014). Enzymatic characterization of Chlamydomonas reinhardtii glycolate dehydrogenase and its nearest proteobacterial homologue. Plant Physiol. Biochem. 79: 25–30. - PubMed
    1. Allorent G., et al. (2013). A dual strategy to cope with high light in Chlamydomonas reinhardtii. Plant Cell 25: 545–557. - PMC - PubMed
    1. Araújo W.L., Tohge T., Osorio S., Lohse M., Balbo I., Krahnert I., Sienkiewicz-Porzucek A., Usadel B., Nunes-Nesi A., Fernie A.R. (2012). Antisense inhibition of the 2-oxoglutarate dehydrogenase complex in tomato demonstrates its importance for plant respiration and during leaf senescence and fruit maturation. Plant Cell 24: 2328–2351. - PMC - PubMed
    1. Bailleul B., et al. (2015). Energetic coupling between plastids and mitochondria drives CO2 assimilation in diatoms. Nature 524: 366–369. - PubMed
    1. Ball S., Dirick L., Decq A., Martiat J., Matagne R. (1990). Physiology of starch storage in the monocellular alga Chlamydomonas reinhardtii. Plant Sci. 66: 1–9.

Publication types

MeSH terms

LinkOut - more resources