. 2018 Oct;24(10):1377-1389.
doi: 10.1261/rna.066787.118. Epub 2018 Jul 11.

Translation elongation and mRNA stability are coupled through the ribosomal A-site

Affiliations

Translation elongation and mRNA stability are coupled through the ribosomal A-site

Gavin Hanson et al. RNA. 2018 Oct.

Abstract

Messenger RNA (mRNA) degradation plays a critical role in regulating transcript levels in eukaryotic cells. Previous work by us and others has shown that codon identity exerts a powerful influence on mRNA stability. In Saccharomyces cerevisiae, studies using a handful of reporter mRNAs show that optimal codons increase translation elongation rate, which in turn increases mRNA stability. However, a direct relationship between elongation rate and mRNA stability has not been established across the entire yeast transcriptome. In addition, there is evidence from work in higher eukaryotes that amino acid identity influences mRNA stability, raising the question as to whether the impact of translation elongation on mRNA decay is at the level of tRNA decoding, amino acid incorporation, or some combination of each. To address these questions, we performed ribosome profiling of wild-type yeast. In good agreement with other studies, our data showed faster codon-specific elongation over optimal codons and faster transcript-level elongation correlating with transcript optimality. At both the codon-level and transcript-level, faster elongation correlated with increased mRNA stability. These findings were reinforced by showing increased translation efficiency and kinetics for a panel of 11 HIS3 reporter mRNAs of increasing codon optimality. While we did observe that elongation measured by ribosome profiling is composed of both amino acid identity and synonymous codon effects, further analyses of these data establish that A-site tRNA decoding rather than other steps of translation elongation is driving mRNA decay in yeast.

Keywords: codon optimality; decoding; mRNA decay; translation elongation.


Figures

FIGURE 1.
FIGURE 1.
Codon-specific translation EREs correlate with codon influence on mRNA decay. (A) Metagene analysis of 28 nt RPFs, relative to the first nucleotide of the coding sequence (position = 0). Read positions are counted based on the 5′ end of the RPFs. (B) Normalized per-codon translation EREs, ordered from fastest to slowest. The EREs for each of the 61 codons have been standardized to have a mean of 0 and a variance of 1. Error bars represent the 95% confidence intervals (95CI) for the estimate. We have colored each codon to reflect a codon-specific tAI value (tAIc) above (green) or below (red) the median tAI. (C) The best-fit line describing the relationship between normalized per-codon EREs and codon stability coefficients (CSCs), a measure of the influence of codons on mRNA stability. This relationship takes into account the uncertainty in the estimates of elongation rates and CSCs to arrive at a more robust estimate of the overall error in the correlation between these values. Uncertainties in both ERE and CSC values are included in the plot as the x- and y-axis 95% confidence intervals (95CI), respectively. The shaded region represents the 95% confidence intervals for the relationship between ERE and CSC. (D) Box plots showing the distribution of average transcript-level normalized EREs associated with the specified levels of percent stabilizing codons within mRNAs globally. Percent stabilizing codons reflects the proportion of codons in an mRNA with a CSC value greater than 0. Average transcript-level EREs are obtained by averaging per-codon EREs across the entire coding sequence of an mRNA. Notches reflect the standard error of the overall average EREs within each bin. Bin intervals are closed on the left and open on the right.
FIGURE 2.
FIGURE 2.
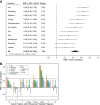
Translation elongation rates of codons within the ribosomal A-site correlate with codon influence on mRNA stability. (A) Forest plot describing the meta-analysis of the correlations between normalized EREs and CSCs, a measure of the influence of codons on mRNA stability, using data from 11 cycloheximide-minus ribosome profiling experiments. The correlation between EREs and CSCs for each data set are shown by the squares, with the error bars representing the associated 95% confidence interval (95CI). The combined Pearson correlation estimate is represented by the large black diamond, with the width of the diamond representing the 95% confidence interval of the aggregate correlation estimate. I2 (the percentage of the variation across studies that is attributable to true between-study heterogeneity) and Cochran's Q are also reported as standard measures of heterogeneity. (B) Bar plot showing the correlation between ERE and CSC values of codons located at specific locations within the RPFs. The E-site, P-site, and A-site correspond to the trinucleotide sequence located at the +9, +12, and +15 positions within the RPFs, respectively, and this analysis is extended beyond these positions in either direction. The dashed lines represent the critical r value, such that values outside of the dashed lines represent statistically significant correlations at an uncorrected α = 0.05.
FIGURE 3.
FIGURE 3.
Ribosomal A-site decoding drives the relationship between EREs and mRNA stability. (A) Scatter plot and best-fit line describing the relationship between average normalized EREs across a transcript and transcript stability. EREs are calculated using ribosome profiling data from this study, and transcript stability is plotted as the log of the transcript HL (Presnyak et al. 2015). The correlation between transcript-level ERE and transcript HL takes into account the per-gene variability in these estimates. (B) Forest plot describing the meta-analysis across 11 cycloheximide-minus ribosome profiling data sets of the correlation between the log of mRNA HL and either transcript-level ERE (EREcodons + aa; red squares) or transcript-level ERE that takes into account the influence of codon identity, but not the influence of amino acid identity, on elongation rate (EREcodons only; black squares) with the lines corresponding to the 95% confidence interval. The aggregate correlation estimates for the EREcodons + aa and EREcodons only analyses are represented by the large red and black diamonds, respectively, with the width of the diamond corresponding to the 95% confidence interval of the aggregate estimate. I2 and Cochran's Q are also reported as standard measures of heterogeneity. (C) Scatter plots of the relationship between normalized per-codon ERE and CSC, with grouping based on the properties of the encoded amino acid. The best-fit lines in each plot describe the relationship between ERE and CSC for each amino acid associated with more than one codon.
FIGURE 4.
FIGURE 4.
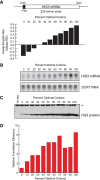
Translation efficiency is influenced by codon optimality. (A) Schematic representation of a HIS3 mRNA with an N-terminal FLAG tag. The HIS3 coding sequence was randomly altered using synonymous codons to generate constructs with varying percent codon optimality, from 0% to 100%. The average ERE for each construct is shown. (B) Steady state HIS3 mRNA levels expressed from the 0%–100% optimal HIS3 constructs were analyzed by northern blot and were quantified relative to an SCR1 loading control. (C) Steady state protein levels expressed from the 0%–100% optimal HIS3 constructs were analyzed by western blot using anti-FLAG antibody. While the image presented here illustrates the clear correlation between codon optimality and steady state protein abundance using equivalent loading for each sample, more accurate quantification of protein levels was performed using variably diluted samples to minimize protein saturation of the higher optimality constructs. These more accurate values were used for the analysis shown in Figure 4D. The asterisk in this figure indicates the position of a nonspecific band that is indicative of equal loading in all lanes. (D) Graphical representation of the translation efficiency of each HIS3 construct relative to the 0% optimal construct. Translation efficiencies were determined by dividing the steady state protein abundance by the steady state mRNA abundance for each construct.
FIGURE 5.
FIGURE 5.
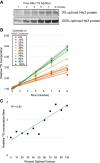
Codon optimality contributes to the rate of His3 protein production during 35S-methionine/cysteine labeling. (A) A representative image showing levels of 35S-methionine/cysteine-labeled His3 protein at each time point following addition of 35S-methionine/cysteine to S. cerevisiae cells at mid-log phase. His3 protein expressed from the 0% and 100% optimal HIS3 constructs is presented. (B) Graphical representation of the increase in 35S-methionine/cysteine-labeled His3 protein abundance over time, relative to the protein abundance at the 2 min time point, for each of the 0%–100% optimal HIS3 constructs. (C) The slope of each curve in Figure 5B, normalized to the slope for the 0% optimal construct, is plotted as a measure of the relative rate of 35S incorporation per minute for each HIS3 construct.

Similar articles

Cited by

References

    1. Anders S, Pyl PT, Huber W. 2015. HTSeq–a Python framework to work with high-throughput sequencing data. Bioinformatics 31: 166–169. - PMC - PubMed
    1. Bazzini AA, Del Viso F, Moreno-Mateos MA, Johnstone TG, Vejnar CE, Qin Y, Yao J, Khokha MK, Giraldez AJ. 2016. Codon identity regulates mRNA stability and translation efficiency during the maternal-to-zygotic transition. EMBO J 35: 2087–2103. - PMC - PubMed
    1. Boël G, Letso R, Neely H, Price WN, Wong K-H, Su M, Luff JD, Valecha M, Everett JK, Acton TB, et al. 2016. Codon influence on protein expression in E. coli correlates with mRNA levels. Nature 529: 358–363. - PMC - PubMed
    1. Cai Y, Futcher B. 2013. Effects of the yeast RNA-binding protein Whi3 on the half-life and abundance of CLN3 mRNA and other targets. PLoS One 8: e84630. - PMC - PubMed
    1. Carpenter B, Gelman A, Hoffman MD, Lee D, Goodrich B, Betancourt M, Brubaker MA, Guo J, Li P, Riddell A. 2017. Stan: a probabilistic programming language. J Stat Softw 76: 1–32. - PMC - PubMed

Publication types