. 2018 Jul 12;3(13):e120546.
doi: 10.1172/jci.insight.120546.

Repetitive ischemic injuries to the kidneys result in lymph node fibrosis and impaired healing

Affiliations

Repetitive ischemic injuries to the kidneys result in lymph node fibrosis and impaired healing

Omar H Maarouf et al. JCI Insight. .

Erratum in

Abstract

The contribution of the kidney-draining lymph node (KLN) to the pathogenesis of ischemia-reperfusion injury (IRI) of the kidney and its subsequent recovery has not been explored in depth. In addition, the mechanism by which repetitive IRI contributes to renal fibrosis remains poorly understood. Herein, we have found that IRI of the kidney is associated with expansion of high endothelial venules (HEVs) and activation of fibroblastic reticular cells (FRCs) in the KLN, as demonstrated by significant expansion in the extracellular matrix. The lymphotoxin α signaling pathway mediates activation of FRCs, and chronic treatment with lymphotoxin β receptor-immunoglobulin fusion protein (LTβr-Ig) resulted in marked alteration of the KLN as well as augmentation of renal fibrosis. Depletion of FRCs reduced T cell activation in the KLN and ameliorated renal injury in acute IRI. Repetitive renal IRI was associated with senescence of FRCs, fibrosis of the KLN, and renal scarring, which were ameliorated by FRC administration. Therefore, our study emphasizes the critical role of FRCs in both the initiation and repair phases of injury following IRI of the kidney.

Keywords: Chronic kidney disease; Fibrosis; Nephrology.


Conflict of interest statement

Conflict of interest: The authors have declared that no conflict of interest exists.

Figures

Figure 1
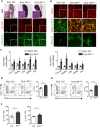
Figure 1. Activation of fibroblastic reticular cells (FRCs) results in major structural changes in kidney-draining lymph node (KLN) following ischemia-reperfusion injury (IRI) of the kidney.
(A) KLN draining ischemic kidney shows loss of T and B cell zone differentiation, as compared with the KLN draining nonischemic kidney (KLN: Ctrl) at 2 days (KLN: IRI(D2)) and 30 days (KLN: IRI(D30)) following IRI. Arrows point to cortical B cell zone, dashed line divides cortical from subcortical T cell zone (arrowheads), while dotted line divides subcortical zone from the medulla containing medullary chordae (inset: asterisk). At both time points, fluorescence reveals increased interstitial extracellular matrix (ECM) in KLN tissue: ER-TR7 and fibronectin (insets show thickened and nodular pattern). Scale bars: 500 μm and 200 μm (inset) for H&E; 200 μm and 100 μm (inset) for ER-TR7 and fibronectin. (B) FRC signal (podoplanin, PDPN) is increased at 2 days (KLN: IRI(D2)) and 30 days (KLN: IRI(D30)) following IRI (inset shows enlarged cytoplasm). Costaining of PDPN and α smooth muscle actin (αSMA) suggests FRC transition in KLN following IRI of the kidney. High endothelial venules (HEVs) stained with MECA79, which labels peripheral node addressin on HEVs, show expansion and elongation 2 days and 30 days following IRI. Scale bars: 200 μm and 100 μm (inset) for PDPN; 100 μm for αSMA+PDPN and MECA79. (C) Following IRI, KLN tissue expresses increased activated FRC gene transcripts, as assessed by qPCR (n = 4/group, mean ± SEM). (D) Flow cytometry of KLNs shows increased CD45PDPN+CD31 FRC percentage at 2 days following IRI (gated on CD45 cells, representative flow plots) (n = 6/group, mean ± SEM). (E) Flow cytometry of KLNs shows increased CD45PDPN+CD31FRC percentage at 30 days following IRI (gated on CD45 cells, representative flow plots) (n = 5/group, mean ± SEM). (F) Flow cytometry of KLNs showed increased percentage of proliferating (Ki-67+) FRCs 2 days and 30 days following IRI in comparison with KLN of nonischemic kidney (n = 3–4/group, mean ± SEM). *P < 0.05; **P < 0.01 by Student’s t test.
Figure 2
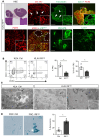
Figure 2. Repetitive renal IRI induces senescence in KLN-resident FRCs.
KLNs were harvested 2 weeks after the induction of the third IRI (KLN: IRI(rep)). (A) Microscopy shows marked hypocellularity and loss of differentiation between cortical and subcortical zones. Both ER-TR7 and fibronectin staining insets illustrate areas of lobulated and thickened ECM. Arrowheads in ER-TR7 and fibronectin staining demonstrate areas of excessive ECM deposits with interstitial swelling. Collagen I matrix is increased, especially in subcortical areas, and ECM is expanded in the subcortical T cell zone, proximal to the B cell zone in costaining of KLN with Coll I and F4/80 (see dashed lines in inset). FRC staining demonstrates enlarged cytoplasms (inset in PDPN). Many KLN interstitial cells are stained with αSMA. Several of these cells are senescent (p16INK4A+), especially in the subcortex (next to the dashed line); inset: close-up of senescent cells. HEV structure is markedly thickened (close-up image in inset). Lyve1 stain reveals regression of the lymphatic endothelial network. Scale bars: 500 μm and 200 μm (inset) for H&E; 200 μm and 100 μm (inset) for ER-TR7, PDPN, and αSMA+p16INK4A; 500 μm and 100 μm (inset) for fibronectin and CollI+F4/80; 100 μm and 50 μm (inset) for MECA79; 200 μm for Lyve1. (B) Flow cytometric analysis of CD45 cells from KLNs following repetitive IRI (KLN: IRI(rep)) or without repetitive IRI (KLN: Ctrl) shows significantly decreased percentages of CD45PDPN+CD31 FRCs and proliferating (Ki67+) FRCs, along with representative flow cytometry plots (n = 4–6/group, mean ± SEM). (C) Electron microscopy of naive KLN shows HEV endothelium (white asterisks) and supporting perivascular FRCs (white arrowheads). Arrows indicate lymphocytes in active diapedesis into the interstitium of the KLN (KLN: Ctrl). KLN following repetitive IRI (KLN: IRI(rep)) shows obliteration of the HEV lumen with detachment of HEV cells (white asterisks) from the vessel’s basement membrane and intrusion into the lumen. White arrowheads indicate perivascular FRCs. Some HEV cells show denser and smaller nuclei, along with shrunken cytoplasm, and HEV has intraluminal ECM deposits (black arrowheads). (D) FRCs from KLNs of mice with or without repetitive IRI were cultured in vitro and stained with β-galactosidase (senescence marker). Micrograph of FRCs from KLN following repetitive IRI showed senescent cells with lysosome-like vacuoles (white arrowhead) at a significantly higher percentage than FRCs from the KLNs of naive mice (n = 6/group, mean ± SEM). **P < 0.01 by Student’s t test.
Figure 3
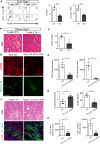
Figure 3. FRCs play a crucial role in the augmentation of immune activation following IRI.
(A) Flow cytometric analysis shows a higher percentage of CD45PDPN+CD31 FRCs and proliferating (Ki67+) FRCs in KLNs harvested 2 days following IRI from Rag1–/– mice injected with WT T cells than KLNs from those injected with LTα–/– T cells, along with representative flow cytometry plots (gated on CD45 cells) (n = 3–4/group, mean ± SEM). (B) H&E staining (scale bar: 75 μm) of kidney tissue from Rag1–/– mice following IRI demonstrates renal protection upon adoptive T cell transfer from LTα–/– mice, along with (C) lower BUN, as compared with Rag1–/– mice that received T cells from WT mice (n = 3/group, mean ± SEM). (D) Immunofluorescence of KLN shows marked decrease in PDPN+ FRCs in DT-treated CCL19Cre × iDTR mice as compared with untreated WT mice. Paucity in HEV abundance and abrogation of architectural elongation is also shown. Scale bars: 200 μm for PDPN, 100 μm for MECA79. (E) Absolute cell counts of FRCs and HEVs are significantly lower in the KLNs of CCL19Cre × iDTR mice, in comparison with the KLNs from WT mice, as determined by flow cytometric analysis (n = 3/group, mean ± SEM). (F) FRC depletion leads to amelioration in kidney damage after IRI. H&E staining shows less tubular injury in CCL19Cre × iDTR mice, as compared with WT mice. F4/80 staining indicates tissue inflammation is markedly decreased in CCL19Cre × iDTR mice after IRI. LTL identifies proximal tubules. Scale bars: 75 μm. (G) Left panel: Mean cortical thickness of kidneys in FRC-depleted mice was higher than in WT mice following IRI (n = 6/group, mean ± SEM). Right panel: CCL19Cre × iDTR mice are protected from IRI, as indicated by lower BUN (mg/dl) (n = 6/group, mean ± SEM). (H) Left panel: Absolute count of CD4+IFN-γ+ T cells in KLN is significantly lower in CCL19Cre × iDTR mice in comparison with WT mice following IRI. Right panel: Absolute count of CD4+CD44hi T cells in KLN is significantly lower in CCL19Cre × iDTR mice in comparison with WT mice (n = 3–4/group, mean ± SEM). *P < 0.05; **P < 0.01 by Student’s t test.
Figure 4
Figure 4. LTβ receptor–immunoglobulin (LTβr-Ig) treatment enhances renal fibrosis following IRI.
(A) Ischemic kidney from mouse treated with LTβr-Ig fails to recover histologically (H&E) 30 days following IRI and shows tissue fibrosis (Masson T), in comparison with the kidney from mouse treated with control IgG. Thirty days following IRI, the ischemic kidney from mouse treated with LTβr-Ig shows increased staining of αSMA, fibronectin, and F4/80, as compared with the kidney from mouse treated with control IgG. Scale bars: 75 μm. (B) Thirty days following IRI, KLN from mouse treated with LTβr-Ig shows marked increase in fibronectin staining, as compared with KLN from mouse treated with control IgG. Scale bar: 200 μm. (C) Thirty days following IRI, BUN is significantly higher in mouse receiving LTβr-Ig, as compared with mouse treated with control IgG (n = 5–6/group, mean ± SEM). *P < 0.05 by Student’s t test.
Figure 5
Figure 5. Injection of FRCs ameliorates chronic renal injury following repetitive IRI.
(A) IR800-NP–labeled FRCs preferentially traffic to KLN draining injured kidney (arrowhead: popliteal LN; white arrow: KLN draining ischemic kidney; blue arrow: KLN draining non-ischemic kidney). (B) Flow cytometric analysis demonstrates that injection of FRCs at time of recurrent IRI leads to increased FRC population in KLN in comparison with injection of vehicle (n = 3/group, mean ± SEM). (C) Light microscopy shows amelioration of kidney injury in mice injected with FRCs at the time of recurrent IRI, as compared with mice injected with vehicle (arrowheads: cast-filled and dilated tubules; arrow: interstitial expansion and hypocellularity). Masson’s trichrome staining shows decreased fibrosis in FRC-treated mice. Scale bars: 75 μm. (D) Substantial declines in fibronectin density and F4/80+ macrophage infiltration of kidney is observed following FRC injection at the time of recurrent IRI. Scale bars: 75 μm. (E) Semiquantitative analysis of the corresponding fluorescent signals in kidney tissue shows significantly lower signals in the FRC-treated group (n = 5–6/group, mean ± SEM). (F) Absolute count of kidney-infiltrating macrophages following IRI, as measured by flow cytometry, confirms a significant drop in macrophage recruitment with FRC treatment (n = 5/group, mean ± SEM). (G) FRC injection prevents architectural changes in KLN following IRI. Scale bars: 500 μm (left) and 200 mm (right). *P < 0.05 by Student’s t test.

Comment in

References

    1. Brown JR, Rezaee ME, Marshall EJ, Matheny ME. Hospital mortality in the United States following acute kidney injury. Biomed Res Int. 2016;2016:4278579. - PMC - PubMed
    1. Wang HE, Muntner P, Chertow GM, Warnock DG. Acute kidney injury and mortality in hospitalized patients. Am J Nephrol. 2012;35(4):349–355. doi: 10.1159/000337487. - DOI - PMC - PubMed
    1. Munshi R, Hsu C, Himmelfarb J. Advances in understanding ischemic acute kidney injury. BMC Med. 2011;9:11. - PMC - PubMed
    1. Case J, Khan S, Khalid R, Khan A. Epidemiology of acute kidney injury in the intensive care unit. Crit Care Res Pract. 2013;2013:479730. - PMC - PubMed
    1. Schrier RW, Wang W, Poole B, Mitra A. Acute renal failure: definitions, diagnosis, pathogenesis, and therapy. J Clin Invest. 2004;114(1):5–14. doi: 10.1172/JCI22353. - DOI - PMC - PubMed

Publication types