. 2018 Jul 11;19(7):2022.
doi: 10.3390/ijms19072022.

Multiple Layers of CDK5R1 Regulation in Alzheimer's Disease Implicate Long Non-Coding RNAs

Affiliations

Multiple Layers of CDK5R1 Regulation in Alzheimer's Disease Implicate Long Non-Coding RNAs

Marco Spreafico et al. Int J Mol Sci. .

Abstract

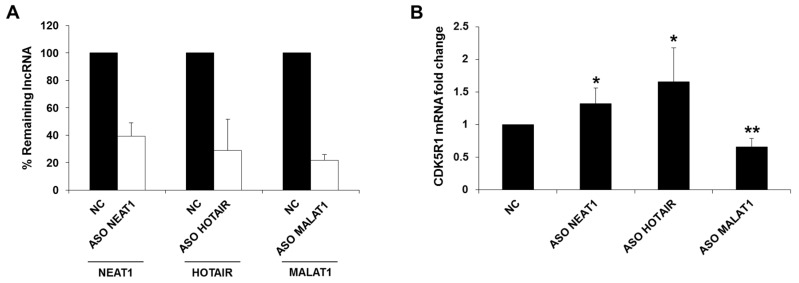
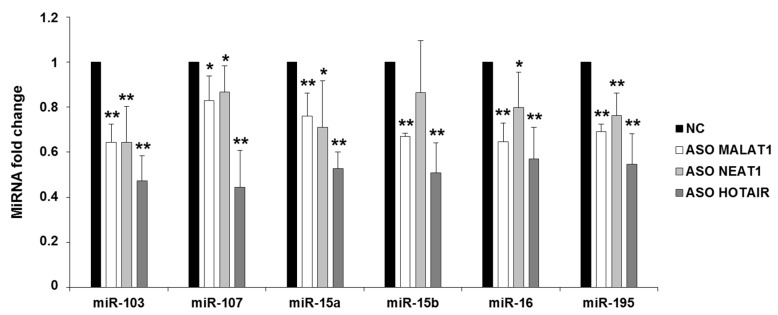
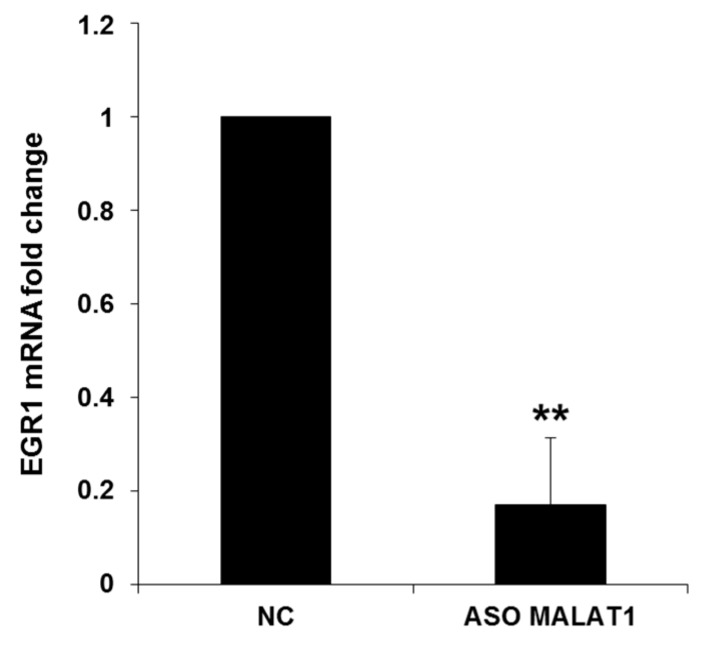
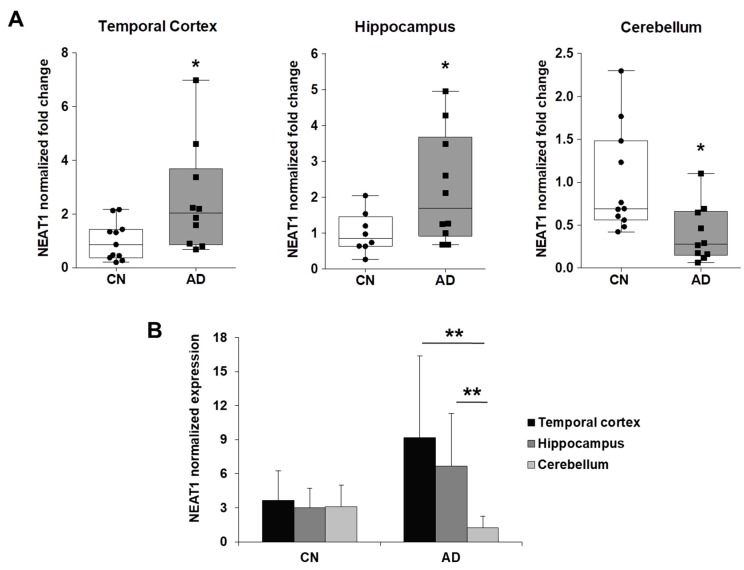
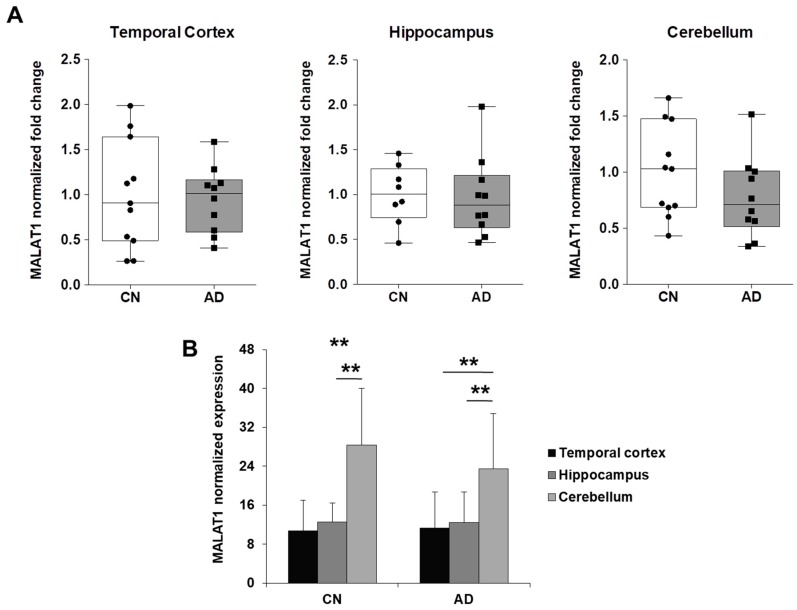
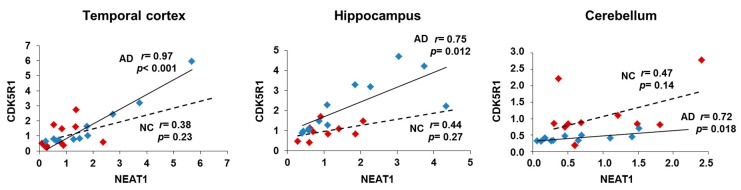
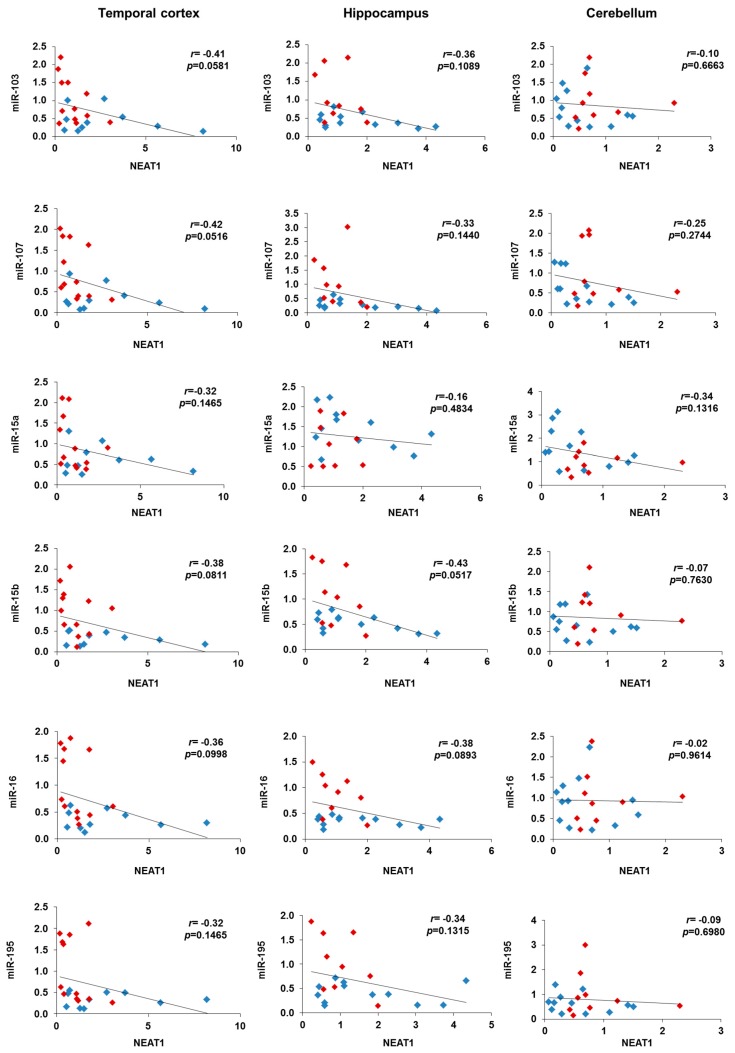
Cyclin-dependent kinase 5 regulatory subunit 1 (CDK5R1) gene encodes for p35, the main activator of Cyclin-dependent kinase 5 (CDK5). The active p35/CDK5 complex is involved in numerous aspects of brain development and function, and its deregulation is closely associated to Alzheimer's disease (AD) onset and progression. We recently showed that miR-15/107 family can negatively regulate CDK5R1 expression modifying mRNA stability. Interestingly, miRNAs belonging to miR-15/107 family are downregulated in AD brain while CDK5R1 is upregulated. Long non-coding RNAs (lncRNAs) are emerging as master regulators of gene expression, including miRNAs, and their dysregulation has been implicated in the pathogenesis of AD. Here, we evaluated the existence of an additional layer of CDK5R1 expression regulation provided by lncRNAs. In particular, we focused on three lncRNAs potentially regulating CDK5R1 expression levels, based on existing data: NEAT1, HOTAIR, and MALAT1. We demonstrated that NEAT1 and HOTAIR negatively regulate CDK5R1 mRNA levels, while MALAT1 has a positive effect. We also showed that all three lncRNAs positively control miR-15/107 family of miRNAs. Moreover, we evaluated the expression of NEAT1, HOTAIR, and MALAT1 in AD and control brain tissues. Interestingly, NEAT1 displayed increased expression levels in temporal cortex and hippocampus of AD patients. Interestingly, we observed a strong positive correlation between CDK5R1 and NEAT1 expression levels in brain tissues, suggesting a possible neuroprotective role of NEAT1 in AD to compensate for increased CDK5R1 levels. Overall, our work provides evidence of another level of CDK5R1 expression regulation mediated by lncRNAs and points to NEAT1 as a biomarker, as well as a potential pharmacological target for AD therapy.

Keywords: Alzheimer’s disease; CDK5R1; HOTAIR; MALAT1; NEAT1; lncRNAs; miR-15/107.


Conflict of interest statement

The authors declare no conflict of interest.

Figures

Figure 1
Figure 1
Effect of NEAT1, HOTAIR, and MALAT1 silencing on CDK5R1 mRNA levels. (A) NEAT1, HOTAIR, and MALAT1 levels 24 h after transfection with specific ASOs. The levels of each lncRNA were reduced by at least 60%, compared to a control ASO (NC)-transfected cells. (B) Increased CDK5R1 transcript levels were observed after NEAT1 and HOTAIR silencing, compared to the normal control. On the contrary, CDK5R1 mRNA levels were significantly decreased after MALAT1 silencing. n = 5, mean ± s.d., * p < 0.05, ** p < 0.01, Student’s t-test.
Figure 2
Figure 2
Effect of NEAT1, HOTAIR, and MALAT1 silencing on miR-15/107 levels. Decreased levels of all miR-15/107 miRNAs were detected after the knock-down of the three lncRNAs. n = 5, mean ± s.d., * p < 0.05, ** p < 0.005, Student’s t-test.
Figure 3
Figure 3
Effect of MALAT1 silencing on EGR1 mRNA levels. EGR1 mRNA levels were significantly decreased after MALAT1 silencing, compared to the normal control (NC). n = 3, mean ± s.d., ** p < 0.005, Student’s t-test.
Figure 4
Figure 4
Comparison between the levels of NEAT1 expression in AD and control brain tissues. (A) Dot-Box-plots of the levels of NEAT1 expression in three different brain areas (temporal cortex, hippocampus, and cerebellum) of AD patients (n = 10) and controls (n = 8–11). Dark horizontal lines represent the median, with the box representing the 25th and 75th percentiles, the whiskers the 5th and 95th percentiles. The average of control values was set to 1 and all values were calculated relatively. NEAT1 levels are significantly upregulated in temporal cortex and hippocampus and downregulated in cerebellum of AD patients, compared to control individuals. (B) Higher NEAT1 expression levels were observed in temporal cortex and hippocampus, compared to cerebellum, in AD patients, but not in control individuals. * p < 0.05, ** p < 0.01, Student’s t-test.
Figure 5
Figure 5
Comparison between the levels of MALAT1 expression in AD and control brain tissues. (A) Dot-Box-plots of the levels of MALAT1 expression in three different brain areas (temporal cortex, hippocampus, and cerebellum) of AD patients (n = 10) and controls (n = 8–11). Dark horizontal lines represent the median, with the box representing the 25th and 75th percentiles, the whiskers the 5th and 95th percentiles. The average of control values was set to 1 and all values were calculated relatively. We observed no difference in MALAT1 levels between AD patients and control individuals in any analyzed tissues. (B) Higher MALAT1 expression levels were observed in cerebellum, compared to temporal cortex and hippocampus, in both AD patients and controls individuals. ** p < 0.01, Student’s t-test.
Figure 6
Figure 6
Correlation analysis between NEAT1 and CDK5R1 expression in temporal cortex, hippocampus and cerebellum samples of AD patients (blue diamonds) and controls (red diamonds). r = Pearson's correlation coefficient, solid line = linear regression line of AD patients, dashed line = linear regression line of normal controls (NC).
Figure 7
Figure 7
Correlation analysis between miR-103, miR-107, miR-15a, miR-15b, miR-16, and miR-195 and NEAT1 expression in temporal cortex, hippocampus, and cerebellum samples of AD patients (blue diamonds) and controls (red diamonds). r = Pearson’s correlation coefficient.

References

    1. Hebert L.E., Weuve J., Scherr P.A., Evans D.A. Alzheimer disease in the United States (2010–2050) estimated using the 2010 census. Neurology. 2013;80:1778–1783. doi: 10.1212/WNL.0b013e31828726f5. - DOI - PMC - PubMed
    1. Serrano-Pozo A., Frosch M.P., Masliah E., Hyman B.T. Neuropathological alterations in Alzheimer disease. Cold Spring Harb. Perspect. Med. 2011;1:a006189. doi: 10.1101/cshperspect.a006189. - DOI - PMC - PubMed
    1. Desler C., Lillenes M.S., Tønjum T., Rasmussen L.J. The role of mitochondrial dysfunction in the progression of Alzheimer’s disease. Curr. Med. Chem. 2017;24 doi: 10.2174/0929867324666170616110111. - DOI - PMC - PubMed
    1. Jiang T., Chang R.C., Rosenmann H., Yu J.T. Advances in Alzheimer’s disease: From bench to bedside. Biomed. Res. Int. 2015;2015:202676. doi: 10.1155/2015/202676. - DOI - PMC - PubMed
    1. Wang J.Z., Grundke-Iqbal I., Iqbal K. Kinases and phosphatases and tau sites involved in Alzheimer neurofibrillary degeneration. Eur. J. Neurosci. 2007;25:59–68. doi: 10.1111/j.1460-9568.2006.05226.x. - DOI - PMC - PubMed

Substances