Review
. 2018 Jun 26:12:389.
doi: 10.3389/fnins.2018.00389. eCollection 2018.

Image-Based Profiling of Synaptic Connectivity in Primary Neuronal Cell Culture

Affiliations
Review

Image-Based Profiling of Synaptic Connectivity in Primary Neuronal Cell Culture

Peter Verstraelen et al. Front Neurosci. .

Abstract

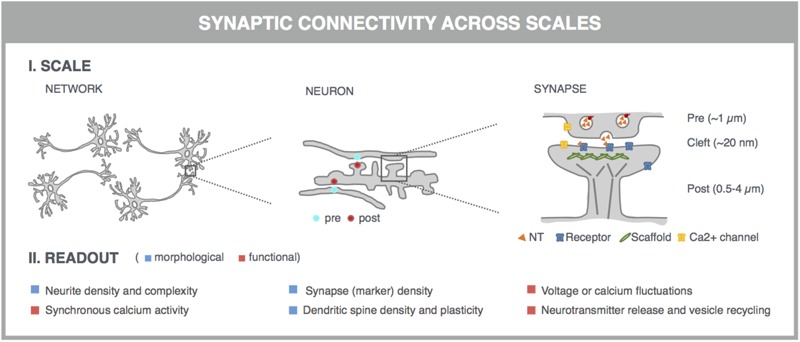
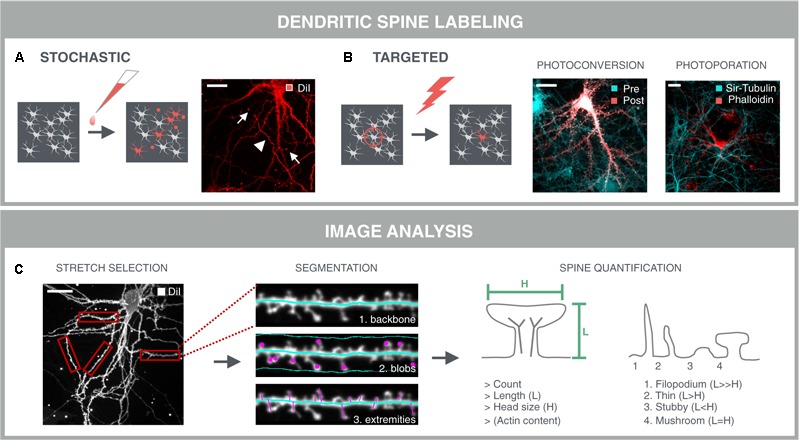
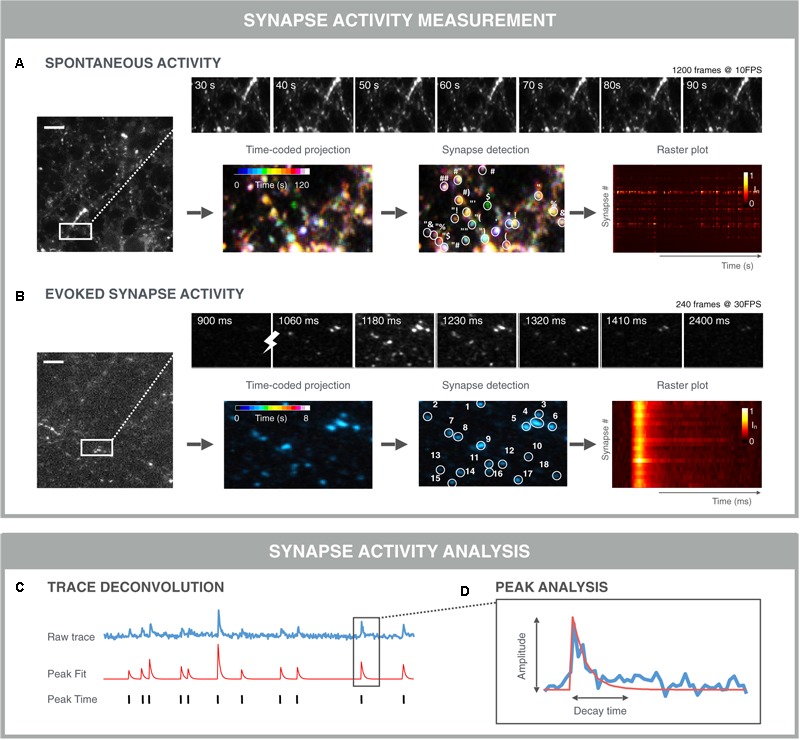
Neurological disorders display a broad spectrum of clinical manifestations. Yet, at the cellular level, virtually all these diseases converge into a common phenotype of dysregulated synaptic connectivity. In dementia, synapse dysfunction precedes neurodegeneration and cognitive impairment by several years, making the synapse a crucial entry point for the development of diagnostic and therapeutic strategies. Whereas high-resolution imaging and biochemical fractionations yield detailed insight into the molecular composition of the synapse, standardized assays are required to quickly gauge synaptic connectivity across large populations of cells under a variety of experimental conditions. Such screening capabilities have now become widely accessible with the advent of high-throughput, high-content microscopy. In this review, we discuss how microscopy-based approaches can be used to extract quantitative information about synaptic connectivity in primary neurons with deep coverage. We elaborate on microscopic readouts that may serve as a proxy for morphofunctional connectivity and we critically analyze their merits and limitations. Finally, we allude to the potential of alternative culture paradigms and integrative approaches to enable comprehensive profiling of synaptic connectivity.

Keywords: dendritic spine; fluorescent labeling; high-content screening; image analysis; morphofunctional connectivity; primary neuronal culture; synapse.


Figures

FIGURE 1
FIGURE 1
Microscopy-based readouts for synaptic connectivity at different scales. Synaptic connectivity can be investigated on different scales (network, individual neurons and synapses), which come with characteristic morphological and functional readouts. Clues into synaptic connectivity are already inferred from the general network architecture. Neurite density and complexity (e.g., length and branching points) inform about the general health and connectivity of the neuronal network. The synchronicity of spontaneous neuronal activity, measured across neuronal cell bodies, is used as a readout for functional connectivity. The number of synaptic connections serves as a direct readout of neuronal connectivity and can be quantified after fluorescent labeling of synapse marker proteins such as presynaptic vesicle proteins (e.g., synaptophysin) and postsynaptic neurotransmitter (NT) receptors (e.g., AMPA-R) or scaffold proteins (e.g., PSD-95). This assay can be refined by measuring the colocalization of pre- and postsynaptic markers, which can be excitatory or inhibitory. Excitatory synapses are often localized on dendritic spines, actin-rich protrusions from the dendritic shaft whose density and morphology correlate with synaptic strength. Synaptic transmission can be directly visualized in dynamic assays, using specific fluorescent reporters. At the presynaptic side, synaptic vesicle acidification, calcium influx, or membrane recycling can be probed. Release of neurotransmitters such as glutamate (orange triangles) into the synaptic cleft can be visualized, as well as the postsynaptic depolarization that they induce via calcium or voltage imaging. Some of these markers can be targeted to pre- or postsynaptic compartments by fusing them to the aforementioned synaptic markers.
FIGURE 2
FIGURE 2
General principles for high-content screening with primary neuronal cultures. Although the sample preparation is more tedious and variable, primary cultures offer a level of synaptic connectivity that cannot be matched by immortal cell lines. The following steps are typically followed in synapse, spine or functional screens. (A) One dam is regarded as one biological replicate, and embryos, typically E17-18, of the same dam are pooled to obtain sufficiently large suspensions of cortical or hippocampal cells. Cells are seeded into multiwell plates of which the outer wells are filled with sterile medium, and the well replicates scrambled to avoid edge effects. (B) In high-content experiments, neuronal cultures are dosed and fluorescently labeled using an automated liquid handling system (genetic labeling is usually done before perturbation whereas immunostaining after). Images are captured on an automated microscope which is equipped to allow rapid acquisition, e.g., by employing multiple sensitive cameras with large fields-of-view for parallelization of fluorescence channels. Since primary neuronal cultures can show a heterogeneous distribution, multiple fields are captured per well. These fields are analyzed with high-content image analysis scripts and the resulting data is presented per well. Finally, statistics, data mining and visualization aid the interpretation, after which a secondary screen or low-throughput confirmation experiments can be conceived. This figure was adapted from Verstraelen et al. (2017) with permission.
FIGURE 3
FIGURE 3
Synapse marker quantification as morphological readout for connectivity. (A) Immunocytochemical labeling (ICC) of pre- and postsynaptic markers in primary hippocampal neurons to label all [synaptophysin (Syph)], excitatory (vGLUT, PSD-95, and AMPA-R) or inhibitory (vGAT, gephyrin) synapse compartments. Some antibodies give rise to non-specific staining in neuronal cell bodies and astrocytes (PSD-95; arrows) or in neuronal nuclei (gephyrin; arrowhead), underlining the need for thorough antibody validation. Scale bar: 20 μm. (B) Genetic labeling of synaptic markers allows for temporal follow-up. Constitutive overexpression of PSD-95-GFP and synaptophysin-mKate2 (Syph-mKate2) gives rise to overexpression artifacts such as overfilling of the neuronal soma and dendrites by PSD-95-GFP, and a high number of synaptophysin-mKate2 puncta that do not colocalize with ICC of another presynaptic protein, synapsin (Syn). Targeting of GFP toward endogenous PSD-95 using FingR technology (Gross et al., 2013) results in good colocalization of PSD-95-FingR and ICC, making this approach more attractive for synapse screening than constitutive overexpression of fusion constructs. Scale bars: 20 μm. (C) MAP2-stained neurites can be analyzed for area fraction, but also skeletonized to determine the length and number of branching points. Scale bar: 50 μm. (D) Synaptic marker spots are segmented within the boundaries of the neurite mask to calculate synaptic marker density. An overlay of the raw image and the detected spots shows accurate spot detection. Scale bar: 20 μm. (E) To avoid detection of immature synapses, extrasynaptic and a specific staining, the apparent colocalization of pre- and postsynaptic markers can be evaluated as a proxy for mature synapses. Pre- and postsynaptic images of corresponding Z-planes are considered to avoid overdetection of mature synapses from different axial positions. After segmentation, pre- and postsynapse masks are combined and analyzed for colocalization, yielding parameters such as % overlap (O) or synapse density. A mature synapse can be defined by an arbitrary cut-off, e.g., 30% overlap between post/pre or pre/post. Alternatively, an intensity-based Pearson coefficient (P) can be calculated for the pre- and postsynaptic images. This method is independent of spot segmentation. For visual representation, the ‘product of the differences from the mean’ (PDM) is shown (H, high colocalization; L, low). Scale bar: 20 μm.
FIGURE 4
FIGURE 4
Validation experiments for synapse screening. (A) Validation of antibodies via western blot. A Synaptophysin (Syph) antibody shows the expected single band at 38 kDa. Conversely, a PSD-95 antibody shows, next to a bright band at the expected height, additional bands, indicative of non-specific binding (cort/hipp: 14 DIV mouse cortical or hippocampal primary neurons). (B) Validation of the spot detection algorithm using simulated images with increasing background (BG) and decreasing signal-to-noise ratio (SNR). Besides background and SNR levels, spot size and density determine the lower detection limit. (C) Spot detection algorithms can also be validated by comparison with a ground truth, obtained by manual spot counting in (regions of) real images. The binary images show the detection of spots after manual (M) or automatic (A) detection. Manual spot quantifications may differ (here lower) with those from the spot counting algorithm, but if counts change proportionally in low- and high-density regions, relative comparisons are still possible. Scale bar: 5 μm. (D) Validation of colocalization analysis for mature synapses by different marker combinations. The lower detection limit can be pinpointed using an inhibitory presynaptic (e.g., vGAT) and excitatory postsynaptic (e.g., AMPA-R) marker, which only colocalize by coincidence. The upper limit can be determined using two different primary antibodies for the same marker (e.g., synaptophysin). The combination of a pan-presynaptic marker (e.g., synaptophysin) and a specific postsynaptic marker (e.g., AMPA-R) should in turn yield an intermediate level of colocalizing spots, depending on the ratio of excitatory/inhibitory synapses. Scale bar: 5 μm. (E) Analysis of cultures at different days in vitro (DIV) can be used as a positive control for increasing connectivity, exemplified by an increasing density of pre- and postsynaptic spots. The number of mature synapses also increases, but is markedly lower compared to the pre- and postsynaptic markers alone. Scale bar: 10 μm.
FIGURE 5
FIGURE 5
Dendritic spine analysis. Spine analysis requires sparse labeling of neurons and their spines in dense neuronal networks. (A) The gold standard method for spine labeling in culture is bath application of the lipophilic dye DiI. However, this method is not optimal for high-content screening due to the stochastic labeling of nearby neurites (arrowheads) and artifacts such as uneven dye loading and staining debris (arrows) which complicate subsequent image analysis. (B) Targeted labeling followed by imaging at the same locations drastically reduces the image acquisition time, as well as data storage and –analysis. Targeted labeling can be achieved with expression of a photoconvertible protein (mEos-LifeAct; Pre) that can be selectively converted (Post) in sufficiently separated neurons in the network. Alternatively, fast targeted labeling can be achieved by gold-nanoparticle (AuNP)-sensitized photoporation (Xiong et al., 2017, 2018). A single nanosecond light pulse heats up membrane-bound AuNP and thereby induces mechanical perturbation of the membrane, allowing otherwise impermeable AlexaFluor488-phalloidin to enter the neuron. The network is counter-stained with the cell-permeable probe Sir-Tubulin. (C) A first step for spine analysis involves the selection of analyzable dendrite stretches. This was done manually in this example and represents a current challenge for automated spine analysis. Segmentation of the dendritic backbone by skeletonization is either followed by blob detection in the vicinity of the dendrite, or by detection of the perpendicular extremities, i.e., spines, or by the combination of both methods. Several parameters are extracted such as spine count, length and diameter of the spine head. In case of mEos-LifeAct or phalloidin labeling, the actin content can be determined as well. Crude predictions of spine classes can be made based on their length and head size.
FIGURE 6
FIGURE 6
Examples of functional synapse analysis. (A) Time-averaged intensity of a 120 s SyGCaMP6f fluorescence microscopy recording of spontaneous presynaptic activity as measured. Top: montage of selected time points showing fluctuations in individual synapses. Bottom: color-coded time projection with dissimilar colored synapses indicating non-simultaneous activity; synapse detection is based on spatial and/or temporal features; the raster plot shows the normalized intensity of detected synapses over time. Both synchronous and asynchronous signals are visible between traces of different synapses. (B) Time-averaged intensity of 8 s Synaptophysin-GCaMP6f (SyGCaMP6f) fluorescence recording of evoked responses measured at the presynaptic terminals. The stimulation was 1 AP. Top: montage of selected time points showing synchronous responses to stimulation (lightning bolt). Bottom: Time-coded projection: due to the stimulation and thereby synchronous activation, synapses are similarly colored; synapse detection algorithms can exploit the stimulus properties in addition to the spatio-temporal synapse response features, which can result in more robust segmentation. Downstream signal analysis involves (C) trace deconvolution and (D) peak analysis. Typically, an exponential curve is fitted with amplitude and decay time.

References

    1. Adler J., Parmryd I. (2010). Quantifying colocalization by correlation: the Pearson correlation coefficient is superior to the Mander’s overlap coefficient. Cytometry A 77 733–742. 10.1002/cyto.a.20896 - DOI - PubMed
    1. Adrian M., Kusters R., Wierenga C. J., Storm C., Hoogenraad C. C., Kapitein L. C. (2014). Barriers in the brain: resolving dendritic spine morphology and compartmentalization. Front. Neuroanat. 8:142. 10.3389/fnana.2014.00142 - DOI - PMC - PubMed
    1. Akram M. A., Nanda S., Maraver P., Armananzas R., Ascoli G. A. (2018). An open repository for single-cell reconstructions of the brain forest. Sci. Data 5:180006. 10.1038/sdata.2018.6 - DOI - PMC - PubMed
    1. Alberto P.-A., Alfonso A. (2013). Astrocyte-neuron interaction at tripartite synapses. Curr. Drug Targets 14 1220–1224. 10.2174/13894501113149990203 - DOI - PubMed
    1. Atze T. D., Liliane T., Ben B. (2016). Tet-On systems for doxycycline-inducible gene expression. Curr. Gene Ther. 16 156–167. 10.2174/1566523216666160524144041 - DOI - PMC - PubMed