

Stretch, Injury and Inflammation Markers Evaluation to Predict Clinical Outcomes After Implantable Cardioverter Defibrillator Therapy in Heart Failure Patients With Metabolic Syndrome
- PMID: 29997521
- PMCID: PMC6028698
- DOI: 10.3389/fphys.2018.00758
Stretch, Injury and Inflammation Markers Evaluation to Predict Clinical Outcomes After Implantable Cardioverter Defibrillator Therapy in Heart Failure Patients With Metabolic Syndrome
Abstract
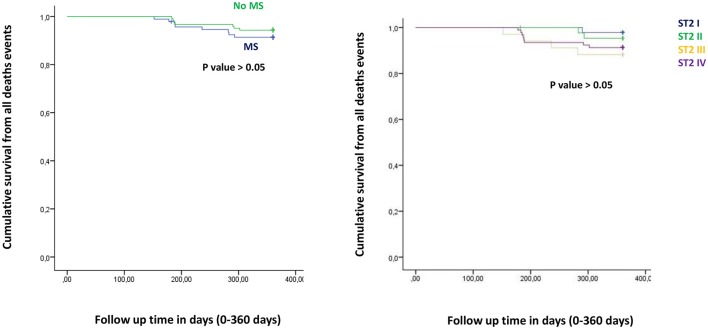
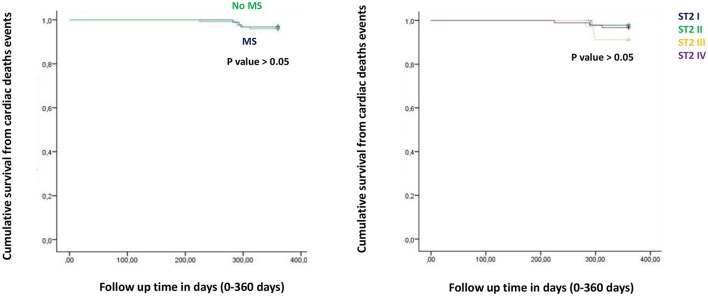
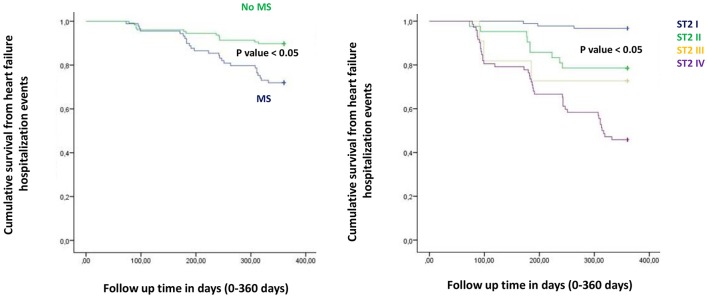
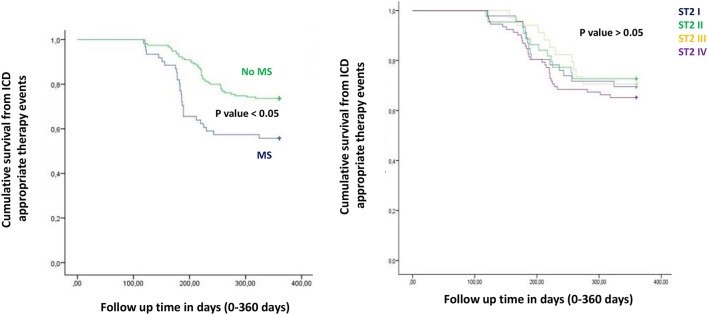
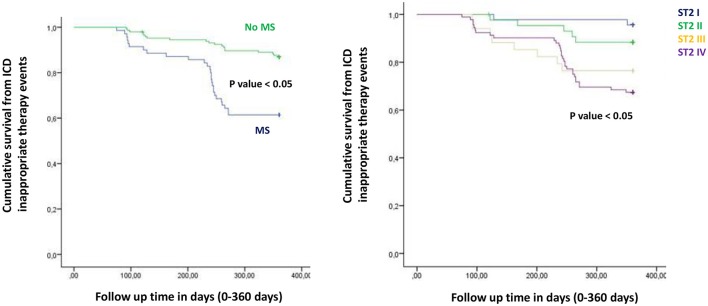
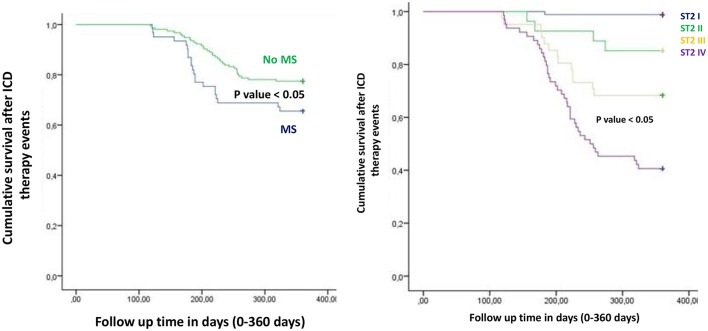
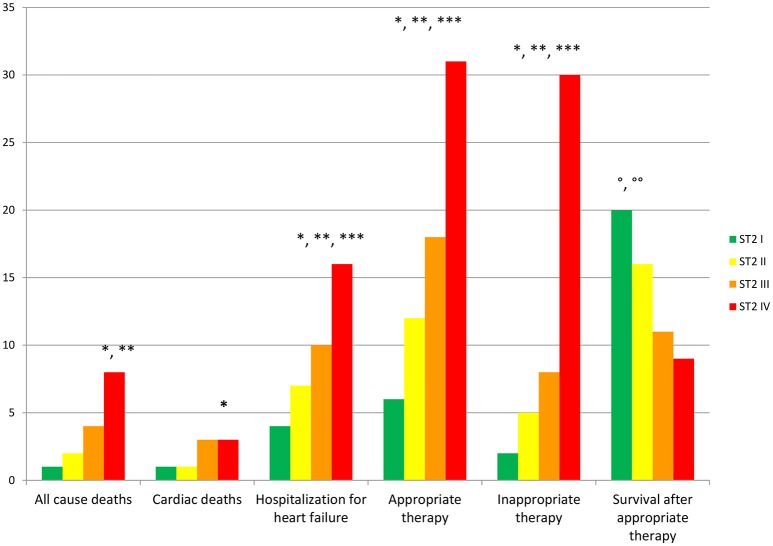
Background: Internal cardioverter defibrillator (ICD) therapy reduced all-cause mortality. Conversely, few studies reported that ICDs' shocks may reduce survival. Recently authors suggested that, multiple inflammatory and molecular pathways were related to worse prognosis in metabolic syndrome (MS) patients treated by ICDs. Therefore, it may be relevant to find new biomarkers to predict ICDs' shock and worse prognosis in treated patients. Methods: In 99 MS vs. 107 no MS patients treated by ICD for primary prevention, we evaluated all-cause mortality, cardiac deaths, hospitalization for heart failure, appropriate and inappropriate therapy, and survival after appropriate ICD therapy. Results: MS vs. no MS patients had higher levels of failing heart stress biomarkers. The highest values of ST2 were related to worse prognosis. Patients who had better survival after appropriate ICD therapy were those associated with lowest ST2 values. At multivariate Cox regression analysis, C reactive protein (CRP) (0.110 [0.027-0.446], p-value 0.002), troponine I (TnI) protein (0.010 [0.001-0.051], p-value 0.010), and B type natriuretic peptide (BNP) (1.151 [1.010-1.510], p-value 0.001), predicted all cause of deaths. BNP predicted cardiac deaths (1.010 [1.001-1.206], p-value 0.033). MS, and BNP predicted hospitalization for heart failure events (2.902 [1.345-4.795], p-value 0.001; 1.005 [1.000-1.016], p-value 0.007). ST2 predicted appropriate therapy (1.012 [1.007-1.260], p-value 0.001), as BNP (1.005 [1.001-1.160], p-value 0.028), LVEF (1.902 [1.857-1.950], p-value 0.001), and CRP (1.833 [1.878-1.993], p-value 0.028). ST2, and BNP predicted survival after ICD appropriate therapy (4.297 [1.985-9.302], p-value 0.001; 1.210 [1.072-1.685], p-value 0.024). Conclusions: ST2 values may differentiate MS patients with a higher risk of ICDs' therapy, and worse prognosis. Therefore, ST2 protein may be used as valid monitoring biomarker, and as a predictive biomarker in failing heart ICDs' patients affected by MS.
Keywords: ICDs' shocks; ST2 protein; heart failure; hospitalization; internal cardioverter defibrillator.
Figures
References
-
- Alpert J. S., Thygesen K., Antman E., Bassand J. P. (2000). Myocardial infarction redefined–a consensus document of The Joint European society of cardiology/American college of cardiology committee for the redefinition of myocardial infarction. J. Am. Coll. Cardiol. 36, 959–969. 10.1016/S0735-1097(00)00804-4 - DOI - PubMed
LinkOut - more resources
Full Text Sources
Other Literature Sources
Research Materials
Miscellaneous