. 2018 Jun 27:9:1453.
doi: 10.3389/fimmu.2018.01453. eCollection 2018.

Single-Cell Approach to Influenza-Specific CD8+ T Cell Receptor Repertoires Across Different Age Groups, Tissues, and Following Influenza Virus Infection

Affiliations

Single-Cell Approach to Influenza-Specific CD8+ T Cell Receptor Repertoires Across Different Age Groups, Tissues, and Following Influenza Virus Infection

Sneha Sant et al. Front Immunol. .

Abstract

CD8+ T cells recognizing antigenic peptides derived from conserved internal viral proteins confer broad protection against distinct influenza viruses. As memory CD8+ T cells change throughout the human lifetime and across tissue compartments, we investigated how T cell receptor (TCR) composition and diversity relate to memory CD8+ T cells across anatomical sites and immunological phases of human life. We used ex vivo peptide-HLA tetramer magnetic enrichment, single-cell multiplex RT-PCR for both the TCR-alpha (TCRα) and TCR-beta (TCRβ) chains, and new TCRdist and grouping of lymphocyte interactions by paratope hotspots (GLIPH) algorithms to compare TCRs directed against the most prominent human influenza epitope, HLA-A*02:01-M158-66 (A2+M158). We dissected memory TCR repertoires directed toward A2+M158 CD8+ T cells within human tissues and compared them to human peripheral blood of young and elderly adults. Furthermore, we compared these memory CD8+ T cell repertoires to A2+M158 CD8+ TCRs during acute influenza disease in patients hospitalized with avian A/H7N9 virus. Our study provides the first ex vivo comparative analysis of paired antigen-specific TCR-α/β clonotypes across different tissues and peripheral blood across different age groups. We show that human A2+M158 CD8+ T cells can be readily detected in human lungs, spleens, and lymph nodes, and that tissue A2+M158 TCRαβ repertoires reflect A2+M158 TCRαβ clonotypes derived from peripheral blood in healthy adults and influenza-infected patients. A2+M158 TCRαβ repertoires displayed distinct features only in elderly adults, with large private TCRαβ clonotypes replacing the prominent and public TRBV19/TRAV27 TCRs. Our study provides novel findings on influenza-specific TCRαβ repertoires within human tissues, raises the question of how we can prevent the loss of optimal TCRαβ signatures with aging, and provides important insights into the rational design of T cell-mediated vaccines and immunotherapies.

Keywords: CD8+ T cells; T cell receptor repertoire; aging; human T lymphocytes; influenza A virus; tissues.


Figures
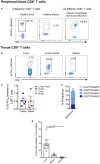
Figure 1
Figure 1
A2+M158-specific CD8+ T cells are prominent across age, tissue, and influenza infection. Representative FACS plots of A2+M158-specific memory CD8+ T cells in the blood of [(A) i] healthy adult and an elderly donor, [(A) ii] in the blood of influenza virus-infected hospitalized patient, and (B) in the lung, spleen, and lymph nodes (LNs) of deceased organ donors. Samples were enriched via tetramer-associated magnetic enrichment (TAME), except for the lung which was directly stained with tetramer. Frequencies of cells gated as viable CD14CD19CD3+CD8+ A2+M158-tetramer-positive events are shown. (C) Frequencies of A2/M158+CD8+ T cells in tissues (LNs n = 1 donor, spleen n = 4 donors, and lung n = 1 donor) and blood (n = 3 donors) for A2/M158+CD8+ T cells are shown. Except for the lung, which did not undergo TAME enrichment, A2+M158-tetramer+CD8+ T cell frequencies of total CD8+ T cells were calculated based on the total CD8+ T cell population. No statistical differences across distinct anatomical compartments were found. (D) CD45RA/CD27 memory profiles of A2+M158-specific CD8+ T cells within human tissues are shown. (E) Graph depicts the proportion of CD8+ TRMs (CD103+CD69+) among the total memory CD8+ T cell pool in the lung, spleen, and blood of donors (41). Dots represent individual donors (n = 3–10 donors, one-way ANOVA, Sidak’s multiple comparison).
Figure 2
Figure 2
Tissue A2+M158-specific CD8+ T cell receptors (TCRs) display public clonotype signatures. (A) Pie-chart distributions and (B) table of paired TCRα/β clonotype repertoires of A2+M158-specific memory CD8+ T cells in human tissues. TRB-TRA clonotypes were grouped according to the presence of “public” [blue pie-slice in (A) and shaded in (B)] or public-like motifs (other colors). TRBV19 singletons are in dark gray and non-TRBV19 singletons in light gray. Singletons are defined as TCRβ chain clonotypes with variable TCRα chains. Matched samples from the same donor #583 are indicated.
Figure 3
Figure 3
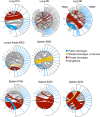
Clonotype frequency of tissue A2+M158-specific CD8+ T cell receptors (TCRs). Circos plots showing the distribution of TRA-TRB paired clonotypes across tissues (lung, spleen, and lymph node). Each segment defines individual clonotypes and width of segment correlates to frequency of the clonotype. Public clonotype is in blue segments, shared clonotypes between donors are in yellow, private or non-shared clonotypes observed more than once are in maroon, or only once as singletons in gray. For clonotypes having TRBV19/TRAV27 gene usage, the labels have been highlighted in blue. Circos plots were generated using Circos package (51).
Figure 4
Figure 4
Maintenance of clonal diversity across age group and tissue compartment. Gene segment usage and pairing landscapes are shown for each group. Each clonotype is assigned the same vertical length irrespective of clonotype size. Each vertical stack reflects the V and J gene segment usage and pairing is shown by curved connecting lines. Genes are ranked in color by the frequency distribution with red being the highest frequency, followed by green, dark blue, aqua, magenta, black, and thereafter. Enrichment or depletion of gene usage is indicated by up or down arrows, respectively, where one arrowhead correlates to a two-fold increase or decrease.
Figure 5
Figure 5
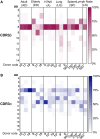
Conserved complementarity-determining region 3 (CDR3)β and diverse CDR3α amino acid (aa) length usage. Distribution of (A) CDR3β and (B) CDRα aa length usage across adult, elderly, lung, spleen, lymph node (LN) (n = 1), and H7N9 hospitalized patients (all groups have n = 3 unless specified). CDR3 lengths for donors marked by “*” were generated from this study. Data from unmarked donors were taken from our previous studies as described [adult (36), elderly (40), H7N9 hospitalized patients (7), and lung (41)]. Heatmaps were generated using Matplotlib package (50).
Figure 6
Figure 6
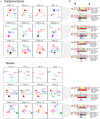
Private clonotypes dominate elderly T cell receptors (TCRs), while public TCRs are represented in blood and across different tissues. (A) 2D kernel principal component analysis (kPCA) projections for healthy adult, healthy elderly, elderly H7N9 hospitalized patients, lung, lymph node (LN) (n = 1), and spleen (all groups have n = 3 unless specified). Size of the clone correlates with clonotype size and color correlates to gene usage. Most prevalent gene usages are mentioned within the plots matching with clonotype color. Each row represents group and each column is the same 2D kPCA projection of the four gene segment usage (Vα, Jα, Vβ, and Jβ). (B) Using TCRlogo in TCRdist algorithm, top-scoring complementarity-determining region 3 (CDR3)β and CDR3α motifs are shown for each group, except for LN. V and J gene usage are indicated left and right of motifs, respectively, and bottom panel highlights the motif enriched by calculating against a background dataset of naïve non-A2+M158-specific CD8+ TCRs.
Figure 7
Figure 7
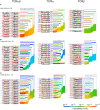
Hierarchal clustering of T cell receptors (TCRs) highlights diversity of aging A2+M158-specific CD8+ TCRs: TCRαβ, TCRα, and TCRβ clustering along with corresponding TCRlogos for (A) adult, (B) elderly adult, (C) elderly H7N9 patients, (D) lungs, (E) lymph nodes, and (F) spleen. Number on the branches and next to TCRlogos depicts number of TCRs contributing to the cluster. Color of the branches indicates the TCR probability generation scores.
Figure 7
Figure 7
Hierarchal clustering of T cell receptors (TCRs) highlights diversity of aging A2+M158-specific CD8+ TCRs: TCRαβ, TCRα, and TCRβ clustering along with corresponding TCRlogos for (A) adult, (B) elderly adult, (C) elderly H7N9 patients, (D) lungs, (E) lymph nodes, and (F) spleen. Number on the branches and next to TCRlogos depicts number of TCRs contributing to the cluster. Color of the branches indicates the TCR probability generation scores.
Figure 8
Figure 8
A2+M158-specific complementarity-determining region 3 (CDR3)βs forms a dense cluster comprising public T cell receptors (TCRs). TCR network organization of CDR3β from A2+M158-specific CD8+ TCR repertoire from adult, elderly, elderly H7N9 patients, spleen, lymph node, and lung to study the level of sequence similarity within and between donors. Black lines are global interactions (a pair of TCRs that share the same length CDR3 and differ by less than a certain number of amino acid) and the gray lines are local interactions. Node (dot) represent unique clonotype, edge is the global (black line) or local (gray line) interactions between the nodes. Colors of the node indicate the group to which the node belongs as shown in the legend.
Figure 9
Figure 9
Modeling the dynamic changes of A2+M158-specific CD8+ T cell receptor (TCR) repertoires with age, tissue location, and during influenza infection. A conceptual figure summarizing evolution of A2+M158+ CD8+ TCR repertoires in young adults (with large public clonotypes depicted in blue), elderly adults (displaying loss of public clonotypes and presence of large private clonotypes in green and red), tissues (with public clonotypes along with diverse set of TCRs), and influenza-infected elderly adults (displaying diverse TRBV19s and public clonotypes).

Similar articles

Cited by

References

    1. Koutsakos M, Wheatley AK, Loh L, Clemens EB, Sant S, Nussing S, et al. Circulating TFH cells, serological memory, and tissue compartmentalization shape human influenza-specific B cell immunity. Sci Transl Med (2018) 10(428).10.1126/scitranslmed.aan8405 - DOI - PubMed
    1. Clemens EB, van de Sandt C, Wong SS, Wakim LM, Valkenburg SA. Harnessing the power of T cells: the promising hope for a universal influenza vaccine. Vaccines (Basel) (2018) 6(2).10.3390/vaccines6020018 - DOI - PMC - PubMed
    1. Yewdell JW, Bennink JR, Smith GL, Moss B. Influenza A virus nucleoprotein is a major target antigen for cross-reactive anti-influenza A virus cytotoxic T lymphocytes. Proc Natl Acad Sci U S A (1985) 82(6):1785–9.10.1073/pnas.82.6.1785 - DOI - PMC - PubMed
    1. Braciale TJ. Immunologic recognition of influenza virus-infected cells. II. Expression of influenza A matrix protein on the infected cell surface and its role in recognition by cross-reactive cytotoxic T cells. J Exp Med (1977) 146(3):673–89.10.1084/jem.146.3.673 - DOI - PMC - PubMed
    1. Nguyen Thi. H. O, Koutsakos M, Grant EJ, Doherty PC, Kedzierska K. Towards future T cell-mediated influenza vaccines. Infect Dis Transl Med (2016) 2(1):20–9.10.11979/idtm.201601004 - DOI