. 2016 May 1;7(5):3172-3180.
doi: 10.1039/c5sc04631a. Epub 2016 Feb 3.

High-resolution measurement of long-range distances in RNA: pulse EPR spectroscopy with TEMPO-labeled nucleotides

Affiliations

High-resolution measurement of long-range distances in RNA: pulse EPR spectroscopy with TEMPO-labeled nucleotides

Karin Halbmair et al. Chem Sci. .

Abstract

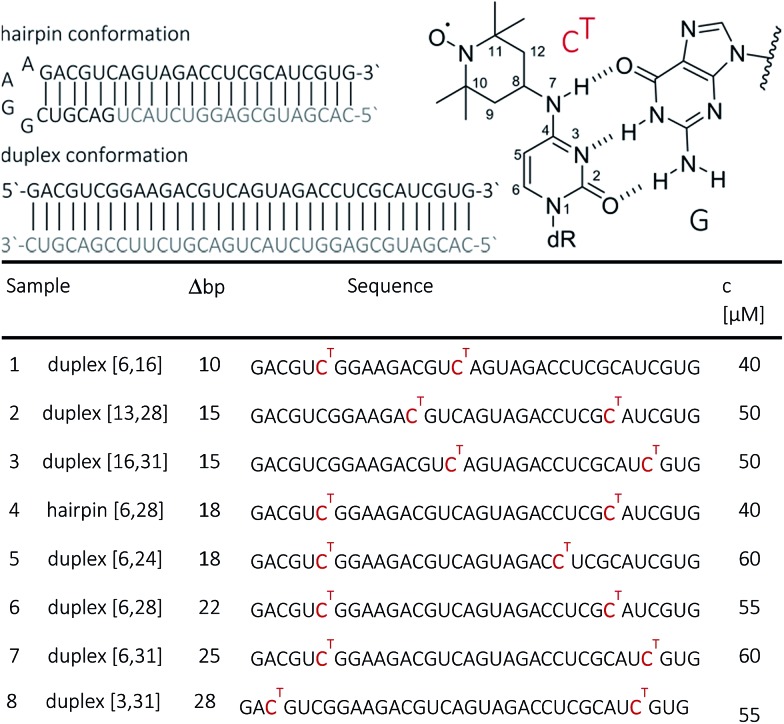
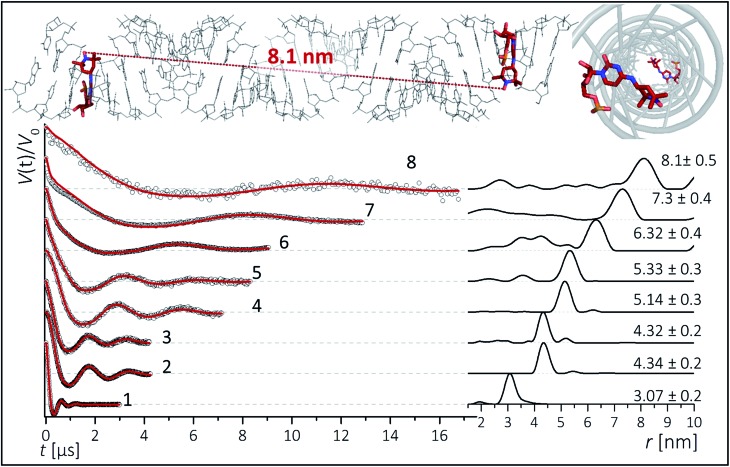
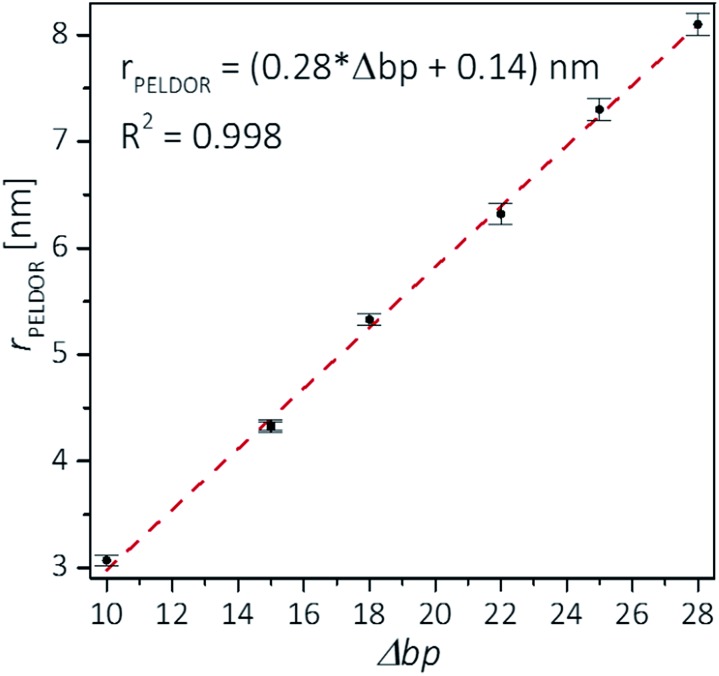
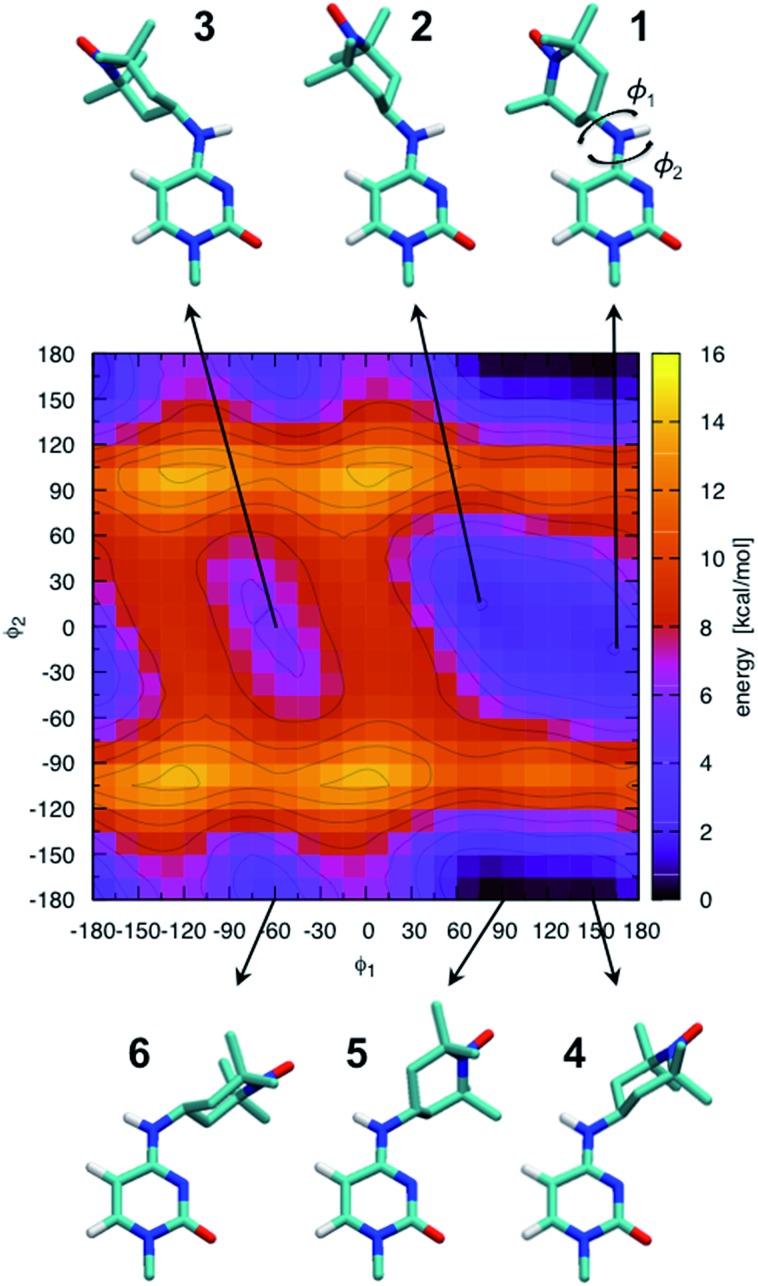
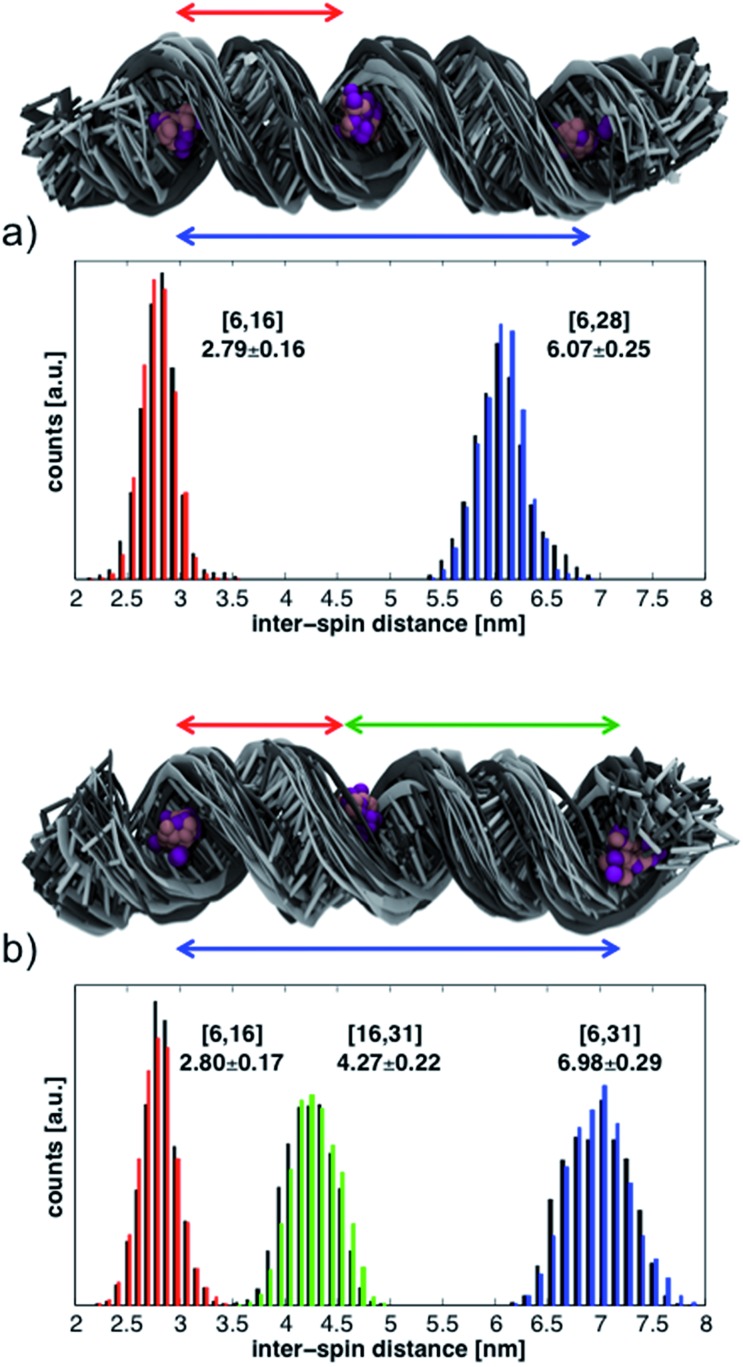
Structural information at atomic resolution of biomolecular assemblies, such as RNA and RNA protein complexes, is fundamental to comprehend biological function. Modern spectroscopic methods offer exceptional opportunities in this direction. Here we present the capability of pulse EPR to report high-resolution long-range distances in RNAs by means of a recently developed spin labeled nucleotide, which carries the TEMPO group directly attached to the nucleobase and preserves Watson-Crick base-pairing. In a representative RNA duplex with spin-label separations up to 28 base pairs (≈8 nm) we demonstrate that the label allows for a model-free conversion of inter-spin distances into base-pair separation (Δbp) if broad-band pulse excitation at Q band frequencies (34 GHz) is applied. The observed distance distribution increases from ±0.2 nm for Δbp = 10 to only ±0.5 nm for Δbp = 28, consistent with only small deviations from the "ideal" A-form RNA structure. Molecular dynamics (MD) simulations conducted at 20 °C show restricted conformational freedom of the label. MD-generated structural deviations from an "ideal" A-RNA geometry help disentangle the contributions of local flexibility of the label and its neighboring nucleobases and global deformations of the RNA double helix to the experimental distance distributions. The study demonstrates that our simple but strategic spin labeling procedure can access detailed structural information on RNAs at atomic resolution over distances that match the size of macromolecular RNA complexes.


Figures

Fig. 1
Fig. 1. Top: Chemical structure of N4-TEMPO-cytidine (CT) spin label illustrating the base pairing with guanine. Bottom: The 34 base pair RNA duplex and hairpin employed in this study. Sequences of the RNA strands with CT marked in red. Sample numbering, number of nucleotides pairs Δbp between the labels as well as sample concentrations for PELDOR/DEER are indicated.
Fig. 2
Fig. 2. Top (a, b): Experimental Q-band nitroxide spectra from [13,28] RNA duplex and simulation illustrating the contributions of the three hyperfine transitions mI = +1; 0; –1. Colored Lorentz lines approximate pump- (red) and detect- (blue) pulse excitation profiles for low -(a) and high-power (b) power setups. Bottom (a, b): Corresponding background corrected PELDOR/DEER traces (dots) and fits (red traces). Distance distributions are shown in insets. Arrow shows artifact due to orientation selection. Artifacts sensitive to background subtraction are marked by asterisks.
Fig. 3
Fig. 3. Background corrected Q-band DEER traces (dots) of the 34 bp RNA duplex and hairpin, samples 1–8. Red lines are fits using Deer Analysis. Distance distributions are shown in inset. Experimental conditions: samples 1–6: Δν = 90 MHz, t(π, pump) = 12 ns (π, detect) = 24 ns; 7: Δν = 90 MHz, t(π, pump) = 16 ns (π, detect) = 24 ns. 8: Δν = –90 MHz, t(π, pump) = 26 ns (π, detect) = 16 ns. Modulation depths are normalized and were between 0.3 and 0.2 for samples 1–7 and 0.1 for sample 8. Upper inset: schematic structure of the 34 bp RNA (standard A-form) constructed with PyMOL and illustrating the orientation of the CT labels toward inside of the duplex (side and top views). Labels inserted with dihedral angles of φ1 = 77° (C4, N7, C8, C9) and φ2 = 11° (C5, C4, N7, C8) (conformation 2, Fig. 5).
Fig. 4
Fig. 4. Experimental distances vs. base pair separation between labeled cytosines for the investigated RNA duplexes. Error bars indicate uncertainty in the peak distance (see text). The correlation coefficient R2 is 0.998. A small value of 0.14 nm is found for an intercept, but it is unknown whether this value is significant as it is close to the estimated distance uncertainty.
Fig. 5
Fig. 5. Ab initio scan of the dihedral (φ1φ2) potential energy surface and conformations of the six local minima. Some hydrogen atoms are not shown for clarity. The energies of the numbered local minima are given in Table S1.
Fig. 6
Fig. 6. Structural ensembles and histograms of the inter-spin distances from the MD simulations of RNA helices labeled at positions (a) 6-16-28 and (b) 6-16-31. Structures and histograms from the first 17 ns are shown in black; those from the last 17 ns are in gray or in color. The N and O atoms of the TEMPO moiety are shown with purple (first 17 ns) and pink (last 17 ns) balls. The reported average distances and their standard deviations (in nm) are calculated from the entire 34 ns simulations.

Similar articles

Cited by

References

    1. Peselis A., Gao A., Serganov A. Biochimie. 2015;117:100–109. - PMC - PubMed
    1. Serganov A., Nudler E. Cell. 2013;152:17–24. - PMC - PubMed
    1. Breaker R. R. Cold Spring Harbor Perspect. Biol. 2012;4:a003566. - PMC - PubMed
    1. Breaker R. R., Joyce G. F. Chem. Biol. 2014;21:1059–1065. - PMC - PubMed
    1. Ha M., Kim N. V. Nat. Rev. Mol. Cell Biol. 2014;15:509–524. - PubMed

LinkOut - more resources