

Phosphorescent soft salt for ratiometric and lifetime imaging of intracellular pH variations
- PMID: 29997827
- PMCID: PMC6006953
- DOI: 10.1039/c5sc04624f
Phosphorescent soft salt for ratiometric and lifetime imaging of intracellular pH variations
Abstract
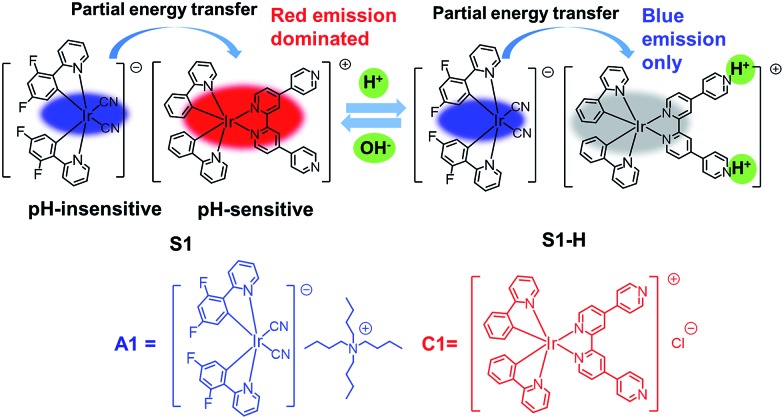
In contrast to traditional short-lived fluorescent probes, long-lived phosphorescent probes based on transition-metal complexes can effectively eliminate unwanted background interference by using time-resolved luminescence imaging techniques, such as photoluminescence lifetime imaging microscopy. Hence, phosphorescent probes have become one of the most attractive candidates for investigating biological events in living systems. However, most of them are based on single emission intensity changes, which might be affected by a variety of intracellular environmental factors. Ratiometric measurement allows simultaneous recording of two separated wavelengths instead of measuring mere intensity changes and thus offers built-in correction for environmental effects. Herein, for the first time, a soft salt based phosphorescent probe has been developed for ratiometric and lifetime imaging of intracellular pH variations in real time. Specifically, a pH sensitive cationic complex (C1) and a pH insensitive anionic complex (A1) are directly connected through electrostatic interaction to form a soft salt based probe (S1), which exhibits a ratiometric phosphorescent response to pH with two well-resolved emission peaks separated by about 150 nm (from 475 to 625 nm). This novel probe was then successfully applied for ratiometric and lifetime imaging of intracellular pH variations. Moreover, quantitative measurements of intracellular pH fluctuations caused by oxidative stress have been performed for S1 based on the pH-dependent calibration curve.
Figures


References
-
- Stephens D. J., Allan V. J. Science. 2003;300:82. - PubMed
-
- Toncelli C., Arzhakova O. V., Dolgova A., Volynskii A. L., Bakeev N. F., Kerry J. P., Papkovsky D. B. Anal. Chem. 2014;86:1917. - PubMed
-
- Toncelli C., Arzhakova O. V., Dolgova A., Volynskii A. L., Kerry J. P., Papkovsky D. B. J. Mater. Chem. C. 2014;2:8035. - PubMed
-
- Papkovsky D. B., Dmitriev R. I. Chem. Soc. Rev. 2013;42:8700. - PubMed
LinkOut - more resources
Full Text Sources
Other Literature Sources