. 2018 Jan;2(1):38-47.
doi: 10.1038/s41551-017-0178-6. Epub 2018 Jan 10.

Prediction of off-target activities for the end-to-end design of CRISPR guide RNAs

Affiliations

Prediction of off-target activities for the end-to-end design of CRISPR guide RNAs

Jennifer Listgarten et al. Nat Biomed Eng. 2018 Jan.

Abstract

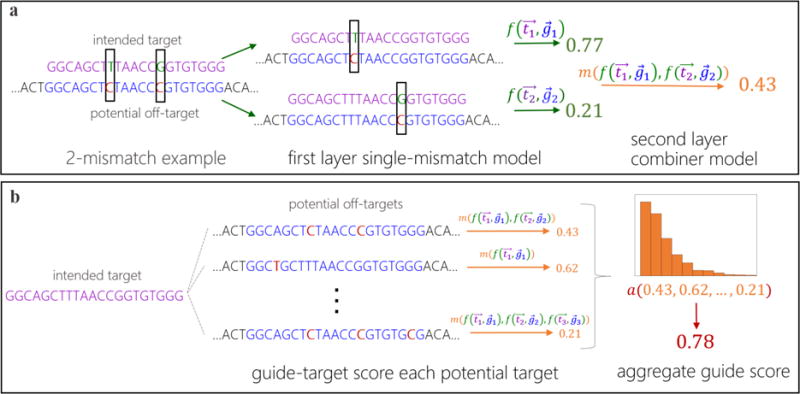
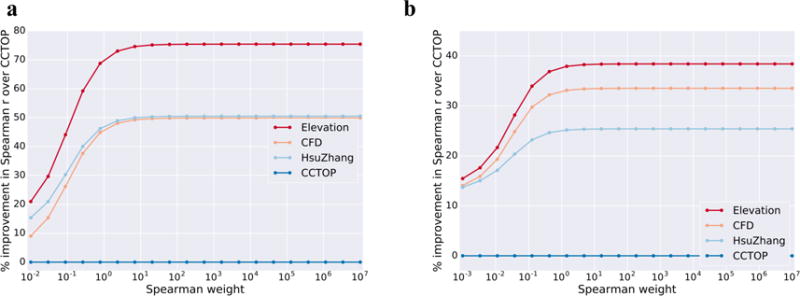
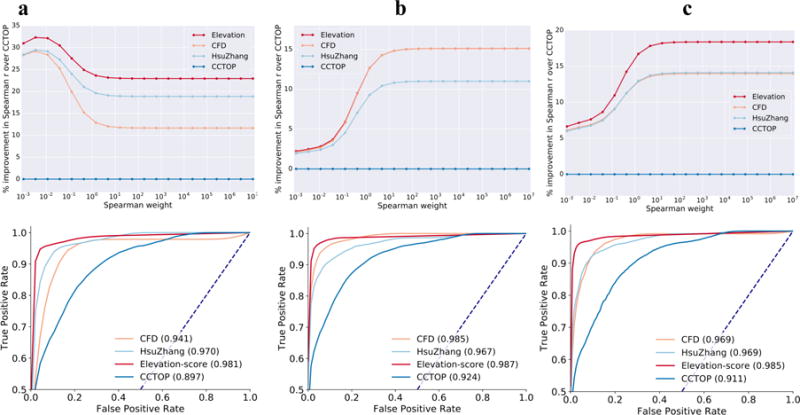
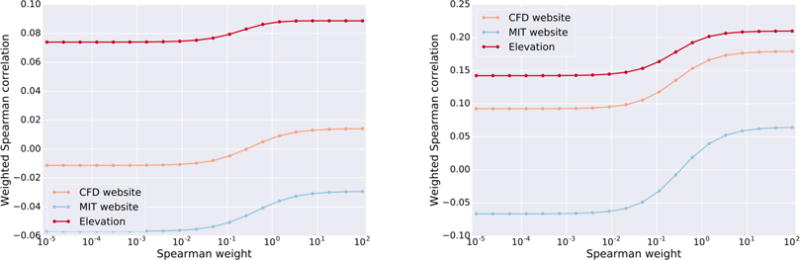
The CRISPR-Cas9 system provides unprecedented genome editing capabilities. However, off-target effects lead to sub-optimal usage and additionally are a bottleneck in the development of therapeutic uses. Herein, we introduce the first machine learning-based approach to off-target prediction, yielding a state-of-the-art model for CRISPR-Cas9 that outperforms all other guide design services. Our approach, Elevation, consists of two interdependent machine learning models-one for scoring individual guide-target pairs, and another which aggregates these guide-target scores into a single, overall summary guide score. Through systematic investigation, we demonstrate that Elevation performs substantially better than competing approaches on both tasks. Additionally, we are the first to systematically evaluate approaches on the guide summary score problem; we show that the most widely-used method performs no better than random at times, whereas Elevation consistently outperformed it, sometimes by an order of magnitude. We also introduce an evaluation method that balances errors between active and inactive guides, thereby encapsulating a range of practical use cases; Elevation is consistently superior to other methods across the entire range. Finally, because of the large scale and computational demands of off-target prediction, we have developed a cloud-based service for quick retrieval. This service provides end-to-end guide design by also incorporating our previously reported on-target model, Azimuth. (https://crispr.ml:please treat this web site as confidential until publication).


Conflict of interest statement

Competing Financial Interests JL, LH, ME, JC, NF performed research related to this manuscript while employed by Microsoft. J.K.J. has financial interests in Beacon Genomics, Beam Therapeutics, Editas Medicine, Pairwise Plants, Poseida Therapeutics, and Transposagen Biopharmaceuticals. J.K.J.’s interests were reviewed and are managed by Massachusetts General Hospital and Partners HealthCare in accordance with their conflict of interest policies.

Figures

Figure 1
Figure 1. Schematic of Elevation off-target predictive modelling
(a) An example of how to score a gRNA-target pair with two mismatches. First the gRNA-target pair is broken down into two single-mismatch pseudo-pairs, each of which is scored with the first layer (single mismatch) model, f(t1,g1). Then these scores are combined with the second-layer model, m(f(t1,g1),f(t2,g2)), yielding a single gRNA-target score that accounts for all mismatches. (b) An example of how to aggregate the set of gRNA-target scores for a single gRNA into one summary off-target score for a gRNA. The aggregator model, a(), computes statistics of the input distribution of gRNA-target scores as features and runs them through a model, producing the aggregate score for a gRNA (e.g. 0.78).
Figure 2
Figure 2. gRNA-target pair scoring
Comparison of Elevation-score performance to other methods, evaluated using a weighted Spearman correlation between predictions and assay measurements. The horizontal axis shows different weights in the weighted Spearman—at the far left the weight is effectively proportional to the rank-normalized GUIDE-Seq counts/cutting frequency, while at the far right the weight is effectively uniform, yielding a traditional Spearman correlation. For ease of visualization, the vertical axis denotes the percent improvement of each model over CCTOP, which by design thus lies constant at zero. (a) CD33 (N=4,853) and GUIDE-Seq (N=294,534) data were used to train, while Haeussler et al (N=10,129) data (after removing the GUIDE-Seq) were used to test. (b) the role of the GUIDE-Seq and Haeussler data are reversed from a. The final Elevation-score model deployed in our cloud service uses the model trained on GUIDE-Seq data. Note that respectively only 0.12% and 0.51% of count values in GUIDE-Seq and Haeussler are non-zero, making the traditional Spearman correlation difficult to interpret. For completeness, however, the right-most points correspond to a correlation of respectively 0.117, 0.100, 0.101 and 0.007 for Elevation, CFD, Hsu-Zhang and CCTOP in a) and 0.059, 0.057, 0.053 and 0.043 in b). The p-values computed for each Elevation correlation were less than floating point error (approximately 1×10⁻¹⁶); these demonstrate that despite the apparent low correlations, a tremendous amount of signal is present. Note that the apparent low correlations likely arise from the massive imbalance of inactive to active gRNAs.
Figure 3
Figure 3. First-layer gRNA-target scoring feature importances
Average importances (Gini importances; see Methods) for type of features in the first-layer single-mismatch model (mutation nucleotide identities and position jointly; mutation identity; mutation position; mutation transversion vs. transition). This model was trained with CD33 single-mismatch data. Feature importances from the second layer model are shown in Supplementary Table 2.
Figure 4
Figure 4. Validation of the Elevation gRNA-target scoring model
Performance of our final Elevation-score model on two independent validation sets (a) “Validation 1” (N=103,040 guide-target pairs of which 53 are active, arising from 5 sgRNAs), (b) and “Validation 2” (N=381,249 guide-target pairs of which 57 are active, arising from 22 sgRNAs), (c) (N=484,289 guide-target pairs of which 110 are active, arising from 27 sgRNAs). Although we believe our weighted Spearman correlation metric (top row) to be a particularly suitable evaluation metric, it is not necessarily intuitive to understand. Therefore, we also included (bottom row) ROC curve plots for classifier performance such as Haeussler et al. use for this same purpose. Note that random performance on the ROC is the dashed diagonal line and corresponds to AUC=0.50. Their corresponding AUC is written in the legend (higher is better), as these are more intuitive. The ROC/AUC evaluation measure is sub-optimal in that it only uses whether GUIDE-Seq found activity or not, rather than how much (which our Spearman-based metric does make use of). However, one can see that the ROC evaluation roughly tracks our Spearman-based metric. (For ease of visualization, ROC curves and AUCs are averages over 100 random samples of inactive guides equal in number to the number of active guides in each data set. Missing true positive rates at a given false positive rate, owing to the sampling, were linearly interpolated from the two nearest neighbors, within a curve).
Figure 5
Figure 5. Joint scoring and aggregation on viability screens
Weighted spearman correlation of Elevation to the crispr.mit.edu server. (a) Avana data (N=4,950) was used to train and Gecko to test (N=4,697), (b) the reverse of a. Note that the MIT website often yields correlation in the wrong direction. The final Elevation model deployed in our cloud service uses the model trained on Avana.
Figure 6
Figure 6. Aggregator feature importances
Weights from aggregator model in Elevation which uses Gradient Boosted regression trees. The features were: the mean; median, variance (var), standard deviation (std), 99th, 95th, 90th percentiles, and sum of the Elevation gRNA-target scores for each gRNA. We compute these for each of: all off-targets (no postfix), only genic off-targets (“genic”), and only non-genic targets (“non-genic”), where is-genic is obtained from ENSEMBL. Additionally, we compute these further features: fraction of targets that are genic; fraction that are non-genic; ratio of number of genic to non-genic targets; ratio of mean genic to non-genic score. The Gini importance is described in Methods.

References

    1. Doench JG, et al. Optimized sgRNA design to maximize activity and minimize off-target effects of CRISPR-Cas9. Nat Biotechnol. 2016:1–12. doi: 10.1038/nbt.3437. - DOI - PMC - PubMed
    1. Hsu PD, et al. DNA targeting specificity of RNA-guided Cas9 nucleases. Nat Biotechnol. 2013;31:827–32. - PMC - PubMed
    1. Tsai SQ, et al. GUIDE-seq enables genome-wide profiling of off-target cleavage by CRISPR-Cas nucleases. Nat Biotechnol. 2015;33:187–197. - PMC - PubMed
    1. Frock RL, et al. Genome-wide detection of DNA double-stranded breaks induced by engineered nucleases. Nat Biotechnol. 2015;33:179–86. - PMC - PubMed
    1. Wang X, et al. Unbiased detection of off-target cleavage by CRISPR-Cas9 and TALENs using integrase-defective lentiviral vectors. Nat Biotechnol. 2015;33:175–8. - PubMed