Review
. 2019 Jan 21;58(4):968-994.
doi: 10.1002/anie.201804736. Epub 2018 Nov 11.

High-Throughput Metabolomics by 1D NMR

Affiliations
Review

High-Throughput Metabolomics by 1D NMR

Alessia Vignoli et al. Angew Chem Int Ed Engl. .

Abstract

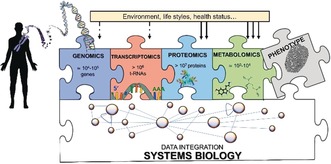
Metabolomics deals with the whole ensemble of metabolites (the metabolome). As one of the -omic sciences, it relates to biology, physiology, pathology and medicine; but metabolites are chemical entities, small organic molecules or inorganic ions. Therefore, their proper identification and quantitation in complex biological matrices requires a solid chemical ground. With respect to for example, DNA, metabolites are much more prone to oxidation or enzymatic degradation: we can reconstruct large parts of a mammoth's genome from a small specimen, but we are unable to do the same with its metabolome, which was probably largely degraded a few hours after the animal's death. Thus, we need standard operating procedures, good chemical skills in sample preparation for storage and subsequent analysis, accurate analytical procedures, a broad knowledge of chemometrics and advanced statistical tools, and a good knowledge of at least one of the two metabolomic techniques, MS or NMR. All these skills are traditionally cultivated by chemists. Here we focus on metabolomics from the chemical standpoint and restrict ourselves to NMR. From the analytical point of view, NMR has pros and cons but does provide a peculiar holistic perspective that may speak for its future adoption as a population-wide health screening technique.

Keywords: NMR; fingerprinting; metabolomics; omic sciences; profiling.


Conflict of interest statement

The authors declare no conflict of interest.

Figures

Figure 1
Figure 1
The flow of information in systems biology proceeds from the genome to the transcriptome, the proteome and finally to the metabolome. From left to right they are increasingly variable during an individual lifespan, and all concur to the phenotype.
Figure 2
Figure 2
a) Concentration ranges of the 260 most abundant metabolites in urine as determined by LC‐MS, NMR, GC‐MS, ICP‐MS and HPLC.18 Metabolites are sorted according to their mean absolute concentration values in urine. Green and blue bars highlight the organic metabolites and the inorganic ions that appear at high occurrence in urine, respectively; gray bars those at lower occurrence.18 b) Enlargement of the first 136 urine metabolites, with mean concentration value >30 μΜ. Adapted from Ref. 14.
Figure 3
Figure 3
Number of detectable and quantifiable metabolites with ≥50 % occurrence in the 1H NMR spectra of different biological fluids (urine,18 serum,19 saliva,20 CSF,21 EBC,22 fecal extracts, cell lysates (e.g. ovary and glioblastoma cells)23, 24 and intact tissues (e.g. liver and pancreas).25, 26
Figure 4
Figure 4
1H NMR spectra of: a) urine, b) serum, c) saliva, d) CSF, e) fecal extract, f) EBC, g) liver tissue, h) cell lysate (endo‐metabolome) and i) cell media (exo‐metabolome). The NMR spectra are recorded at 600 MHz, except for cell lysates and media (900 MHz).
Figure 5
Figure 5
Key stages of NMR spectral processing: 1) baseline correction, phase correction, calibration to an internal reference peak (e.g. glucose, TMSP, etc.); 2) normalization; 3) bucketing.
Figure 6
Figure 6
Different metabolomic strategies. If knowledge of the metabolites or metabolic pathways of interest is available, a targeted approach, which involves the analysis of only these specific metabolites, is the preferred choice. In the absence of prior knowledge, the problem can be addressed by analyzing the spectrum, with a so‐called untargeted approach. Untargeted analysis can be achieved via metabolic fingerprinting or profiling. The former is a global evaluation of all of the features of a binned spectrum without identification of single metabolites; the latter deals with the analysis of all quantifiable metabolites. Each of these three different sets of data can be addressed by either multivariate or univariate analyses. Multivariate methods are routinely used to visualize biological data, to identify possible clusters, and to build predictive models; these can be divided into two main categories: unsupervised analyses to explore data without any class membership and supervised analyses to discriminate among known groups of interest. Conversely, univariate methods are used to identify metabolites and thus metabolic pathways that are altered or correlated with specific biological conditions.
Figure 7
Figure 7
The automated assignment of several 1H NMR signals of >60 urine metabolites, performed by the urine shift predictor.14 The urine spectrum is divided into 3 regions: a) 9.5–5.5 ppm, b) 4.5–3.0 ppm and c) 3.0–0.9 ppm.
Figure 8
Figure 8
The NMR‐derived urine individual metabolic phenotype and its stability over time. a) Multiple urine samples collected from 12 healthy donors (each identified by a given color) over a period of 20 days occupy a well‐defined portion of the metabolic space (PCA‐CA score plot), thus indicating that intraindividual variations are much smaller than interindividual differences. This is due to an invariant part of the metabolome characteristic of each individual, which identifies the individual phenotype. b) The individual phenotype over the time scale of 10 years is very stable in the absence of physiopathological conditions that can cause abrupt deviations (subjects AG, AW, BD). If this condition is over, the individual phenotype reverts back (AG, AW); adapted from Ref. 122.
Figure 9
Figure 9
Applications in the biomedical field. a) Monitoring the efficacy of the gluten free diet in CD patients: predictive clustering of CD patients after 12 months on a gluten‐free diet (yellow triangles) using a PLS‐RCC model built on CD patients (red circles) and healthy controls (light blue circles).158 b) Metabolomic profiling of tumor tissues predicting clinical outcome of pancreatic adenocarcinoma patients.26 b1) OPLS‐DA model discriminates pancreatic adenocarcinoma tissues (black circles) with respect to pancreatic healthy tissues (white squares), R2 and Q2 were used to measure model quality: R2> 0.7 and Q2>0.5 can be considered as a good predictor. b2) Ethanolamine concentration (the threshold value was 0.740 nmol mg−1) as a single metabolic biomarker for the prediction of overall survival in patients with PA. Kaplan–Meier curves show differences between long‐term (black line) and short‐term (segmented line) survival patients. c) Prediction of overall survival in patients with mCRC. c1) PLS‐CA clustering for long OS (purple triangles) and short OS (aquamarine circles) mCRC patients. c2) Kaplan–Meier curves showing survival probability based on the 1H‐NMR metabolomic model.159 d) Identification of early‐BC patients at increased risk of disease recurrence via serum metabolomics. d1) Clustering of serum metabolomic profiles between early‐BC (green circles) and mBC (pink squares) patients using a Random Forest (RF) classifier in the training set. d2) Prediction of relapse in the test set containing 192 relapse early‐BC patients and 42 early‐BC patients free from disease up to 6 years (ROC curve).160 e) Discrimination between HF patients (lilac circles) and healthy subjects (dark blue squares) using an OPLS‐DA.143 f) Pharmaco‐metabonomic phenotyping: a scores plot from PCA of the pre‐dose of paracetamol urine spectra. NMR data discriminates low histology damage (Class 1, green squares) and severe histology damage (Class 3, red squares).161
Figure 10
Figure 10
SK1 expression induces a metabolic switch known as the Warburg effect in A2780 ovarian cancer cells.23 From the comparison between A2780 mock (blue) and SK1‐expressing cells (red) emerges that expression of SK1 induced a high glycolytic rate (a), characterized by increased levels of lactate, and decreased oxidative metabolism, associated with the accumulation of intermediates of the TCA (b). Changes in metabolite levels caused by SK1 overexpression were statistically significant by paired Wilcoxon test, *P‐value<0.05.
Figure 11
Figure 11
A single metabolite that is significant for the discrimination of healthy and diseased populations still may not provide a clear‐cut answer (20 % false positives and false negatives in this example, upper panel). The ambiguity originates from inter‐individual variability, represented by the width of the two Gaussian distributions. Conversely, it is more likely that an individual can be correctly classified if the level of the metabolite is quantified before and after the onset of the disease. While individual A is correctly classified as healthy and subsequently as diseased also according to population statistics, individuals B and C would not be classified correctly if evaluated only by population statistics.
Figure 12
Figure 12
The main applications of food metabolomics. Food consumption monitoring and treating/preventing diseases, for the human health field (blue); chemical and molecular analyses of food composition and its characteristic ecosystem that contributes to the definition of traceability/authenticity of food resource (green); food processing area for the characterization of the effect of pre‐ and post‐harvest manipulations on food (orange).
Figure 13
Figure 13
3D projections of the model space with the ellipsoids of possible groups available in the databases. a) Extract from JuiceScreenerTM, estimation of the origin of an orange juice.212 b) Extract from WinescreenerTM report of a Sangiovese sample (star) with respect to other Italian wines. Classification model for the wine type assignment, representing the probability of classification for every group.213
Figure 14
Figure 14
Examples of technical improvement. a) Gelification of urine by silica particles provides a ready‐to‐use HR‐MAS sample that could be exploited for metabolomic routine studies. b) Prediction of 11 inorganic ions and albumin by urine shift predictor.14

References

    1. Nicholson J. K., Lindon J. C., Nature 2008, 455, 1054–1056. - PubMed
    1. Calabrò A., Gralka E., Luchinat C., Saccenti E., Tenori L., J. Autoimmune Dis. 2014, 2014, e756138. - PMC - PubMed
    1. Kirwan J., In Practice 2013, 35, 438–445.
    1. Pontes J. G. M., Brasil A. J. M., Cruz G. C. F., de Souza R. N., Tasic L., Anal. Methods 2017, 9, 1078–1096. - PubMed
    1. Tang J., Curr. Genomics 2011, 12, 391–403. - PMC - PubMed

Publication types

LinkOut - more resources