. 2018 Aug 14;57(32):4880-4890.
doi: 10.1021/acs.biochem.8b00199. Epub 2018 Jul 25.

Mass Spectrometry Reveals a Multifaceted Role of Glycosaminoglycan Chains in Factor Xa Inactivation by Antithrombin

Mass Spectrometry Reveals a Multifaceted Role of Glycosaminoglycan Chains in Factor Xa Inactivation by Antithrombin

Burcu B Minsky et al. Biochemistry. .

Abstract

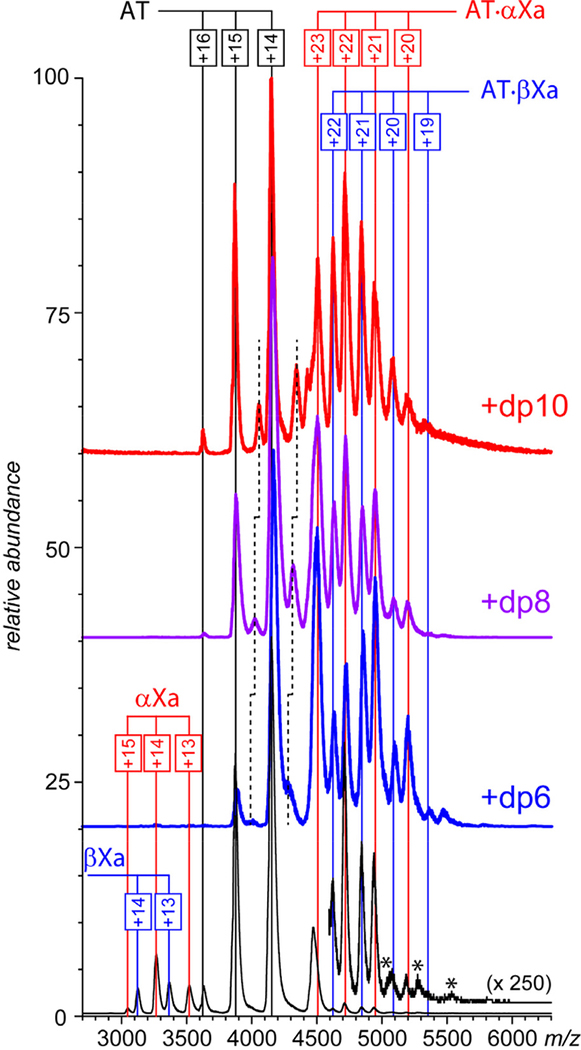
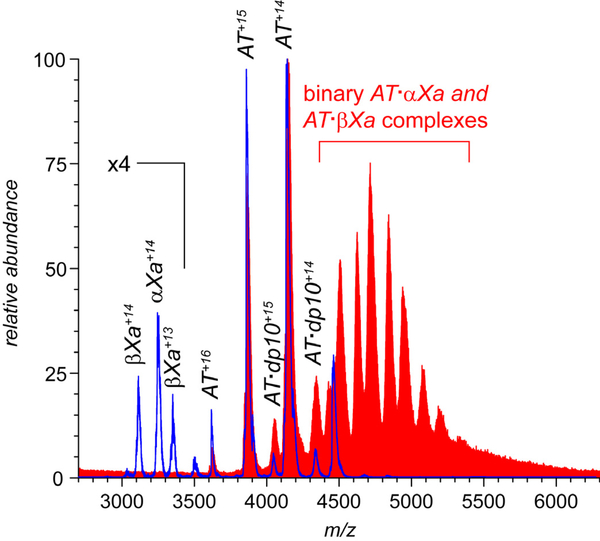
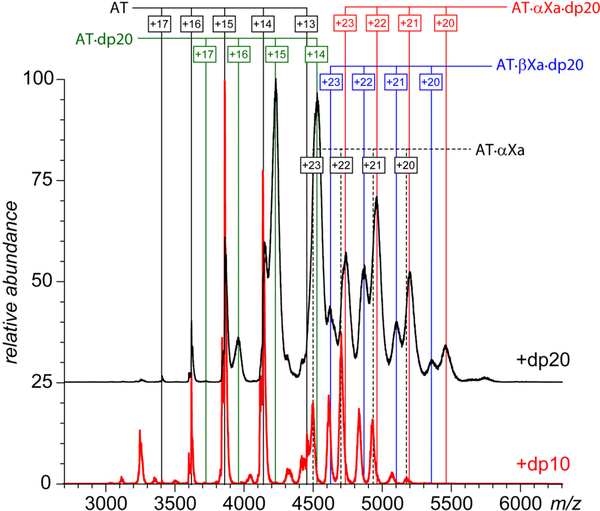
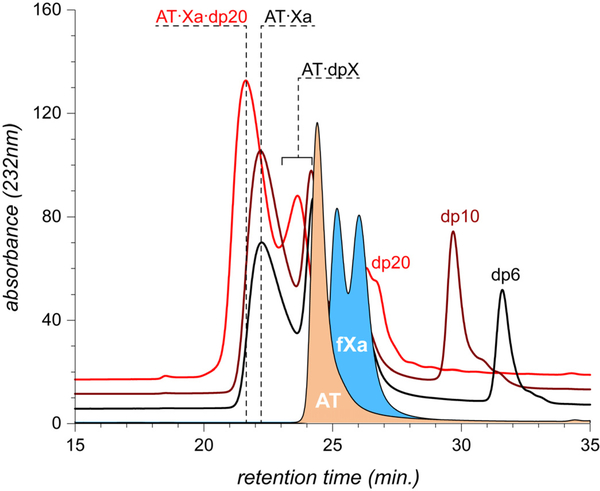
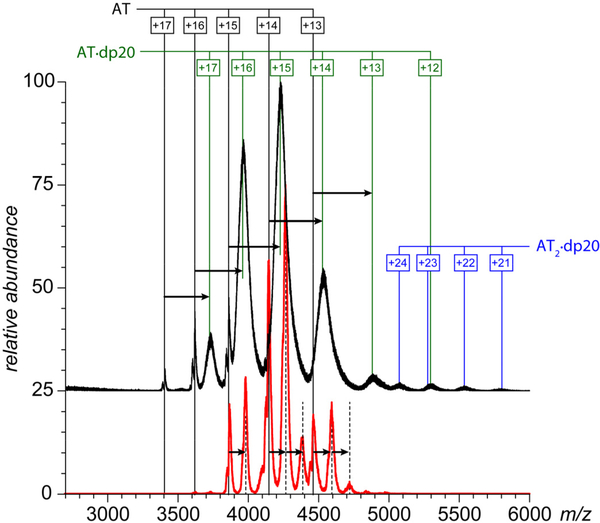
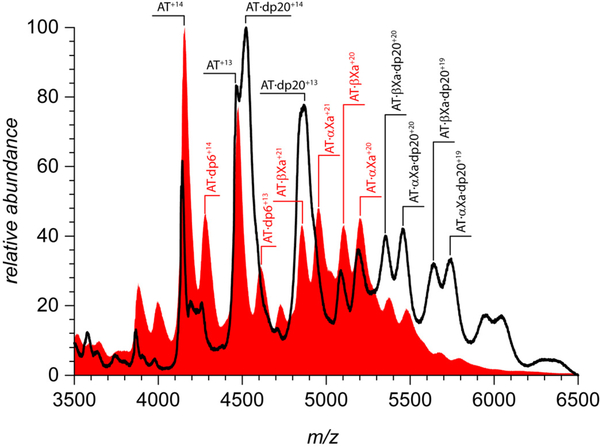
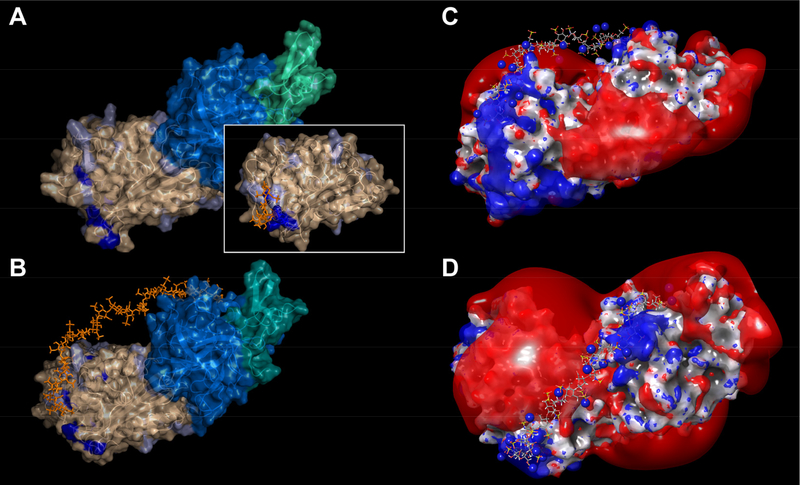
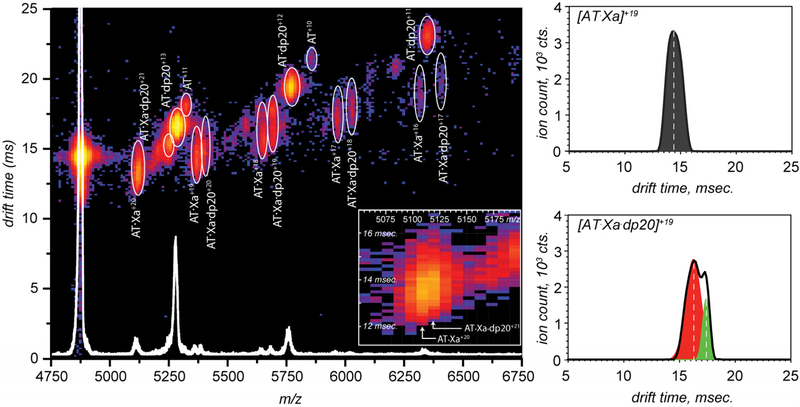
Factor Xa (fXa) inhibition by antithrombin (AT) enabled by heparin or heparan sulfate is critical for controlling blood coagulation. AT activation by heparin has been investigated extensively, while interaction of heparin with trapped AT/fXa intermediates has received relatively little attention. We use native electrospray ionization mass spectrometry to study the role of heparin chains of varying length [hexa-, octa-, deca-, and eicosasaccharides (dp6, dp8, dp10, and dp20, respectively)] in AT/fXa complex assembly. Despite being critical promoters of AT/Xa binding, shorter heparin chains are excluded from the final products (trapped intermediates). However, replacement of short heparin segments with dp20 gives rise to a prominent ionic signal of ternary complexes. These species are also observed when the trapped intermediate is initially prepared in the presence of a short oligoheparin (dp6), followed by addition of a longer heparin chain (dp20), indicating that binding of heparin to AT/fXa complexes takes place after the inhibition event. The importance of the heparin chain length for its ability to associate with the trapped intermediate suggests that the binding likely occurs in a bidentate fashion (where two distinct segments of oligoheparin make contacts with the protein components, while the part of the chain separating these two segments is extended into solution to minimize electrostatic repulsion). This model is corroborated by both molecular dynamics simulations with an explicit solvent and ion mobility measurements in the gas phase. The observed post-inhibition binding of heparin to the trapped AT/fXa intermediates hints at the likely role played by heparan sulfate in their catabolism.


Conflict of interest statement

Conflicts of Interest

The authors declare no competing financial interest.

Figures

Figure 1.
Figure 1.
ESI mass spectra of mixtures of AT (1.8 μM) and fXa (1.5 μM) incubated in the absence of hepain oligomers (bottom) and in the presence of ca. 15 μM short-chain oligomers (as indicated on each panel) in 150 mM ammonium acetate (pH 7.0). Note that the detectable fXa signal (m/z region 3,000 – 3,700) can be observed only in the absence of heparin oligomers.
Figure 2.
Figure 2.
ESI mass spectra of mixtures of AT (1.8 μM) and fXa (1.5 μM) incubated in the presence of 0.02 mg/mL (ca. 15 μM) heparin decasaccharides (dp10). The red and blue traces show the results of experiment where active and latent forms of AT were used, respectively.
Figure 3.
Figure 3.
ESI mass spectra of mixtures of AT (1.8 μM) and fXa (1.5 μM) incubated in the presence of ca. 7.5 μM dp20 (top trace) and dp10 (bottom) in 150 mM ammonium acetate (pH 7.0).
Figure 4.
Figure 4.
SEC chromatograms of AT/fXa mixture incubated in the presence of dp6 (black trace), dp10 (brown) and dp20 (red). In all cases protein concentrations were kept at 17 μM (fXa) and 22 μM (AT), while concentrations of the heparin oligomers were adjusted to 170 μM. The traces at the bottom of the diagram correspond to AT and fXa, respectively.
Figure 5.
Figure 5.
ESI mass spectra of 1.8 μM AT acquired in the presence of ca. 7.5 μM dp20 (top trace) and dp10 (bottom) in 150 mM ammonium acetate (pH 7.0). Ionic signals corresponding to AT/heparin oligomer complexes are prominent in each mass spectrum.
Figure 6.
Figure 6.
ESI mass spectra of mixtures of AT and fXa (4.5 and 3.0 μM, respectively) incubated in the presence of dp6 (30 μM) followed by the isolation of the trapped intermediate and addition of dp20 to a final concentration of 15 μM (black trace). The red trace shows a control mass spectrum acquired without post-isolation addition of the long heparin chains.
Figure 7.
Figure 7.
A model of a trapped AT/fXa intermediate prepared using a homology model of AT (PDB id: 1ATT) a conformationally compatible structure of fXa (PDB id: 1C5M) and an O-acyl serpin/elastase complex (PDB id: 2D26) as structural templates (A). The AT surface is colored in wheat, and fXa heavy and light chains are colored in marine blue and teal, respectively. The amino acid residues participating in the heparin pentasaccharide binding in free AT are colored in dark blue. A structure of free AT, rendered in the same fashion, is shown as an inset. Model of the ternary AT·fXa·dp20 complex produced by docking the dp20 chain (prepared by eliminating four saccharide units from a dp24 chain, PDB id 3IRG) to the AT/fXa intermediate and subsequent optimization by a simulated annealing sequence (B). The dp20 chain is shown in orange, and pale blue color on the AT surface identifies the positions of all basic residues beyond the initial pentasaccharide binding domain (which are shown in dark blue). Two representative orthogonal views of the ternary complex AT·fXa·dp20 generated by MD simulations showing the final position of the heparin chain with respect to the kT/2e isoelectric surfaces of the trapped intermediate (C and D).
Figure 8.
Figure 8.
Drift time distributions for ions representing binary (AT·fXa) and ternary AT·fXa·dp20 complexes produced by limited charge reduction of ionic species within the m/z window 4871–4921 u in the ESI mass spectrum of mixtures of AT and fXa (4.5 and 3.0 μM, respectively) incubated in the presence of dp6 (30 μM) followed by isolation of the trapped intermediate and addition of dp20 to a final concentration of 15 μM.

Similar articles

Cited by

References

    1. Howell WH, and Holt E (1918) Two new factors in blood coagulation ‐ heparin and pro‐antithrombin, Am. J. Physiol 47, 328–341.
    1. Messmore HL (1986) Clinical efficacy of heparin fractions: issues and answers, Crit. Rev. Clin. Lab. Sci 23, 77–94. - PubMed
    1. Petitou M, and van Boeckel CAA (2004) A synthetic antithrombin III binding pentasaccharide is now a drug! What comes next?, Angew. Chem. Int. Ed. Engl 43, 3118–3133. - PubMed
    1. Di Nisio M, Middeldorp S, and Büller HR (2005) Direct Thrombin Inhibitors, N. Engl. J. Med 353, 1028–1040. - PubMed
    1. Versteeg HH, Heemskerk JWM, Levi M, and Reitsma PH (2013) New Fundamentals in Hemostasis, Physiol. Rev 93, 327–358. - PubMed

Publication types

LinkOut - more resources