. 2018 Aug 31;128(9):4163-4178.
doi: 10.1172/JCI99597. Epub 2018 Aug 20.

αv Integrins regulate germinal center B cell responses through noncanonical autophagy

Affiliations

αv Integrins regulate germinal center B cell responses through noncanonical autophagy

Fiona Raso et al. J Clin Invest. .

Abstract

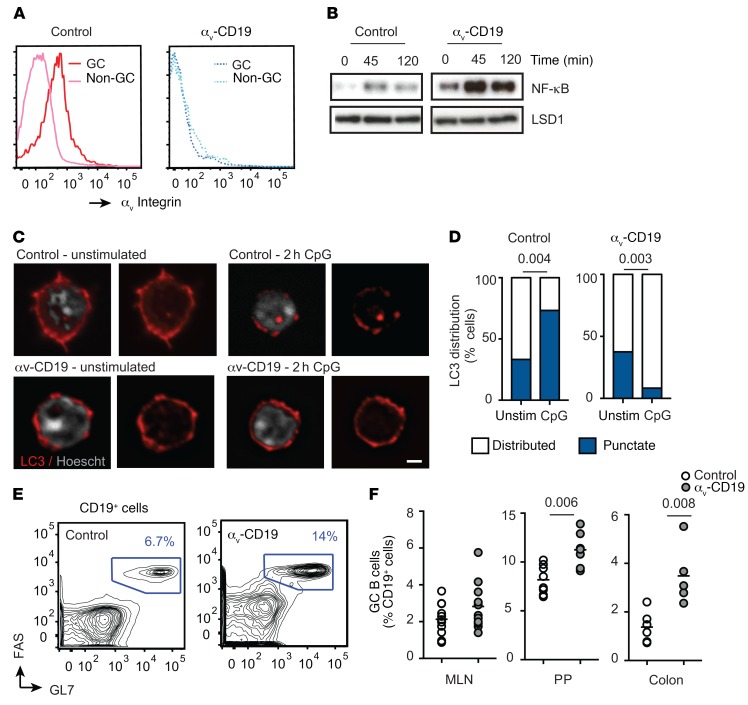
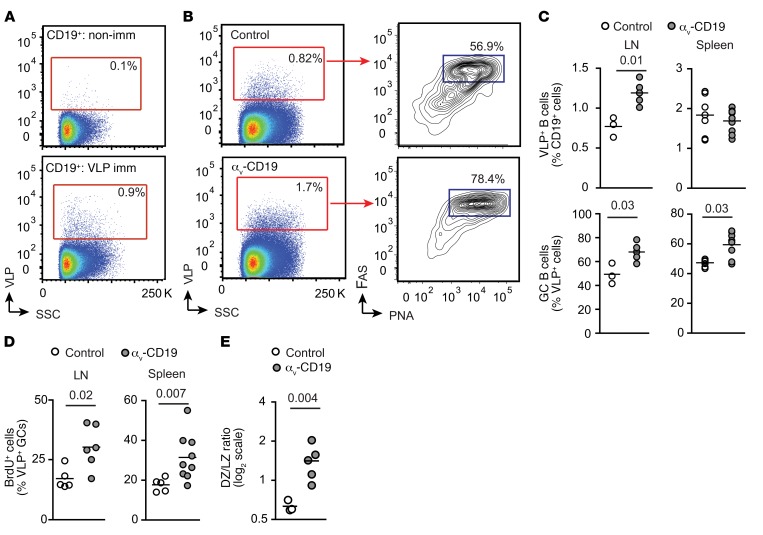
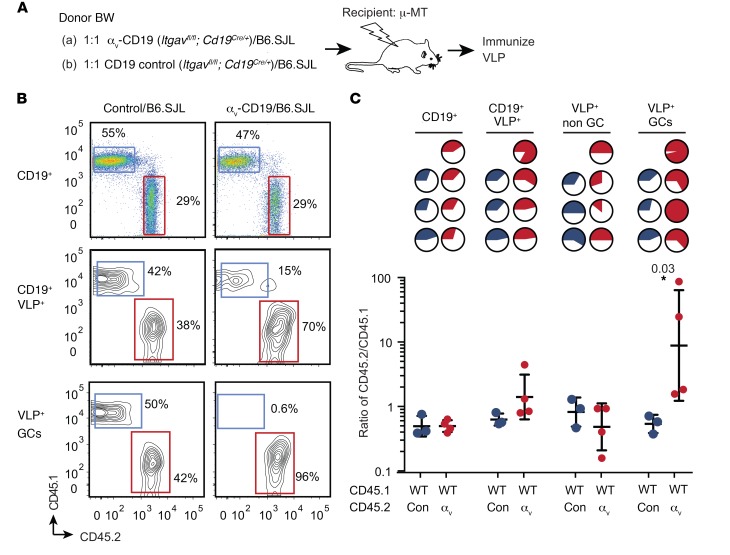
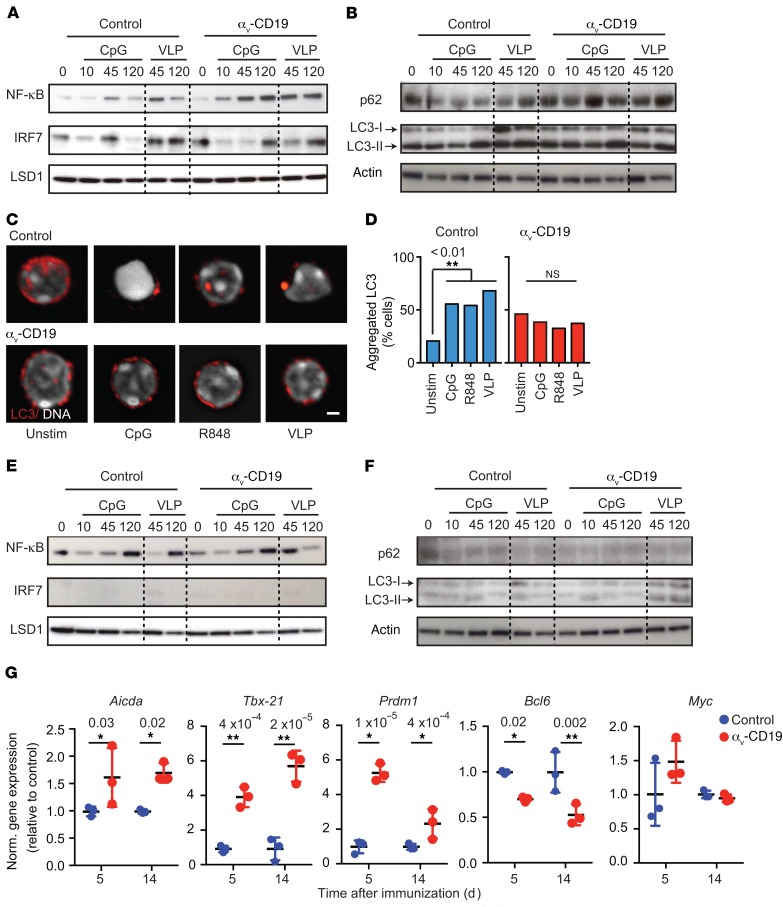
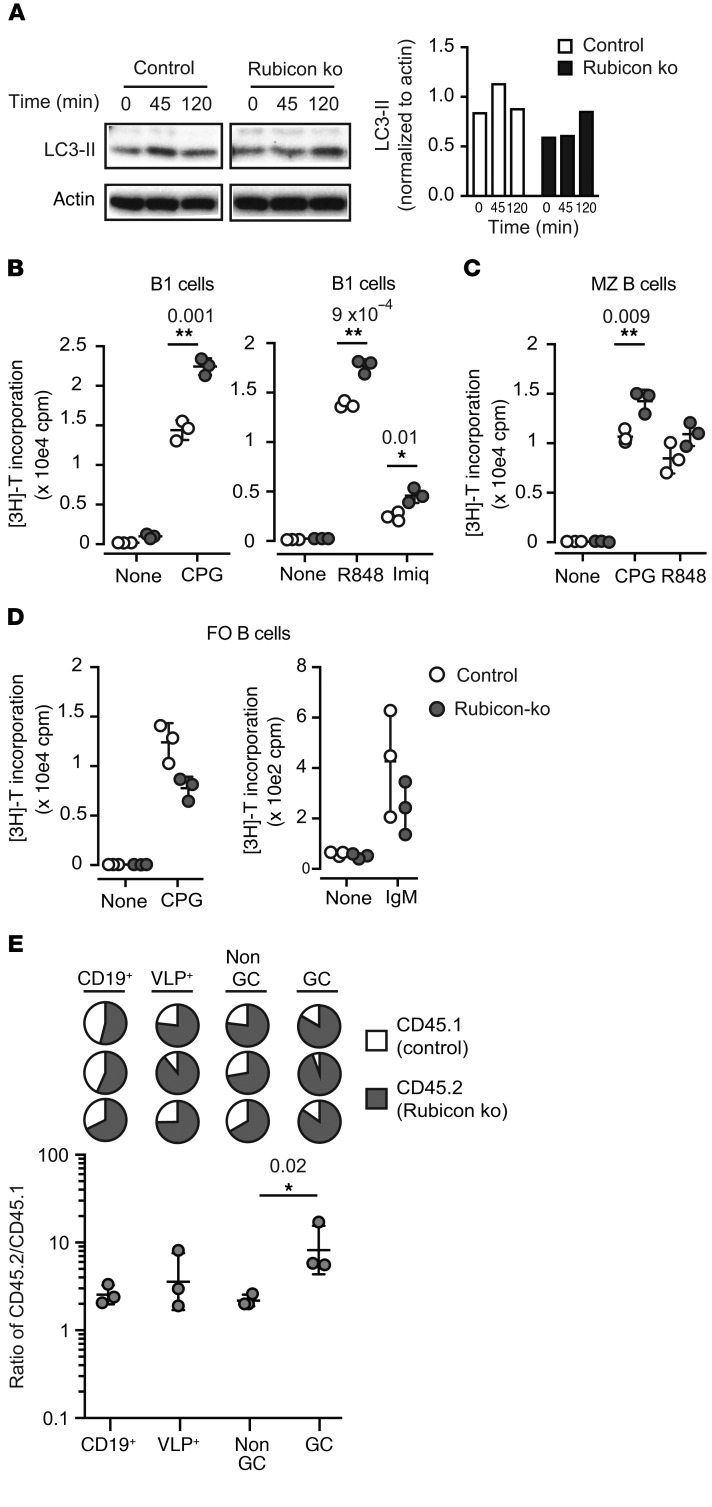
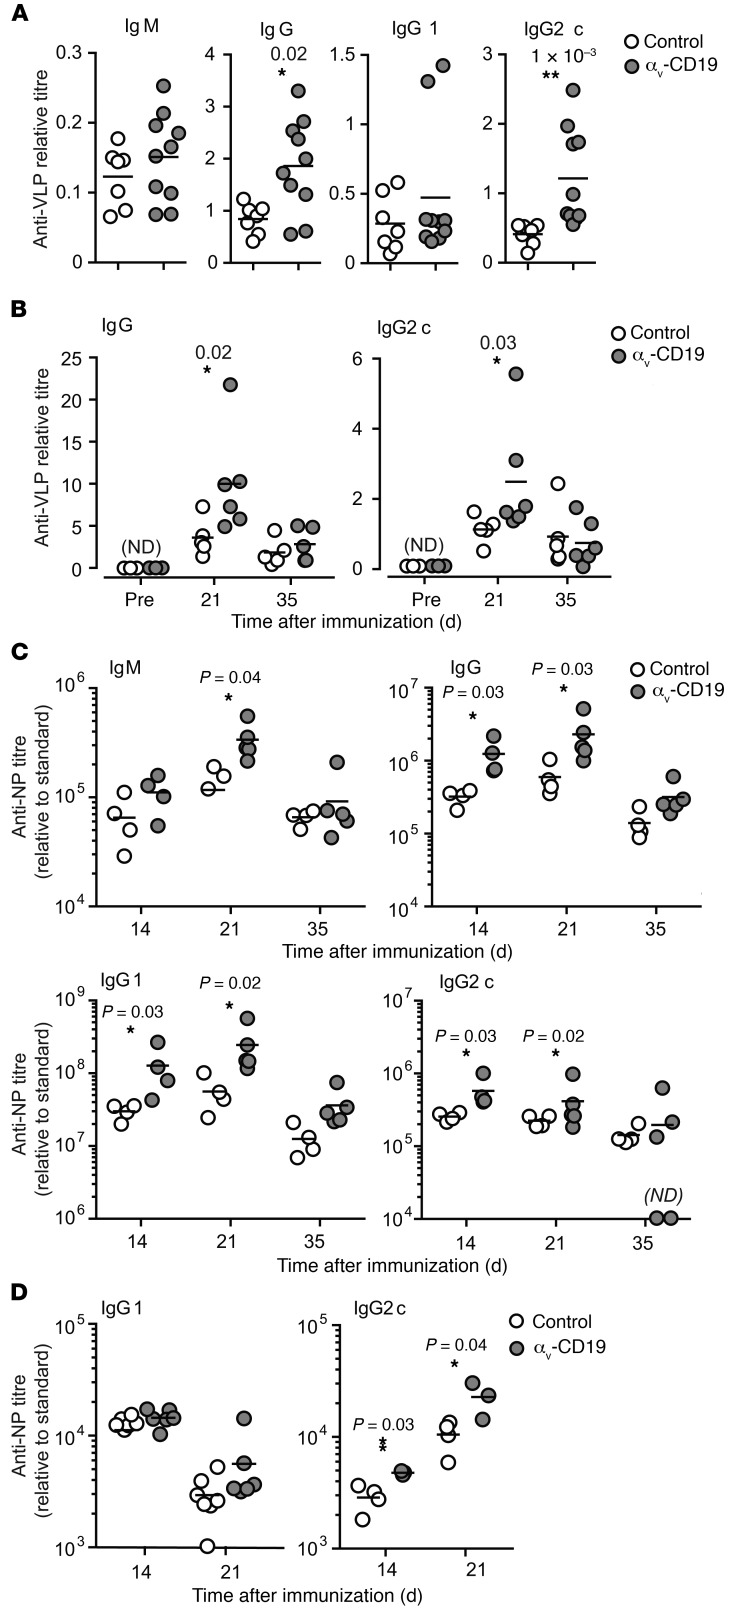
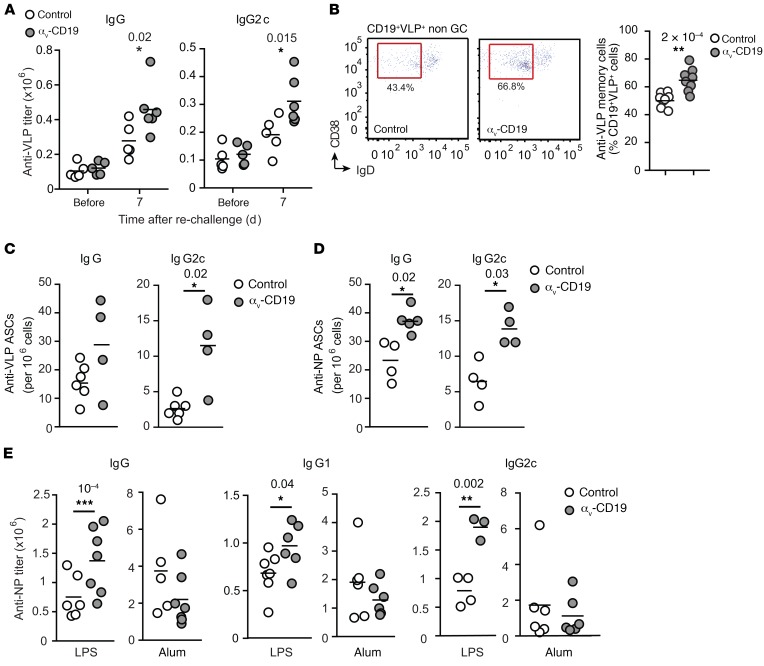
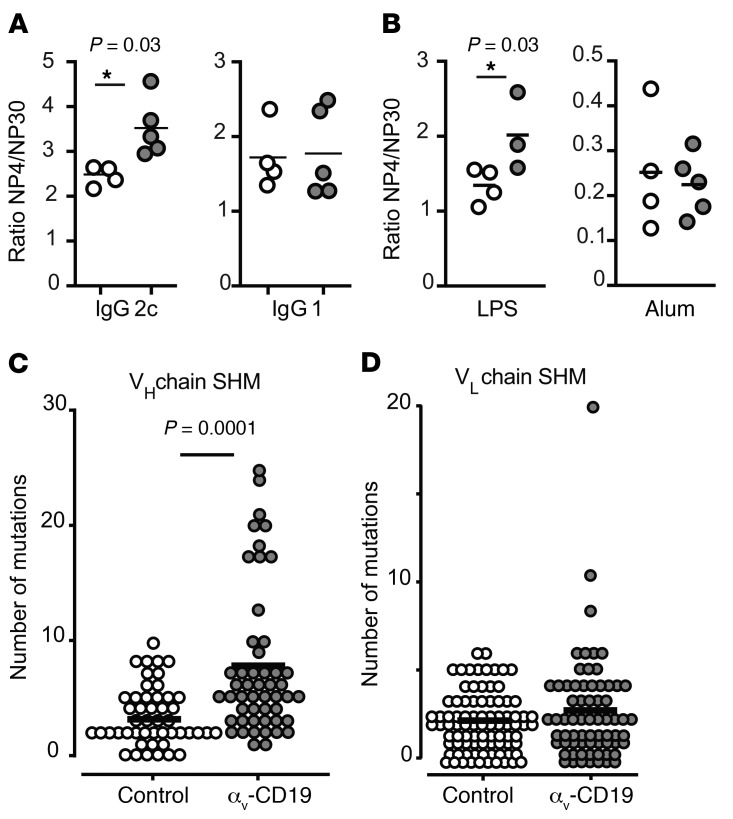
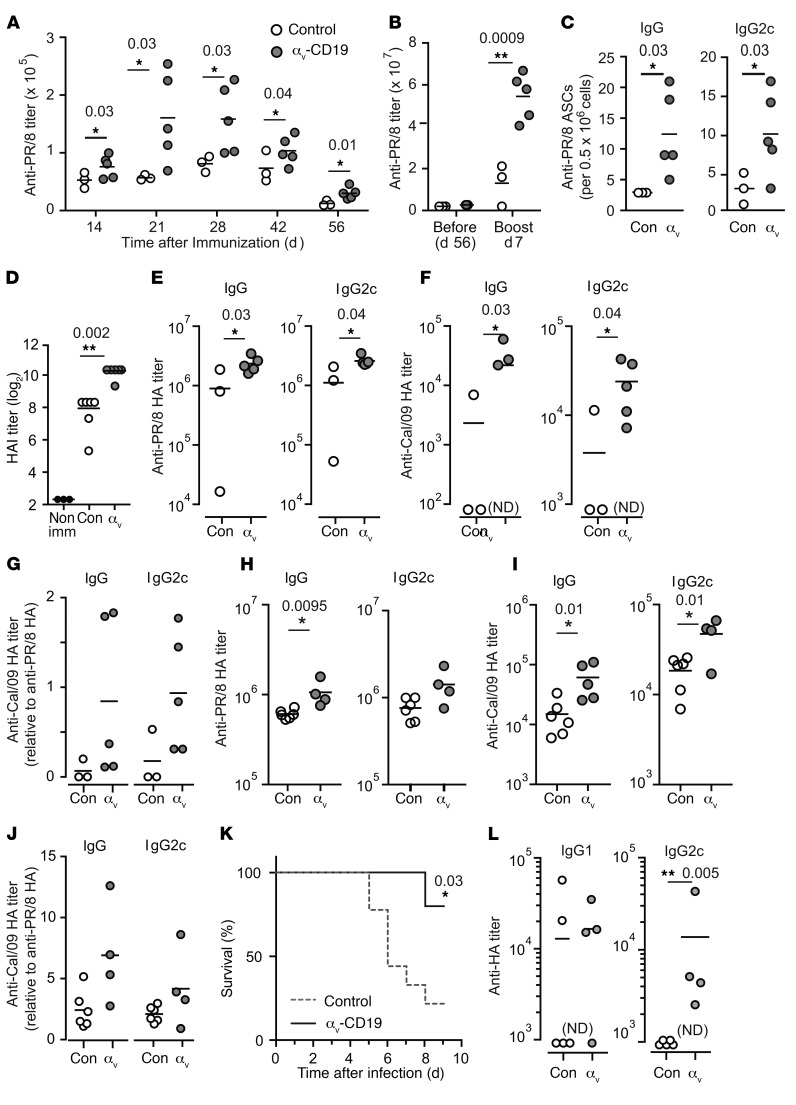
Germinal centers (GCs) are major sites of clonal B cell expansion and generation of long-lived, high-affinity antibody responses to pathogens. Signaling through TLRs on B cells promotes many aspects of GC B cell responses, including affinity maturation, class switching, and differentiation into long-lived memory and plasma cells. A major challenge for effective vaccination is identifying strategies to specifically promote GC B cell responses. Here, we have identified a mechanism of regulation of GC B cell TLR signaling, mediated by αv integrins and noncanonical autophagy. Using B cell-specific αv-KO mice, we show that loss of αv-mediated TLR regulation increased GC B cell expansion, somatic hypermutation, class switching, and generation of long-lived plasma cells after immunization with virus-like particles (VLPs) or antigens associated with TLR ligand adjuvants. Furthermore, targeting αv-mediated regulation increased the magnitude and breadth of antibody responses to influenza virus vaccination. These data therefore identify a mechanism of regulation of GC B cells that can be targeted to enhance antibody responses to vaccination.

Keywords: B cells; Immunology; Innate immunity; Integrins; Vaccines.


Conflict of interest statement

Conflict of interest: MA and ALH are named as inventors on a provisional patent (no. 62/591620) related to this work filed by Benaroya Research Institute.

Figures

Figure 1
Figure 1. Increased GC B cells in αv-CD19 mice.
(A) Histograms show staining for αv on CD19+ cells from control mice (solid lines) or αv-CD19 mice (dotted lines). (B) Western blot analysis of NF-κB p65 in nuclear fractions from FACS-sorted PP GC cells from control and αv-CD19 mice stimulated in vitro with CpG for the indicated times (minutes). Also shown is the staining for LSD1 to confirm equal loading of nuclear protein. (C) Confocal microscopy of FACS-sorted PP GC B cells from control and αv-CD19 mice with or without in vitro stimulation with 2 μM CpG DNA for 2 hours. Cells are stained for LC3b (red) or nuclear DNA (Hoescht, white). Images show representative examples of distributed LC3 expression (unstimulated control and αv-CD19) and punctate expression (CpG-treated control). Scale bar: 2.5 μm. (D) Proportions of cells undergoing LC3 reorganization, based on counting of at least 30 cells/condition. P values are shown (Pearson’s χ2 test). (E) Representative FACS plots of cells from PP of control and αv-CD19 mice gated on CD19+ B cells and stained with FAS/GL7. Gates used for identification of GC B cells and frequency of GC B cells are shown. (F) Quantification of frequency of GC B cells in mesenteric lymph nodes (MLN), PP, and colon lamina propria in control and αv-CD19 mice. GC B cells were gated as CD19+GL7+FAS+ cells as in E. Each point represents an individual mouse, and at least 5 mice were analyzed for each group. P values of less than 0.05 are shown (2- tailed Student’s t test). For all data shown, similar results were seen in at least 3 independent experiment.
Figure 2
Figure 2. Increased GC B cells in αv-CD19 mice immunized with TLR ligands.
(A) FACS plots of cells from LNs from VLP-immunized and nonimmunized (non-imm) mice stained with fluorescent VLPs, showing VLP+ cells in CD19+ gate. Gating strategy for VLP-specific B cells based on nonimmunized mice is shown. SSC, side scatter. (B) Representative FACS analysis of VLP+ cells from mediastinal and abdominal LNs of control and αv-CD19 mice 14 days after immunization with 2 μg VLPs. Left panels show on CD19+ cells and gates used to identify VLP+ cells. Right panels show GC B cells (PNA+FAS+ cells) within the CD19+VLP+ gate. (C) Quantification of VLP+ cells and VLP+ GC cells in VLP-immunized control and αv-CD19 mice. Each point represents a single mouse; bars show mean. (D) Proportion of LN and spleen VLP+ GC B cells (gated as in B) from control and αv-CD19 mice immunized with 2 μg VLP for 14 days that stain positive for BrdU 12 hours after BrdU administration. (E) VLP-specific GC cells were gated based on expression of markers of DZ (CXCR4+CD86lo) and light zone (LZ) (CD86+CXCR4lo). Data show ratio of DZ/light zone cells in individual mice. Bars show the mean. In all cases, P values of less than 0.05 are shown (Mann-Whitney-Wilcoxon test). For all data shown, similar results were seen in at least 3 independent experiments.
Figure 3
Figure 3. Loss of αv confers competitive advantage to GC cells.
(A) Schematic for the experimental plan. CD138-depleted BM cells from congenically marked CD45.1 mice (B6.SJL) were mixed at a 1:1 ratio with BM cells from CD45.2 αv-CD19 mice and injected into irradiated μ-MT mice to generate mixed BM chimeras. Control chimeras were generated with a 1:1 mix of B6.SJL BM and CD45.2 control CD19-Cre BM cells. Six weeks after reconstitution, mice were immunized with 2 μg VLP and harvested at day 14 for analysis of antigen-specific B cells by FACS. (B) Representative FACS panels for analysis of composition of CD45.1 and CD45.2 cells in CD19+, CD19+VLP+, or CD19+VLP+ GC B cell compartments. GC cells were identified as PNA+FAS+ cells. (C) Pie charts in top section of panel show relative proportions of CD45.2+ cells (solid regions of pie charts) in control chimeras (blue) and αv-CD19 chimeras (red) in indicated B cell compartments; each pie chart represents 1 mouse. Lower panel shows data from all mice in each group expressed as ratio of CD45.2/CD45.1 and geometric mean ± SD. Ratios of CD45.2/CD45.1 cells for VLP+ non-GC and GC B cells from WT/αv chimeras were compared by 2-tailed Student’s t test of log-transformed data. P value is shown. Data are from 1 representative experiment, with similar results seen in 3 independent experiments.
Figure 4
Figure 4. αv Regulates TLR signaling in GC B cells through autophagy proteins.
(A and B) GC B cells were sorted from spleens of αv-CD19 and control mice 14 days after immunization with VLP and restimulated in vitro with CpG DNA or VLP for the indicated times (minutes). Western blots show NF-κB p65 and IRF7 in nuclear fractions (A) or p62 and LC3b in whole-cell lysates (B). Also shown is staining of LSD1 or actin to confirm equivalent protein loading in nuclear fraction and whole-cell lysates, respectively. These were performed on the same blot, except in the case of LC3-II, for which actin staining was from aliquots of the same samples run on parallel gels contemporaneously. (C) Confocal images of sorted primary GC B cells (as in A and B) treated with CpG DNA, R848, or VLP for 2 hours and stained for LC3 and Hoescht. Scale bar: 2.9 µm. (D) Quantification of LC3 reorganization after stimulation with indicated TLR ligands. Data are based on analysis of at least 30 cells/condition. P values of less than 0.01 are shown (Pearson’s χ2 test). *P < 0.05. (E and F) FACS-sorted non-GC follicular B cells from spleens of VLP-immunized αv-CD19 and control mice analyzed as in A and B. (G) Expression of indicated genes measured by quantitative reverse-transcriptase PCR (QRT-PCR) in RNA from FACS-sorted VLP-specific GC cells, isolated 5 or 14 days after immunization with 2 μg VLPs. Data from individual mice are shown, with mean ± SD. P values of less than 0.05 are shown (2-tailed Student’s t test). *P < 0.05; **P < 0.005. Data are all from 1 representative experiment of at least 3 independent experiments (2 experiments for p62 blots) in which similar results were seen.
Figure 5
Figure 5. Rubicon-mediated noncanonical autophagy regulates B cell TLR responses.
(A) MZ B cells from Rubicon-KO and control mice were stimulated in vitro with CpG DNA for the indicated times (minutes). Western blots show LC3b and actin in whole-cell lysates. Histogram shows quantification of LC3-II normalized to actin for this blot. Similar results were seen in 3 independent experiments. (BD) Proliferation of peritoneal B1 B cells (B), sorted spleen MZ B cells (C), and spleen follicular (FO) B cells (D) from Rubicon-KO and control mice after stimulation with TLR ligands (CpG DNA, R848, and imiquimod) or anti-IgM. Proliferation was measured by [3H]-thymidine incorporation and is expressed as mean ± SD for 3 independent cultures. P values of less than 0.05 are shown (2-tailed Student’s t test). *P < 0.05; **P < 0.01. Similar results were seen in 3 independent experiments. (E) Mixed BM chimeras between control C57BL/6.SJL congenic mice and Rubicon-KO mice (CD45.2) were generated and used to assess competitive recruitment to the GC compartment as described in Figure 3. Pie charts show relative proportions of CD45.2+ cells (solid regions) in indicated B cell compartments; each pie chart represents 1 mouse. Lower panel shows data from individual mice expressed as the ratio of CD45.2/CD45.1. Also shown are the geometric means ± SD. Ratios of CD45.2/CD45.1 cells for VLP+ non-GC and GC B cells were compared by 2-tailed Student’s t test of log-transformed data. P value is shown. Similar results were seen in 2 independent experiments.
Figure 6
Figure 6. Increased antibody production in αv-CD19 mice.
(AB) Serum anti-VLP antibody titers in control and αv-CD19 mice immunized with 2 μg VLPs containing ssRNA measured 14 days after immunization (A) or over a time course from preimmunization (pre) to 35 days (B). VLP-specific Abs were not detected (ND) in preimmunization bleeds. (C) Serum anti-NP IgM, IgG, IgG1, and Ig2c titers in control and αv-CD19 mice immunized with NP-CG (50 μg) combined with TLR7 ligand imiquimod-SE (10 μg). (D) Serum anti-NP IgG1 and IgG2c antibody titers in control and αv-CD19 mice immunized with NP-CG (50 μg) combined with LPS (5 μg). All data points represent individual mice with mean shown. P values of less than 0.05 are shown (Mann-Whitney-Wilcoxon test). *P < 0.05; **P < 0.005. Samples below the level of detection are indicated as not detected. Similar results were seen in 3 independent experiments.
Figure 7
Figure 7. Loss of αv affects long-lived antibody responses.
(A) Serum anti-VLP IgG and IgG2c titers in control and αv-CD19 mice immunized with 2 μg VLPs containing ssRNA that were boosted with empty VLP at day 68 and harvested after a further 7 days. (B) Frequency of VLP-specific CD38+IgDlo B cells in control and αv-CD19 mice at day 7 after boost as in A. (C and D) Antigen-specific plasma cells enumerated by ELISpot assay on BM cells from control or αv-CD19 mice harvested after immunization and rechallenged with either (C) VLPs (2 μg) or (D) NP-CG with imiquimod-SE. (E) Serum anti-NP IgG, IgG1, and IgG2c titers in control and αv-CD19 mice immunized initially with NP-CG with either LPS or alum and boosted at day 42 with NP-CG (25 μg) alone. All data points represent individual mice with mean shown. P values of less than 0.05 are shown (Mann-Whitney-Wilcoxon test). *P < 0.05; **P < 0.005. Similar results were seen in 3 independent experiments.
Figure 8
Figure 8. Deletion of αv promotes SHM and affinity maturation of antibodies.
(A and B) Affinity maturation of antibodies measured as ratio of anti-NP4/anti-NP30 titers in serum of NP-CG–immunized mice rechallenged with NP-CG at day 42 and bled after a further 7 days. Mice were initially immunized with NP-CG and imiquimod-SE (A) or NP-CG in LPS or alum (B). Data points represent individual mice with mean shown. P values of less than 0.05 are shown (Mann-Whitney-Wilcoxon test). *P < 0.05. Similar results were seen in 3 independent experiments. (C and D) Point mutations in the IgG heavy chain (VH) (C) or light chain (VL) (D) of individual spleen VLP+ GC B cells 14 days after immunization with 2 μg VLPs. Each dot indicates a single cell, and line indicates the mean. Mutations were identified by comparing with germline sequences. P values of less than 0.05 are shown (Mann-Whitney-Wilcoxon test).
Figure 9
Figure 9. Deletion of αv enhances antibody response to influenza virus.
(A and B) Serum anti-PR/8 IgG titers in control and αv-CD19 mice immunized with 10 μg of inactivated H1N1 PR/8 (A) and (B) boosted at day 57 with 5 μg inactivated PR/8. (C) PR/8-specific plasma cells enumerated by ELISpot in BM cells from control (Con) and αv-CD19 mice harvested at day 7 after boost. (D) HAI activity in sera from control and αv-CD19 mice at day 21 after PR/8 immunization. (E and F) Serum antibody titers against HA from H1N1 PR/8 (E) or H1N1 Cal/09 (F) in control and αv-CD19 mice at day 7 after boost with inactivated PR/8. (G) Anti-Cal/09 HA titer normalized to anti-PR/8 HA titer. (H and I) Serum antibody titers against HA from PR/8 (H) or Cal/09 (I) in control and αv-CD19 at day 51 after immunization with inactivated PR/8 (10 μg) in imiquimod-SE (10 μg). (J) Anti-Cal/09 HA titer normalized to anti-PR/8 HA titer for mice immunized with PR/8 in imiquimod-SE. (K) Survival of control and αv-CD19 mice following intranasal infection with PR/8 (n ≥ 5 mice/group). (L) Anti-PR8 HA titers from surviving mice at day 7 after infection. All data points represent individual mice with mean shown. P values of less than 0.05 are shown (Mann-Whitney-Wilcoxon test for antibody titers or Mantel-Cox test for survival curves).*P < 0.05; **P < 0.005. Samples below the level of detection are indicated as not detected. For all data, similar results were seen in at least 3 independent experiments.

Comment in

References

    1. Victora GD, Nussenzweig MC. Germinal centers. Annu Rev Immunol. 2012;30:429–457. doi: 10.1146/annurev-immunol-020711-075032. - DOI - PubMed
    1. Bannard O, Cyster JG. Germinal centers: programmed for affinity maturation and antibody diversification. Curr Opin Immunol. 2017;45:21–30. doi: 10.1016/j.coi.2016.12.004. - DOI - PubMed
    1. DeFranco AL. The germinal center antibody response in health and disease. F1000Res. 2016;5:F1000. - PMC - PubMed
    1. Rookhuizen DC, DeFranco AL. Toll-like receptor 9 signaling acts on multiple elements of the germinal center to enhance antibody responses. Proc Natl Acad Sci U S A. 2014;111(31):E3224–E3233. doi: 10.1073/pnas.1323985111. - DOI - PMC - PubMed
    1. Kasturi SP, et al. Programming the magnitude and persistence of antibody responses with innate immunity. Nature. 2011;470(7335):543–547. doi: 10.1038/nature09737. - DOI - PMC - PubMed

Publication types

MeSH terms