. 2018 Jul 12;19(1):89.
doi: 10.1186/s13059-018-1463-8.

Alternative DNA secondary structure formation affects RNA polymerase II promoter-proximal pausing in human

Affiliations

Alternative DNA secondary structure formation affects RNA polymerase II promoter-proximal pausing in human

Karol Szlachta et al. Genome Biol. .

Abstract

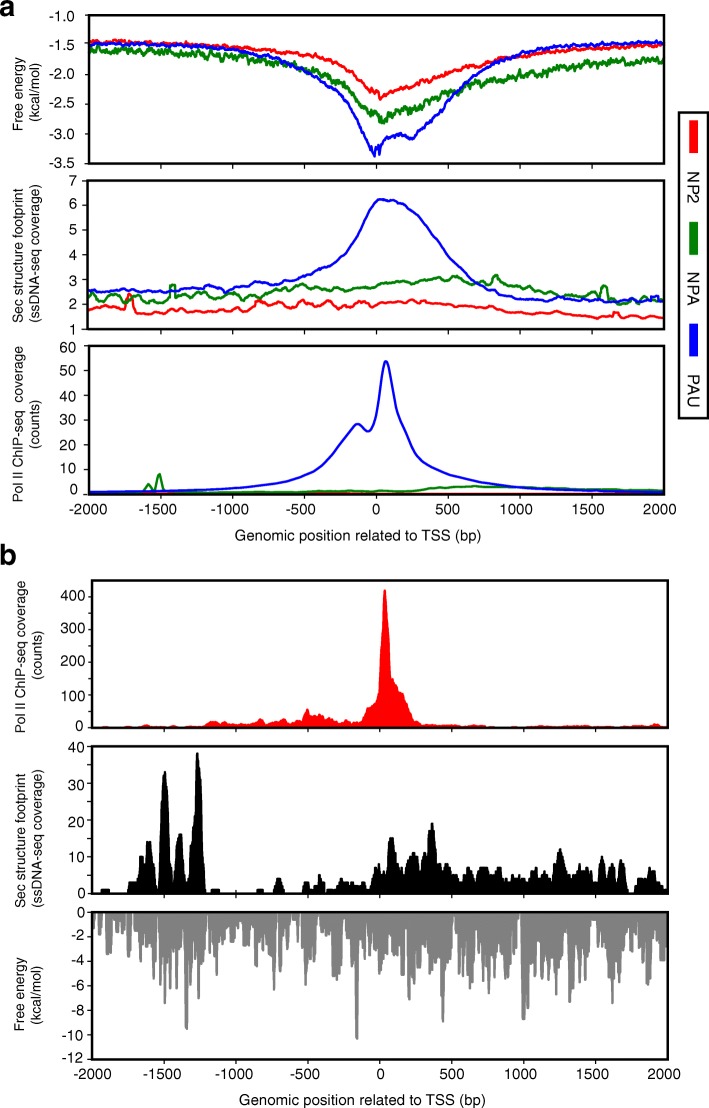
Background: Alternative DNA secondary structures can arise from single-stranded DNA when duplex DNA is unwound during DNA processes such as transcription, resulting in the regulation or perturbation of these processes. We identify sites of high propensity to form stable DNA secondary structure across the human genome using Mfold and ViennaRNA programs with parameters for analyzing DNA.

Results: The promoter-proximal regions of genes with paused transcription are significantly and energetically more favorable to form DNA secondary structure than non-paused genes or genes without RNA polymerase II (Pol II) binding. Using Pol II ChIP-seq, GRO-seq, NET-seq, and mNET-seq data, we arrive at a robust set of criteria for Pol II pausing, independent of annotation, and find that a highly stable secondary structure is likely to form about 10-50 nucleotides upstream of a Pol II pausing site. Structure probing data confirm the existence of DNA secondary structures enriched at the promoter-proximal regions of paused genes in human cells. Using an in vitro transcription assay, we demonstrate that Pol II pausing at HSPA1B, a human heat shock gene, is affected by manipulating DNA secondary structure upstream of the pausing site.

Conclusions: Our results indicate alternative DNA secondary structure formation as a mechanism for how GC-rich sequences regulate RNA Pol II promoter-proximal pausing genome-wide.

Keywords: DNA secondary structure; RNA polymerase II promoter-proximal pausing.


Conflict of interest statement

Ethics approval and consent to participate

Not applicable.

Consent for publication

Not applicable.

Competing interests

LCTP is a full-time employee of Relay Therapeutics. All other authors declare that they have no competing interests.

Publisher’s Note

Springer Nature remains neutral with regard to jurisdictional claims in published maps and institutional affiliations.

Figures

Fig. 1
Fig. 1
Significantly higher presence of highly stable DNA secondary structures at the TSS (± 250 nt) and co-localized with Pol II. a Gene location of highly stable secondary sites is plotted. Genomic regions were defined as described in “Methods”. The numbers of peaks were normalized by the total number of sites and the total size of genomic regions. b Null model analysis of the intersection of highly stable secondary structure sites with Pol II ChIP-seq peaks demonstrates enrichment patterns in five cell lines (p < 10− 4, permutation analysis). Fold enrichment is defined as the ratio of the actual number of intersecting regions over the mean of the number of intersections of 10,000 instances of randomly shuffled secondary structure sites. Solid line at fold enrichment = 1 corresponds to no change
Fig. 2
Fig. 2
Highly stable DNA secondary structures preferentially form at the promoter-proximal regions of paused genes. a Box plots show the mean free energy at the TSS ± 250 nt in two cell lines: H1-hESC (left) and HeLa-S3 (right). Based on the traveling ratio, genes were classified as no Pol II (NP2, red), non-paused (NPA, green), and paused (PAU, blue). Numbers of each group of genes in each cell line (shown in Table S3) are depicted in pie charts. *p < 2.2 × 10− 16, t-test (Additional file 1: Table S4). b Average free energy profiles (solid line) and average Pol II ChIP-seq coverage profiles (dotted line) are shown in two cell lines: H1-hESC (top) and HeLa-S3 (bottom). Paused, non-paused, and no Pol II genes are shown in blue, green, and red, respectively. The Mfold analysis was used here, and the ViennaRNA anlysis is shown in Additional file 1: Figure S2D
Fig. 3
Fig. 3
Pol II occupancy signals from Pol II ChIP-seq, GRO-seq, and NET-seq strongly correlate with stable DNA secondary structures of paused genes. Heat map representations of Pol II ChIP-seq (red), GRO-seq (blue), NET-seq (green) coverage and free energy (green-red) profile in HeLa-S3 cells are shown at the TSS ± 2 knt region. Paused genes (n = 11,019) were ordered by the distance of the Pol II ChIP-seq peak summit from each gene’s TSS
Fig. 4
Fig. 4
Single-nucleotide resolution signals of mNET-seq demonstrate highly stable secondary structures located upstream of the paused sites. a Heat map representations of mNET-seq coverage (black), secondary structure free energy (green-red), and GRO-seq coverage (blue) for Pol II bound genes in HeLa-S3 cells are shown. Pol II-bound genes were ordered by the distance of the strongest mNET-seq read spike to each gene’s TSS. A high magnification of a section of the heat maps displays a thin, bright line of relatively low secondary structure free energies (marked by arrows). b An average free energy profile (purple) and average Pol II coverage (red) centered at the strongest mNET-seq read spike (black) are shown (n = 10,428). At the average free energy of − 3.25 kcal/mol, DNA secondary structures are, on average, about 10 to 40 nt upstream of the peak of the highest mNET-seq read spikes. c Schematic representation of genic and intergenic pausing sites relative to annotated gene transcription start and termination sites. Cumulative distribution of distances between pausing sites to the TSS or TTS: pausing sites within human RefSeq annotated genes (to TSS, green), and pausing sites located outside of human annotated genes (to TSS (red) and to TTS (blue)). d Average profile plot of mNET-seq coverage (black) and secondary structure free energy (purple) at Pol II pausing sites that are located within annotated human genes and centered on the highest mNET-seq read spike are shown (top panel). At the average free energy of − 3.2 kcal/mol, DNA secondary structures are, on average, about 24 to 48 nt upstream of the peak of the highest mNET-seq read spikes. Average profile plot of mNET-seq coverage (black) and secondary structure free energy (purple) at Pol II pausing sites that are not located within annotated human genes and centered on the highest mNET-seq read spike are shown. At the average free energy of − 2.8 kcal/mol, DNA secondary structures are, on average, about 24 to 52 nt upstream of the peak of the highest mNET-seq read spikes (bottom panel). The Mfold analysis was used here, and the ViennaRNA anlysis is shown in Additional file 1: Figure S5
Fig. 5
Fig. 5
G4 structures identified by G4-specific antibody in NHEK cells strongly correlate with Pol II pausing sites and free energy minima of computed structures. a Heat map representations of Pol II ChIP-seq (red), and G4 ChIP-seq (black) coverage and free energy (green-red) profile in NHEK cells are shown at the TSS ± 2 knt region. Genes with G4 structures within the TSS + 2 kb region (n = 656) were ordered by the distance of the Pol II ChIP-seq peak summit from each gene’s TSS. b Average G4 structure profiles (black line) and average Pol II ChIP-seq coverage profiles (red line) are generated from the data described in a
Fig. 6
Fig. 6
Stable DNA secondary structures detected in Raji cells preferentially form at the promoter-proximal regions of paused genes. Based on the traveling ratio, genes in Raji cells were classified as no Pol II (NP2, red), non-paused (NPA, green), and paused (PAU, blue). Numbers of each group of genes are listed in Table S3. a Average free energy profiles (top), in vivo secondary structure footprints (middle), and average Pol II ChIP-seq coverage profiles (bottom) are shown. Heat map representations of the same data are shown in Additional file 1: Figure S8. b Profiles of Pol II ChIP-seq (top), in vivo secondary structure footprints (middle) and the predicted free energy (bottom) at TSS ± 2 kb of human heat shock gene (HSPA1B) are shown
Fig. 7
Fig. 7
HSPA1B mutants affecting DNA secondary structure formation demonstrate differential pausing in vitro. a Plot shows free energy profile of HSPA1B gene around the in vitro pausing site. The difference in free energy (ΔG) between CGA mutant (less stable structure) and WT (CGC) is marked in red, while the ΔG difference between CGG (more stable structure) and WT is marked in green. Mutated sites are highlighted. In vitro transcription conditions (60 mM KCl, 7 mM MgCl2, and 30 °C) were used for Mfold analysis. b Structural probing of WT (CGC), CGG, and CGA with mung bean nuclease under in vitro transcription conditions. Each of the DNAs (30 nt) were treated with mung bean nuclease, which specifically cleaves single-stranded regions, and the products resolved on denaturing polyacrylamide gels. It showed that the CGG mutant displayed more protection at the region around the mutation (the affected region marked by a bracket and the mutation site marked by an asterisk), indicating the presence of double-stranded regions and thus the formation of hairpin structure. In contrast, the CGA mutant was more susceptible to the mung bean nuclease cleavage at the mutation site, suggesting the destabilization of the hairpin. c A representative polyacrylamide gel shows in vitro transcription of full-length (FL, 311-nt runoff transcripts) and paused (P) transcripts of wild-type HSPA1B, CGA, and CGG mutants, and no DNA template control in HeLa nuclear extracts. d The dependence of cumulative free energy difference and experimentally measured fraction of paused transcripts is shown. The cumulative free energy difference for each variant is determined from all possible secondary structures affected by the mutations (Additional file 1: Table S5). The line generated using robust linear regression (RLM function in Python) shows a correlation of strong RNA Pol II pausing associated with stable DNA secondary structures
Fig. 8
Fig. 8
Possible mechanisms for DNA secondary structure mediation of promoter-proximal Pol II pausing. The transcription complex (green) could be paused via multiple mechanisms: (1) by a secondary structure formed on the non-template strand of DNA itself; (2) by a protein recognizing such a structure; or (3) by an RNA:DNA hybrid (red and black lines)

References

    1. Wang G, Vasquez KM. Impact of alternative DNA structures on DNA damage, DNA repair, and genetic instability. DNA Repair (Amst) 2014;19:143–151. doi: 10.1016/j.dnarep.2014.03.017. - DOI - PMC - PubMed
    1. Ma Y, Pannicke U, Schwarz K, Lieber MR. Hairpin opening and overhang processing by an Artemis/DNA-dependent protein kinase complex in nonhomologous end joining and V(D)J recombination. Cell. 2002;108:781–794. doi: 10.1016/S0092-8674(02)00671-2. - DOI - PubMed
    1. Lu H, Schwarz K, Lieber MR. Extent to which hairpin opening by the Artemis:DNA-PKcs complex can contribute to junctional diversity in V(D)J recombination. Nucleic Acids Res. 2007;35:6917–6923. doi: 10.1093/nar/gkm823. - DOI - PMC - PubMed
    1. Larijani M, Martin A. Single-stranded DNA structure and positional context of the target cytidine determine the enzymatic efficiency of AID. Mol Cell Biol. 2007;27:8038–8048. doi: 10.1128/MCB.01046-07. - DOI - PMC - PubMed
    1. Holtz CM, Sadler HA, Mansky LM. APOBEC3G cytosine deamination hotspots are defined by both sequence context and single-stranded DNA secondary structure. Nucleic Acids Res. 2013;41:6139–6148. doi: 10.1093/nar/gkt246. - DOI - PMC - PubMed

Publication types