. 2018 Jul 12;16(7):e2005206.
doi: 10.1371/journal.pbio.2005206. eCollection 2018 Jul.

A bidirectional relationship between sleep and oxidative stress in Drosophila

Affiliations

A bidirectional relationship between sleep and oxidative stress in Drosophila

Vanessa M Hill et al. PLoS Biol. .

Abstract

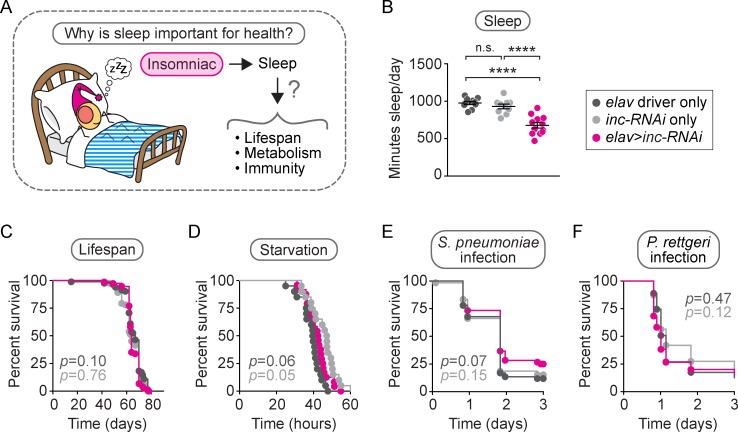
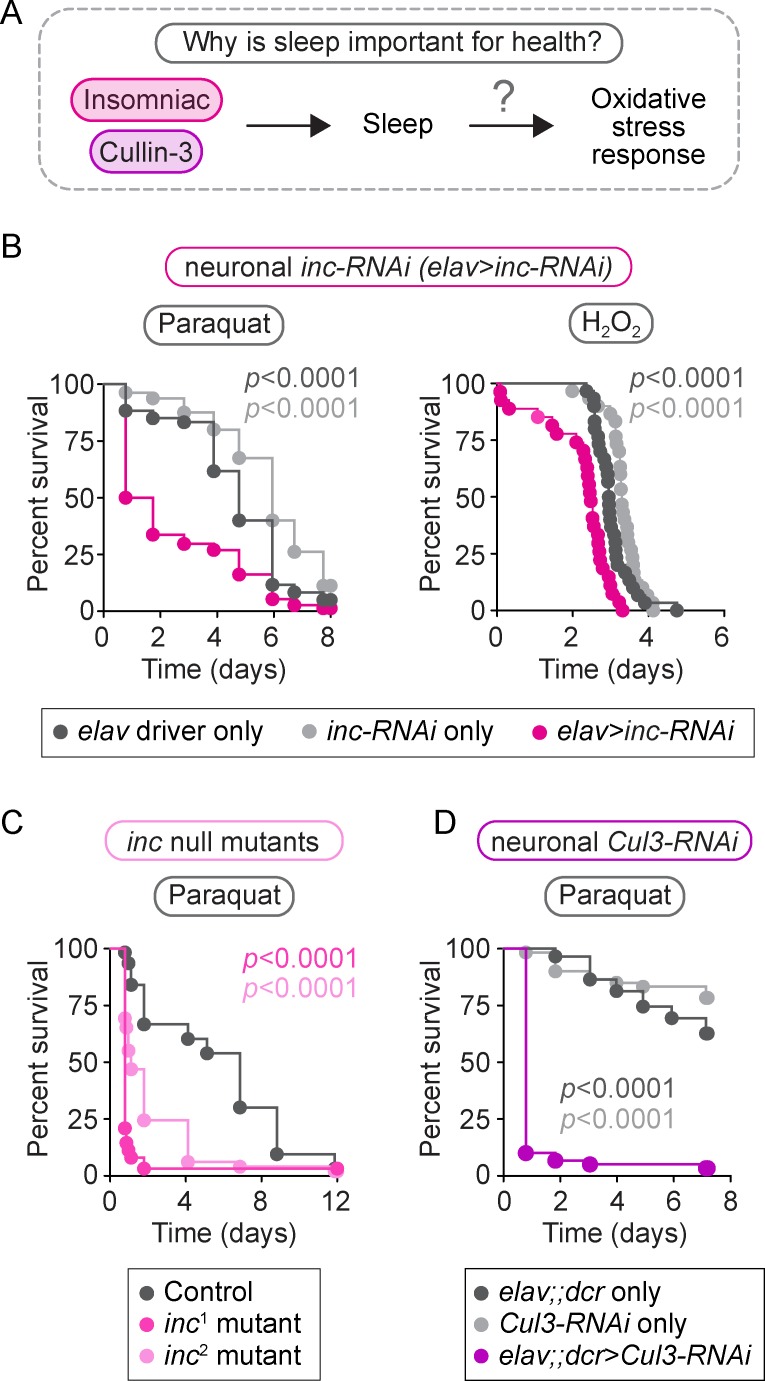
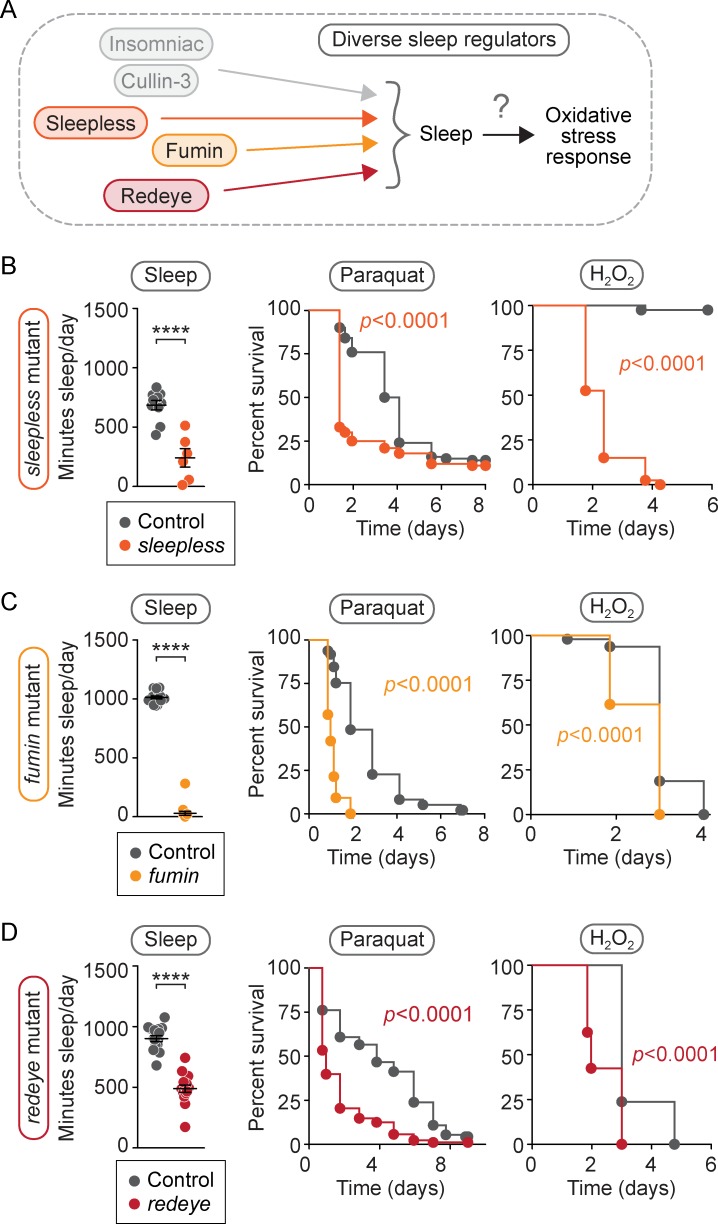
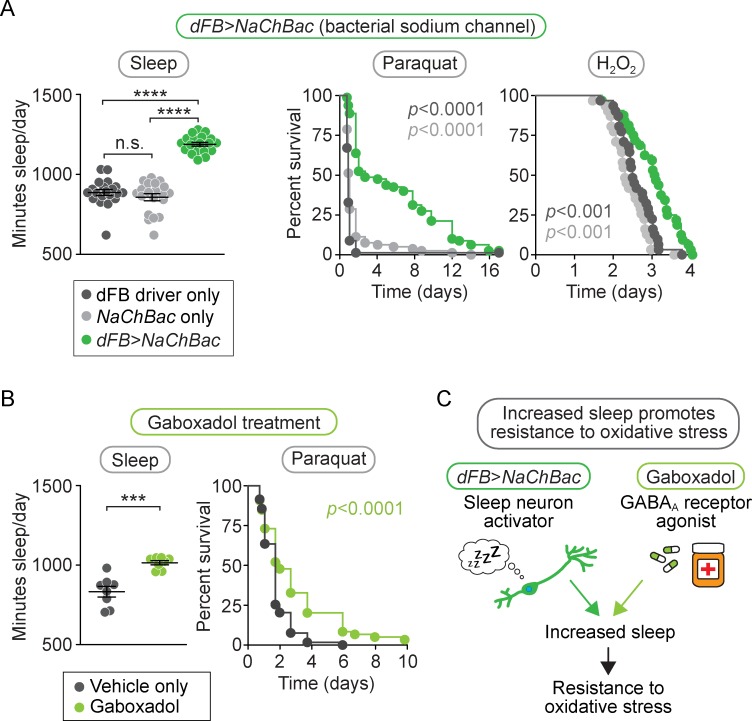
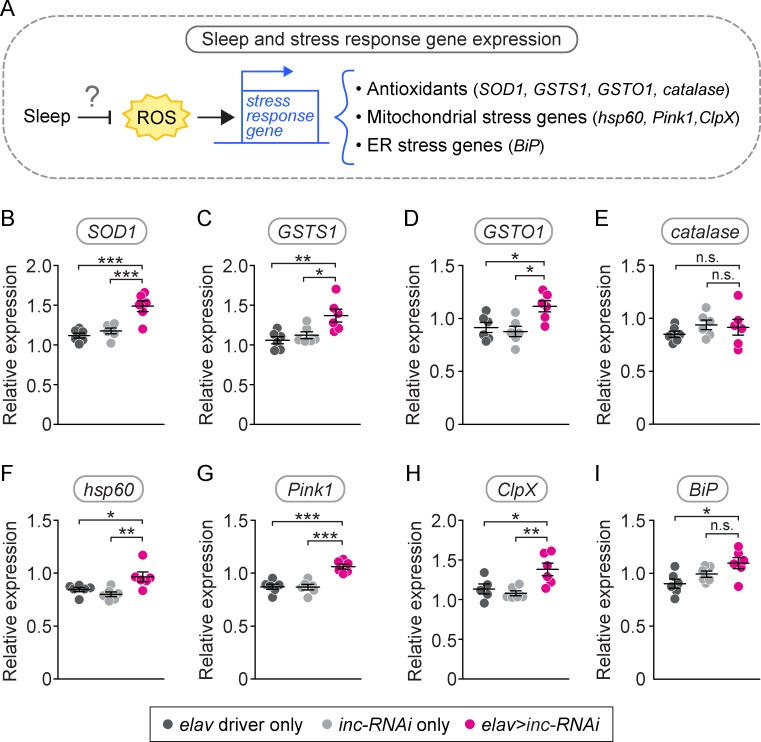
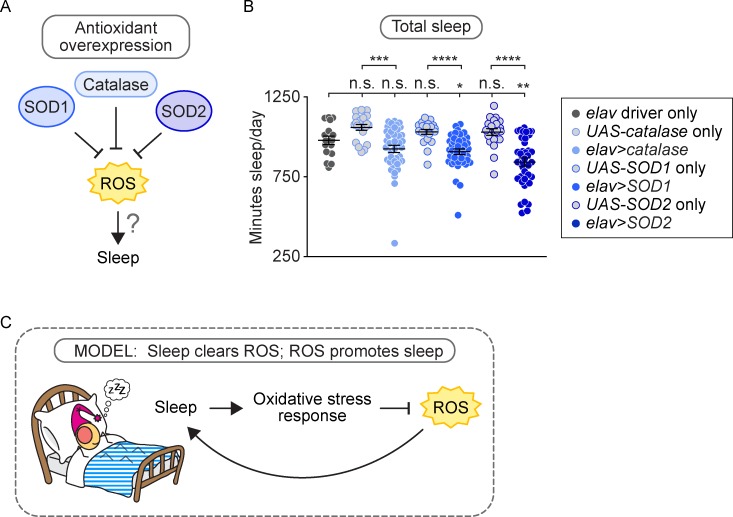
Although sleep appears to be broadly conserved in animals, the physiological functions of sleep remain unclear. In this study, we sought to identify a physiological defect common to a diverse group of short-sleeping Drosophila mutants, which might provide insight into the function and regulation of sleep. We found that these short-sleeping mutants share a common phenotype of sensitivity to acute oxidative stress, exhibiting shorter survival times than controls. We further showed that increasing sleep in wild-type flies using genetic or pharmacological approaches increases survival after oxidative challenge. Moreover, reducing oxidative stress in the neurons of wild-type flies by overexpression of antioxidant genes reduces the amount of sleep. Together, these results support the hypothesis that a key function of sleep is to defend against oxidative stress and also point to a reciprocal role for reactive oxygen species (ROS) in neurons in the regulation of sleep.


Conflict of interest statement

The authors have declared that no competing interests exist.

Figures

Fig 1
Fig 1. Neuronal inc-RNAi reduces sleep without affecting lifespan, metabolism, or immunity.
We investigated the importance of sleep in the health of neuronal inc-RNAi flies by examining three specific health parameters: lifespan, metabolism, and immunity (A). Relative to genetic controls, neuronal inc-RNAi flies slept 30% less than controls (B, p < 0.0001 compared to either control, n = 10–12 flies/genotype), displayed a normal lifespan (C, p > 0.05 compared to either control, n = 74–82 flies/genotype), died from starvation at an intermediate rate (D, p > 0.05 compared to driver control, p = 0.05 compared to inc-RNAi control, n = 20–24 flies/genotype), and died at the same rate as controls after injection with Streptococcus pneumoniae (E, p > 0.05 compared to either control, n = 59–60 flies/genotype) or Providencia rettgeri (F, p > 0.05 compared to either control, n = 60–63 flies/genotype). For the scatterplot in (B), each data point represents the average sleep in minutes/day, measured across 4–5 days for an individual animal. Data are shown as mean ± SEM. p-values were obtained by ordinary one-way ANOVA followed by a post hoc Tukey test when significance was detected (B) or by log-rank analysis (C–F). Data from representative experiments are shown. Lifespans were performed twice. All other experiments were performed at least three times. Raw data from representative experiments are available in S1 Data; raw data from all trials are available upon request. inc, insomniac; n.s., not significant p > 0.05; RNAi, RNA interference.
Fig 2
Fig 2. Reducing inc or Cul3 expression results in sensitivity to oxidative stress.
We investigated whether reduction of inc or Cul3, either of which causes short sleep, affects the oxidative stress response (A). Neuronal inc-RNAi flies died faster than controls after paraquat injection (B, left panel, p < 0.0001 compared to either control, n = 60–80 flies/genotype) and H2O2 feeding (B, right panel, p < 0.0001 compared to either control, n = 27–30 flies/genotype). Similar sensitivity to paraquat was observed in inc1 and inc2 null mutants (C, p < 0.0001 for both mutants compared to control, n = 49–63 flies/genotype) and neuronal Cul3-RNAi flies (D, p < 0.0001 compared to either control, n = 59–60 flies/genotype). p-values were obtained by log-rank analysis. Data from representative experiments are shown. Each experiment was performed at least three times. Raw data from representative experiments are available in S1 Data; raw data from all trials are available upon request. Cul3, Cullin-3; dcr, UAS-Dicer; inc, insomniac; RNAi, RNA interference.
Fig 3
Fig 3. A diverse group of short-sleeping mutants is sensitive to oxidative stress.
We asked (A) whether other sleep mutants unrelated to inc or Cul3 share the same sensitivity to oxidative stress. (B–D, left panels) We found that sleepless mutants slept 65% less than controls (B, p < 0.0001, n = 6–10 flies/genotype), fumin mutants slept 95% less than controls (C, p < 0.0001, n = 15–16 flies/genotype), and redeye mutants slept 50% less than controls (D, p < 0.0001, n = 16 flies/genotype). (B–D, middle panels) When injected with paraquat, sleepless mutants (B, p < 0.0001, n = 100 flies/genotype), fumin mutants (C, p < 0.0001, n = 97–98 flies/genotype), and redeye mutants (D, p < 0.0001, n = 88–92 flies/genotype) died faster than controls. (B–D, right panels) Faster death kinetics were also observed after H2O2 feeding relative to controls for sleepless mutants (B, p < 0.0001, n = 40 flies/genotype), fumin mutants (C, p < 0.0001, n = 39–40 flies/genotype), and redeye mutants (D, p < 0.0001, n = 39–42 flies/genotype). For scatterplots (B–D), each data point represents the average sleep in minutes/day measured across 4–5 days for an individual animal. Data are shown as mean ± SEM and p-values were obtained by ordinary one-way ANOVA followed by a post hoc Tukey test when significance was detected. For survival curves (B–D), p-values were obtained by log-rank analysis. Data from representative experiments are shown. Each experiment was performed at least three times. Raw data from representative experiments are available in S1 Data; raw data from all trials are available upon request. Cul3, Cullin-3; inc, insomniac.
Fig 4
Fig 4. Inducing sleep increases resistance to oxidative stress.
(A) dFB>NaChBac flies slept 40% more than controls (left panel, p < 0.0001 compared to either control, n = 20 flies/genotype) and died slower than controls after either paraquat injection (middle panel, p < 0.0001 compared to either control, n = 79–80 flies/genotype) or H2O2 feeding (right panel, p < 0.001 compared to either control, n = 31–32 flies/genotype). (B) Flies fed the GABAA agonist Gaboxadol slept 25% more than controls (left panel, p < 0.001, n = 8 flies/condition) and died slower than controls after paraquat injection (right panel, p < 0.0001, n = 118–119 flies/condition). These data support the conclusion (C) that inducing sleep by either genetic or pharmacological means confers oxidative stress resistance. For scatterplots (A–B, left panels), each data point represents average sleep in minutes/day measured across 4–5 days in an individual animal; data are shown as mean ± SEM. p-values were obtained by ordinary one-way ANOVA followed by a post hoc Tukey test when significance was detected (A–B, left panels) or by log-rank analysis (A–B, middle and right panels). Data from representative experiments are shown. Each experiment was performed at least three times. Raw data from representative experiments are available in S1 Data; raw data from all trials are available upon request. dFB, dorsal Fan-shaped Body; GABAA, γ-aminobutyric acid-A.
Fig 5
Fig 5. Neuronal inc-RNAi heads have increased expression of stress response genes.
We investigated whether short sleep affects the expression of three main groups of stress response genes: antioxidant genes, mitochondrial stress genes, and one ER stress gene (A). Neuronal inc-RNAi flies exhibited increased baseline head expression of antioxidant genes SOD1 (B, p < 0.001 compared either control, n = 6 biological replicates per genotype), GSTS1 (C, p < 0.05 compared to either control, n = 6 biological replicates per genotype), and GSTO1 (D, p < 0.05 compared to either control, n = 6 biological replicates per genotype), but normal expression of catalase (E, p > 0.05 compared to either control, n = 6 biological replicates per genotype). Neuronal inc-RNAi flies also exhibited increased basal head expression of mitochondrial stress genes hsp60 (F, p < 0.05 compared to either control, n = 6 biological replicates per genotype), Pink1 (G, p < 0.001 compared to either control, n = 6 biological replicates per genotype), and ClpX (H, p < 0.05 compared to either control, n = 5–6 biological replicates per genotype). The ER chaperone gene BiP was elevated compared to one, but not both, controls (p < 0.05 compared to elav control, p > 0.05 compared to inc-RNAi control, n = 6 biological replicates per genotype). Expression was normalized to actin. Data are shown as mean ± SEM. Each data point represents an independent biological replicate with 15–20 individual fly heads per biological replicate. p-values were obtained by ordinary one-way ANOVA followed by a post hoc Tukey test when significance was detected. Raw data from representative experiments are available in S1 Data; raw data from all trials are available upon request. ER, endoplasmic reticulum; GST, glutathione-S-transferase; hsp60, heatshock protein 60; Pink1, PTEN-induced putative kinase 1; inc, insomniac; RNAi, RNA interference; SOD1, superoxide dismutase 1.
Fig 6
Fig 6. Neuronal overexpression of antioxidants reduces sleep, suggesting a role for ROS in sleep regulation.
(A) Neuronal overexpression of the antioxidant genes SOD1 and SOD2 reduced sleep by 10% (B, p < 0.05 compared to either control, n = 16–40 flies/genotype) and 16% (p < 0.01 compared to either control, n = 16–38 flies/genotype), respectively. Neuronal overexpression of catalase also reduced sleep, but the decrease was not statistically significant compared to the driver control (p > 0.05 compared to elav control, p < 0.001 compared to catalase control, n = 16–40 flies/genotype). Each data point represents average sleep in minutes/day measured across 5 days in an individual animal; data are shown as mean ± SEM. p-values were obtained by ordinary one-way ANOVA followed by a post hoc Tukey test when significance was detected. Pooled data from two independent experiments are shown. (B) Model: high ROS levels promote sleep, which in turn clears ROS to promote wake. Raw data from representative experiments are available in S1 Data; raw data from all trials are available upon request. ROS, reactive oxygen species; SOD, superoxide dismutase.

References

    1. Campbell SS, Tobler I. Animal sleep: A review of sleep duration across phylogeny. Neurosci Biobehav Rev. 1984;8: 269–300. 10.1016/0149-7634(84)90054-X - DOI - PubMed
    1. Cirelli C, Tononi G. Is sleep essential? PLoS Biol. 2008;6: 1605–1611. 10.1371/journal.pbio.0060216 - DOI - PMC - PubMed
    1. Joiner WJ. Unraveling the Evolutionary Determinants of Sleep. Curr Biol. Elsevier Ltd; 2016;26: R1073—R1087. 10.1016/j.cub.2016.08.068 - DOI - PMC - PubMed
    1. Huber R, Hill SL, Holladay C, Biesiadecki M, Tononi G, Cirelli C. Sleep homeostasis in Drosophila melanogaster. Sleep. 2004;27: 628–639. 10.1093/sleep/27.4.628 - DOI - PubMed
    1. Sauer S, Herrmann E, Kaiser W. Sleep deprivation in honey bees. J Sleep Res. 2004;13: 145–152. 10.1111/j.1365-2869.2004.00393.x - DOI - PubMed

Publication types