. 2018 Jul 13;19(1):262.
doi: 10.1186/s12859-018-2263-6.

Alternative empirical Bayes models for adjusting for batch effects in genomic studies

Affiliations

Alternative empirical Bayes models for adjusting for batch effects in genomic studies

Yuqing Zhang et al. BMC Bioinformatics. .

Abstract

Background: Combining genomic data sets from multiple studies is advantageous to increase statistical power in studies where logistical considerations restrict sample size or require the sequential generation of data. However, significant technical heterogeneity is commonly observed across multiple batches of data that are generated from different processing or reagent batches, experimenters, protocols, or profiling platforms. These so-called batch effects often confound true biological relationships in the data, reducing the power benefits of combining multiple batches, and may even lead to spurious results in some combined studies. Therefore there is significant need for effective methods and software tools that account for batch effects in high-throughput genomic studies.

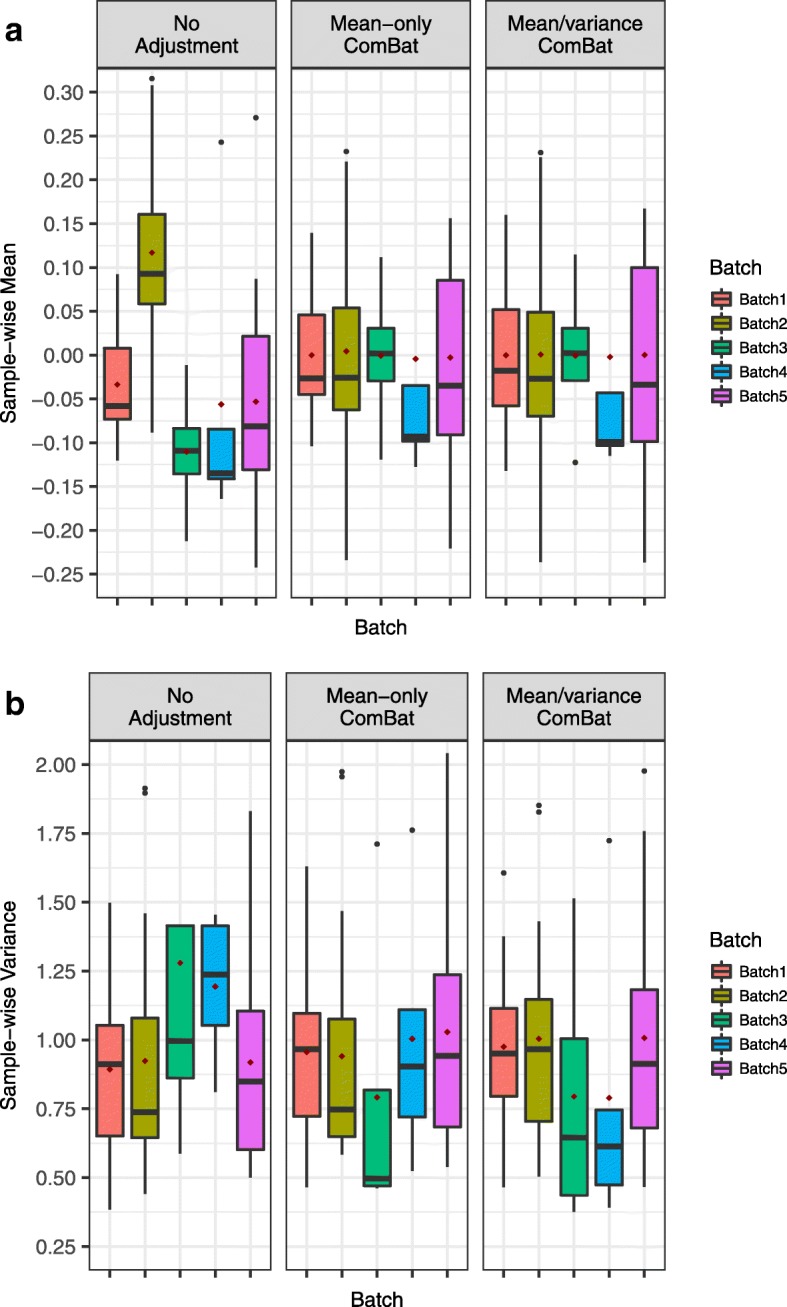
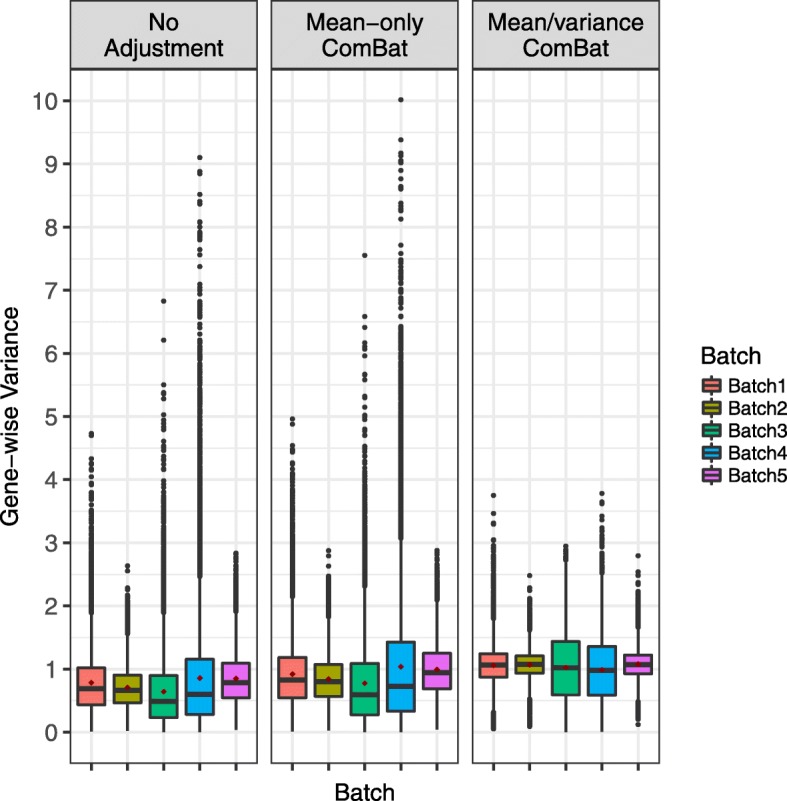
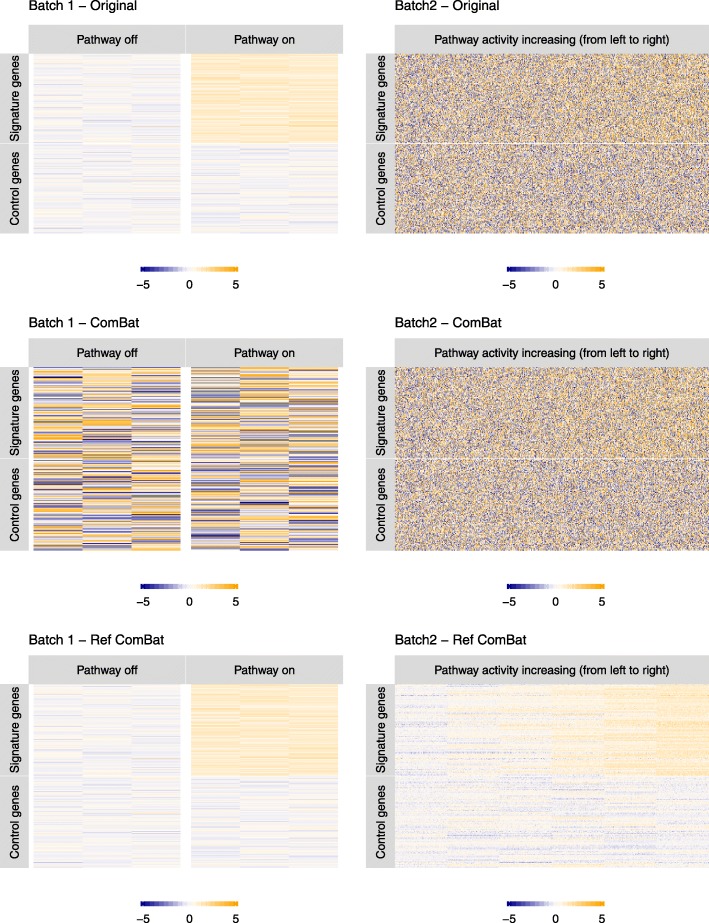
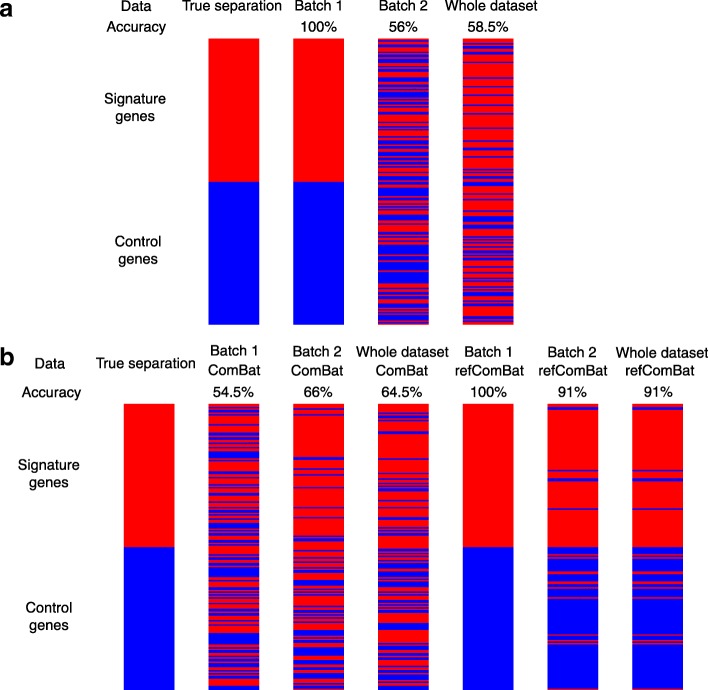
Results: Here we contribute multiple methods and software tools for improved combination and analysis of data from multiple batches. In particular, we provide batch effect solutions for cases where the severity of the batch effects is not extreme, and for cases where one high-quality batch can serve as a reference, such as the training set in a biomarker study. We illustrate our approaches and software in both simulated and real data scenarios.

Conclusions: We demonstrate the value of these new contributions compared to currently established approaches in the specified batch correction situations.

Keywords: Batch effects; Biomarker development; Data integration; Empirical Bayes models.


Conflict of interest statement

Ethics approval and consent to participate

Not applicable.

Consent for publication

Not applicable.

Competing interests

The authors declare that they have no competing interests.

Publisher’s Note

Springer Nature remains neutral with regard to jurisdictional claims in published maps and institutional affiliations.

Figures

Fig. 1
Fig. 1
Distribution of sample-wise mean and variance estimates from each batch in the bladder cancer data. Estimates are calculated within each sample as previously described. a Boxplots of sample-wise mean estimates (γ¯ij, as in Eq. (3)) within each batch. The sample-wise mean estimates for batch 2 in the unadjusted data are significantly different from the other batches. Both mean-only and mean/variance ComBat adequately correct this batch 2 mean difference. b Boxplots of sample-wise variance estimates across batches. The sample-wise variance estimates are not significantly different in the unadjusted data. Adjusting either just the mean or both mean and variance does not makes the estimates more similarly distributed, meaning that adjusting the variance is not necessary
Fig. 2
Fig. 2
Distribution of gene-wise variance estimates from each batch in the bladder cancer data. Batch 3 and batch 4 have smaller sample size than the other batches, thus their variance estimates are impacted more by outlying samples. Mean/variance ComBat brings all estimates to the same levels, over correcting the variance estimates in batches 3 and 4. This leads to unwanted, less variable gene expression (see Additional file 1: Figure S1). Mean-only ComBat does not affect or overcorrect the variance estimates
Fig. 3
Fig. 3
Distributions of higher order moments in the bladder cancer dataset after the mean/variance adjustment. The current mean/variance ComBat does not adjust higher order moments, thus distributions of these moment estimates remain significantly different (a sample-wise kurtosis: P=3.025e−05 using non-robust test; b gene-wise skewness: P=0; c gene-wise kurtosis: P=0.0012 using robust test) across batches even after batch adjustment. These may cause problems in downstream analysis such as prediction tasks, and call for batch correction methods that adjust the higher order moments
Fig. 4
Fig. 4
Simulated pathway datasets before and after batch correction using original and reference-batch ComBat. The figure shows the heatmaps of the gene-by-sample expression matrices for the two simulated batches. Pathway activation levels are included as covariates in the two versions of ComBat. Batch 1 is less variable than batch 2, and is better in quality for identifying signatures for the pathway. Using the original ComBat does not remove the variance in batch 2. Instead, it causes a severe loss of signal in batch 1 by inflating the variance. Reference-batch ComBat does not change the chosen reference (batch 1) and leads to clearer signal detection in batch 2
Fig. 5
Fig. 5
Cluster assignment of the 200 genes using k-means algorithm, where k=2. Color bars show the 200 genes from top to bottom, which corresponds to the gene labels in Fig. 4. The red and blue bars represent signature and control genes, respectively. During batch adjustment, true activation levels are included as covariates, as opposed to using no covariates in both versions of ComBat (Additional file 1: Figure S6). In the batch adjusted data, we first clustered genes into 2 groups without specifying the group sizes or labels. Then, clusters are assigned as signature and control by how it best accords with the original separation. a In batch 1, genes are correctly separated. But combining batch 2 with batch 1 without ComBat adjustment changes the signature / non-signature separation. Only 58.5% genes remain the same in the combined dataset. b Reference-batch ComBat gives cluster assignment that is more consistent with the true separation than original ComBat, in batch 1 only, batch 2 only, and the combined dataset of batch 1 and 2. These results suggest that the original ComBat breaks the similarity between genes in the same group (signature or control), where similarity is measured by the Euclidean distance. Only reference-batch ComBat is able to preserve this similarity

References

    1. Soon WW, Hariharan M, Snyder MP. High-throughput sequencing for biology and medicine. Mol Syst Biol. 2013;9(1):640. doi: 10.1038/msb.2012.61. - DOI - PMC - PubMed
    1. Reuter JA, Spacek DV, Snyder MP. High-throughput sequencing technologies. Mol Cell. 2015;58(4):586–97. doi: 10.1016/j.molcel.2015.05.004. - DOI - PMC - PubMed
    1. Van Dijk EL, Auger H, Jaszczyszyn Y, Thermes C. Ten years of next-generation sequencing technology. Trends Genet. 2014;30(9):418–26. doi: 10.1016/j.tig.2014.07.001. - DOI - PubMed
    1. Tomczak K, Czerwińska P, Wiznerowicz M. The cancer genome atlas (tcga): an immeasurable source of knowledge. Contemp Oncol. 2015;19(1A):68. - PMC - PubMed
    1. Kupfer P, Guthke R, Pohlers D, Huber R, Koczan D, Kinne RW. Batch correction of microarray data substantially improves the identification of genes differentially expressed in rheumatoid arthritis and osteoarthritis. BMC Med Genom. 2012;5(1):23. doi: 10.1186/1755-8794-5-23. - DOI - PMC - PubMed

Publication types