. 2018 Sep;210(1):113-128.
doi: 10.1534/genetics.118.301202. Epub 2018 Jul 12.

Chromatin Loop Formation Induced by a Subtelomeric Protosilencer Represses EPA Genes in Candida glabrata

Affiliations

Chromatin Loop Formation Induced by a Subtelomeric Protosilencer Represses EPA Genes in Candida glabrata

Eunice López-Fuentes et al. Genetics. 2018 Sep.

Abstract

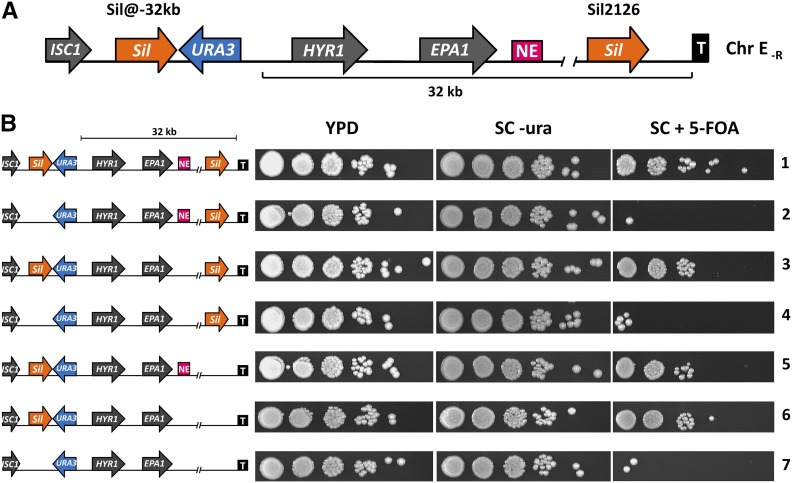
Adherence, an important virulence factor, is mediated by the EPA (Epithelial Adhesin) genes in the opportunistic pathogen Candida glabrata Expression of adhesin-encoding genes requires tight regulation to respond to harsh environmental conditions within the host. The majority of EPA genes are localized in subtelomeric regions regulated by subtelomeric silencing, which depends mainly on Rap1 and the Sir proteins. In vitro adhesion to epithelial cells is primarily mediated by Epa1. EPA1 forms a cluster with EPA2 and EPA3 in the right telomere of chromosome E (E-R). This telomere contains a cis-acting regulatory element, the protosilencer Sil2126 between EPA3 and the telomere. Interestingly, Sil2126 is only active in the context of its native telomere. Replacement of the intergenic regions between EPA genes in E-R revealed that cis-acting elements between EPA2 and EPA3 are required for Sil2126 activity when placed 32 kb away from the telomere (Sil@-32kb). Sil2126 contains several putative binding sites for Rap1 and Abf1, and its activity depends on these proteins. Indeed, Sil2126 binds Rap1 and Abf1 at its native position and also when inserted at -32 kb, a silencing-free environment in the parental strain. In addition, we found that Sil@-32kb and Sil2126 at its native position can physically interact with the intergenic regions between EPA1-EPA2 and EPA2-EPA3 respectively, by chromosome conformation capture assays. We speculate that Rap1 and Abf1 bound to Sil2126 can recruit the Silent Information Regulator complex, and together mediate silencing in this region, probably through the formation of a chromatin loop.

Keywords: Candida glabrata; EPA genes; Rap1; chromatin loop; cis-elements; protosilencer; transcriptional regulation.


Figures

Figure 1
Figure 1
Sil2126 requires the context of telomere (T) E-R. (A) Map of the T E-R showing the relevant cis-acting elements and the proteins required for subtelomeric silencing. This region contains the EPA1, EPA2, and EPA3 genes indicated by arrows. The protosilencer Sil2126 is drawn as an orange arrow between EPA3 and the T. Rap1 (red circle) binds to the T repeats, and recruits the SIR complex (Sir2, Sir3, and Sir4) and Rif1 (green rectangle). A second cis-acting element called the negative element (NE, represented as a pink rectangle) represses EPA1 expression in a promoter-dependent way and requires the yKu proteins (yKu70 and yKU80). Silencing can spread from the T, with the contribution of the protosilencer Sil2126, to up to > 20 kb to the EPA1 gene. (B) Top: schematic representation of the Sil-reporter system consisting of a PCR product containing a 665-bp integration region (gray box), cloned immediately adjacent to the 5′ end of the Sil2126 element, followed by the URA3 reporter gene with its own promoter. Middle: Sil2126 integrated between ISC1 and HYR1, which is 32 kb from the right T of chromosome (Chr) E (E-R, Sil@-32kb); the SpeI site used to linearize and integrate the vector, is indicated. Only the genes from ISC1 to EPA1 are shown. Note the discontinuity from the NE close to the 3′ UTR of EPA1 up to the native Sil2126 element near the T. Bottom: the Sil-reporter system was integrated in different chromosomes at similar distances from the indicated T (shown to the left of each line). In Chr E-R, the Sil-reporter system (line 1) and the negative control (sil-) consisting only of the URA3 reporter (line 2) was integrated at −32 kb. The Sil-reporter system in Chr C-L was integrated at −26 kb from the T (line 3); in Chr I-L, at −23 kb (line 4); and in Chr K-R, at −19 kb (line 5) from the T. The level of silencing of the URA3 reporter was tested using a growth plate assay on SC –ura or SC + 5-FOA plates. The number of viable cells used for each experiment is estimated by the growth on rich YPD media. Strains were grown to stationary phase in YPD, after which 10-fold serial dilutions were made in sterile water and equal numbers of cells were spotted onto the indicated plates. Plates were incubated for 48 hr at 30° and photographed.
Figure 2
Figure 2
The negative element (NE) is not required for Sil@-32kb activity at the right telomere (T) of chromosome (Chr) E. (A) Schematic representation of Sil@-32kb and the URA3 reporter integrated in the right T of Chr E (Chr E-R) between the ISC1 and HYR1 genes in the parental strain. The NE is shown as a pink square downstream from EPA1 and Sil2126 is represented as an orange arrow. Note the discontinuity from the NE close to the 3′ UTR of EPA1 up to the native Sil2126 element near the T. (B) Assessment of the level of silencing of the URA3 reporter in strains with deletions of cis-acting elements (Sil2126 and NE) using a growth plate assay on the indicated media. The genomic structure at the subtelomeric region of T ER for each strain tested is shown to the left of each line. Note that the insertion of Sil@-32kb generates a duplication of Sil2126 in this region. Lines 1–4 show the silencing activity of Sil@-32kb in the presence or absence of the NE. Lines 5–7 show the silencing activity of derivatives of these strains in which the native copy of Sil2126 has been deleted. Strains were grown to stationary phase in YPD, diluted, and spotted on the media indicated as described in Figure 1B.
Figure 3
Figure 3
The EPA2-EPA3 intergenic region is required for Sil@-32kb activity. (A) Top: schematic representation of Sil@-32kb and the URA3 reporter integrated in the right telomere of chromosome (Chr) E (Chr E-R) between the ISC1 and HYR1 genes in the sil∆ strain. (A) Bottom: silencing activity of Sil@-32kb in strains with a replacement of the EPA1-EPA2 and EPA2-EPA3 intergenic regions, and in the absence of the native Sil2126 element. Schematic representation of the genetic structure at telomere (T) E-R in each strain evaluated is shown on the left side. The wavy line represents the replacement of the indicated intergenic region by vector sequences. The distance between genes was maintained. Each strain contains a different combination of the intergenic region replacements. Note the discontinuity from the EPA1 promoter up to the −32kb region where Sil@-32kb is inserted. (B) Top: Schematic representation of Sil@-32kb and the URA3 reporter integrated in T E-R between the ISC1 and HYR1 genes in the parental strain (note that this strain contains a duplication of Sil2126). Bottom: silencing activity of Sil@-32kb in strains with a replacement of the intergenic regions between EPA genes [as in (A), bottom]. The level of silencing in each strain is shown on the right, as assessed by growth on 5-FOA plates as described in Figure 1B. NE, negative element.
Figure 4
Figure 4
The binding sites for Rap1 and Abf1 are required for Sil@-32kb activity. (A) Schematic representation of Sil@-32kb and the URA3 reporter integrated in the right telomere (T) of chromosome (Chr) E (Chr E-R), between the ISC1 and HYR1 genes in the absence of the original copy of Sil2126 between EPA3 and the T (sil∆). (B) Level of silencing of several Sil2126 deletions of Rap1 and Abf1 putative binding sites. The control strains (Sil@-32kb-URA3 reporter and only the URA3 reporter integrated −32 kb from T E-R) are shown in lines 1 and 2. The orange rectangles represent the different deletions of Sil2126. Numbers on the rectangles indicate the end nucleotide position of each version of Sil2126 deletions. All constructs were integrated −32 kb from T E-R. Rap1- and Abf1-binding sites are represented by red and green rectangles, respectively. Equal numbers of cells of each strain were spotted on each media to assess the level of silencing as described in Figure 1B. NE, negative element.
Figure 5
Figure 5
Rap1 and Abf1 are recruited to Sil2126, and at several positions throughout the subtelomeric region of chromosome (Chr) E-R. (A) Top, middle, and bottom right: map of the right telomere (T) of Chr E-R showing Rap1 (red vertical lines) and Abf1 (green vertical lines) putative binding sites. Lines are drawn above or under the map to indicate the DNA strand on which the putative binding sites are localized. Bottom right: we used the indicated S. cerevisiae consensus binding sites for Rap1 and Abf1 to predict the putative binding sites in C. glabrata using the JASPAR 2016 server. Bottom left: schematic representation of the tagged versions of Rap1 and Abf1 used for chromatin immunoprecipitation (ChIP) experiments. Rap1 was fused with the Flag epitope at the C-terminal end and the wild-type allele was replaced by the tagged version in its original chromosomal location. The Abf1 construct is provided on a replicative plasmid in which Abf1 is fused to the c-Myc epitope at the N-terminal end. The fusion is driven by the inducible promoter PMT1, which is induced in the presence of copper. (B and C) Rap1 is recruited by Sil2126 at its native position and/or propagated from the T. Top: schematic representation of Chr E-R indicating the regions tested in the ChIP assay. Each amplified fragment with the corresponding primer set is numbered and the numbers correspond to each bar in the graph; the arrows indicate the position where the quantitative PCR (qPCR) primers anneal. The distance from Sil2126 to the T is indicated. Bottom: Rap1-Flag and cMyc-Abf1 enrichment is represented as percentage of input relative to binding at ISC1 for Rap1 or at the telomere repeats for Abf1. Each column corresponds to the regions amplified by qPCR, represented in the Chr E-R map as numbered rectangles. The number of each primer set indicates the same region amplified across the different strains. The percentage of input was calculated by percent input method using the equation 100*2^[adjusted input to 100% - Ct (cycle threshold) (immunoprecipitate)]. (B) ChIP assay in the parental strain (Sil2126 in its original position). (C) ChIP assay in a sil∆ strain. NE, negative element.
Figure 6
Figure 6
Sil2126 can recruit Rap1 and Abf1 when inserted 32 kb away from the telomere (T). (A) Sil@-32kb can recruit Rap1 and Abf1. Top: schematic representation of the subtelomeric region of chromosome (Chr) E-R in the strain where the original copy of Sil2126 is deleted and the Sil@-32kb-URA3 reporter is inserted at Chr E-R. The position of the fragments amplified with the indicated primer sets for the chromatin immunoprecipitation assays is indicated below the map. Each amplified fragment with the corresponding primer set is numbered, and the numbers correspond to each bar in the graphs in all panels and to Figure 5. Bottom: Rap1-Flag and cMyc-Abf1 enrichment represented as percentage of input relative to binding at ISC1 for Rap1 or at the T repeats for Abf1, which was calculated as described in Figure 5B. (B) Rap1-Flag and cMyc-Abf1 are recruited at −32 kb in the absence of the EPA2-EPA3 intergenic region. Top: schematic representation of Chr E-R in the absence of the original copy of Sil2126 and with a replacement of the EPA2-EPA3 intergenic region by vector sequences (represented by the wavy line). The regions tested are indicated as described for (A) and correspond to the bars in the graph. Bottom: Rap1-Flag and cMyc-Abf1 enrichment represented as percentage of input, as in Figure 5B. (C) There is a higher enrichment of Rap1-Flag and cMyc-Abf1 when a 5′ fragment of Sil2126 (334 bp) containing the putative Abf1- and Rap1-binding sites is integrated at −32 kb. Top: schematic representation of the subtelomeric region of Chr E-R in the strain in which a 334-bp fragment from the 5′ end of Sil2126 was inserted at −32 kb, followed by the URA3 reporter. The regions tested by qPCR are indicated as described for (A) and correspond to the bars in the graph. Bottom: Rap1-Flag and cMyc-Abf1 enrichment is represented as percentage of input, as described in Figure 5B. NE, negative element.
Figure 7
Figure 7
Sil2126 placed at −32 kb interacts with a fragment downstream of EPA1 to propagate silencing, and Sil2126 in its native position interacts with the EPA2-EPA3 intergenic region. (A) Top: chromosome (Chr) conformation capture (3C) analysis represented by cross-linking frequencies throughout the Chr E-R in derivatives of the sil∆ strain. Each point in the graph represents the cross-linking frequency of each HindIII fragment tested in the different locations across the subtelomeric region. The cross-linking frequencies in a strain with Sil@-32kb is represented by the purple line, the strain with the deletion construct [sil(1-262)∆] inserted at −32 kb is represented by the green line, and the rap1-21 strain is represented by the red line. The silencing activity of these constructs is indicated. (A) Bottom: schematic representation of the telomere (Tel) E-R with the Sil@-32kb and the URA3 reporter inserted at −32 kb. The arrowheads above the map represent the primers used in combination with the anchor H and the TaqMan probe H located in Sil2126 (also indicated as blue and pink arrowheads, respectively). The digestion sites of the restriction enzyme (HindIII) are indicated (H1–H9). (B) Top: 3C analysis shown as cross-linking frequencies throughout Chr E-R in the parental strain with Sil2126 at is native locus. Each point in the graph represents the cross-linking frequency of each HindIII fragment tested in the different locations across the subtelomeric region. The cross-linking frequencies in the parental strain with Sil2126 at its native locus are represented by the orange line. Bottom: schematic representation of the telomere E-R in the parental strain. The arrowheads above the map represent the primers used in combination with the anchor H and the TaqMan probe H located in Sil2126 (also indicated as blue and pink arrowheads, respectively). The location and numbers of the primers correspond to the primers in (A). Note that the y-axis is discontinuous.
Figure 8
Figure 8
EPA1 expression is not induced when Sil@-32kb and the URA3 reporter are placed −32 kb from the T E-R. Activity of the EPA1 promoter as measured by FACS. Strains were grown in SC medium supplemented with 25 mg/liter uracil for 48 hr at 30°. Cells were diluted into fresh medium and samples were taken every 2 hr. Schematic representation of the genetic structure at telomere E-R in each strain evaluated is shown on the right side. Figure S9 shows the histograms corresponding to the last strain in the graph. NE, negative element; T, telomere.
Figure 9
Figure 9
Models for alternative silenced superstructures formed in two strains: a sil∆ strain with a cis-acting element Sil2126 inserted at −32 kb (Sil@-32kb) and in the parental strain with Sil2126 at its native position. (A) Proposed DNA loops formed in the sil∆ strain with Sil@-32kb. The protosilencer Sil@-32kb and the EPA1-EPA2 intergenic region interact to form a loop. This structure is probably formed through the interaction between different silencing proteins—Rap1, Abf1, and the SIR complex—to maintain a silenced superstructure. The silencing can propagate up to 32 kb due to the presence of Sil2126 at this position, which presumably would act by recruiting Rap1 and Abf1 proteins. The SIR complex is represented by: light blue circles (Sir2), purple ovals (Sir3), and dark blue ovals (Sir4). Rap1 is represented as red ovals, the Ku proteins (yKu70 and yKu80) are represented as a yellow circle, and Abf1 as green ovals. EPA genes are represented as gray arrows and Sil2126 as an orange arrow. The model shows another proposed loop formed between the telomere and the NE in this strain. This loop is inferred from genetic data showing that silencing from the telomere directly affects EPA1 expression (Gallegos-García et al. 2012). (B) Proposed chromatin loop formed between Sil2126 at is native position and the cis-acting elements in the EPA2-EPA3 intergenic region in the parental strain. Silencing proteins are represented in the same way as (A). Chr, chromosome; NE, negative element.

Similar articles

Cited by

References

    1. Andrulis E. D., Neiman A. M., Zappulla D. C., Sternglanz R., 1998. Perinuclear localization of chromatin facilitates transcriptional silencing. Nature 394: 592–595. 10.1038/29100 - DOI - PubMed
    1. Ausubel, F. M., Brent R., Kingston R. E., Moore D. D., Seidman J. G. et al. , (Editors) 2001. Current Protocols in Molecular Biology. John Wiley & Sons, Hoboken, NJ.
    1. Baur J. A., Zou Y., Shay J. W., Wright W. E., 2001. Telomere position effect in human cells. Science 292: 2075–2077. 10.1126/science.1062329 - DOI - PubMed
    1. Behrouzi R., Lu C., Currie M., Jih G., Iglesias N., et al. , 2016. Heterochromatin assembly by interrupted Sir3 bridges across neighboring nucleosomes. Elife 5: e17556 10.7554/eLife.17556 - DOI - PMC - PubMed
    1. Belton J.-M., Dekker J., 2015a Randomized ligation control for chromosome conformation capture. Cold Spring Harb. Protoc. 2015: 587–592. 10.1101/pdb.prot085183 - DOI - PubMed

Publication types

MeSH terms