. 2018 Dec;67(12):2541-2553.
doi: 10.2337/db17-1378. Epub 2018 Jul 12.

miR-30a Remodels Subcutaneous Adipose Tissue Inflammation to Improve Insulin Sensitivity in Obesity

Affiliations

miR-30a Remodels Subcutaneous Adipose Tissue Inflammation to Improve Insulin Sensitivity in Obesity

Eun-Hee Koh et al. Diabetes. 2018 Dec.

Abstract

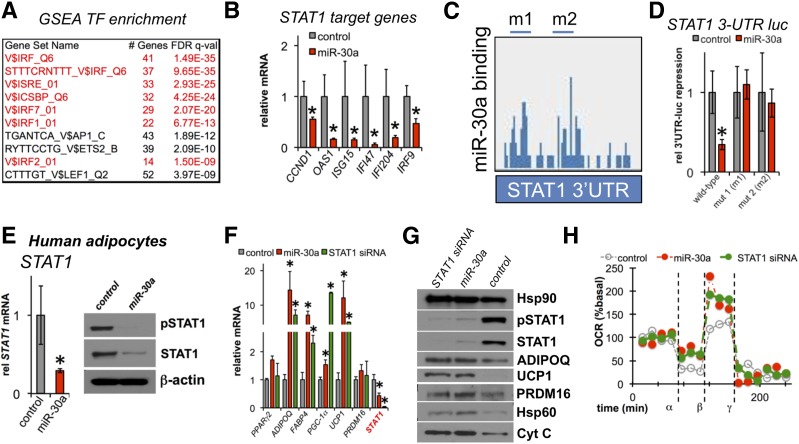
Chronic inflammation accompanies obesity and limits subcutaneous white adipose tissue (WAT) expandability, accelerating the development of insulin resistance and type 2 diabetes mellitus. MicroRNAs (miRNAs) influence expression of many metabolic genes in fat cells, but physiological roles in WAT remain poorly characterized. Here, we report that expression of the miRNA miR-30a in subcutaneous WAT corresponds with insulin sensitivity in obese mice and humans. To examine the hypothesis that restoration of miR-30a expression in WAT improves insulin sensitivity, we injected adenovirus (Adv) expressing miR-30a into the subcutaneous fat pad of diabetic mice. Exogenous miR-30a expression in the subcutaneous WAT depot of obese mice coupled improved insulin sensitivity and increased energy expenditure with decreased ectopic fat deposition in the liver and reduced WAT inflammation. High-throughput proteomic profiling and RNA-Seq suggested that miR-30a targets the transcription factor STAT1 to limit the actions of the proinflammatory cytokine interferon-γ (IFN-γ) that would otherwise restrict WAT expansion and decrease insulin sensitivity. We further demonstrated that miR-30a opposes the actions of IFN-γ, suggesting an important role for miR-30a in defending adipocytes against proinflammatory cytokines that reduce peripheral insulin sensitivity. Together, our data identify a critical molecular signaling axis, elements of which are involved in uncoupling obesity from metabolic dysfunction.


Figures

Figure 1
Figure 1
miR-30a expression in adipose tissue correlates with insulin sensitivity. A: qPCR was used to determine miR-30a expression levels in subcutaneous WAT isolated from male mice fed chow or HFD. Mice were fed chow or HFD for 12 weeks (n = 6/group). *P < 0.05. B: Relative miR-30a expression was measured in subcutaneous adipose tissue biopsied from obese (n = 12) and obese T2DM (n = 9) subjects. #P < 0.06. Data are represented as mean ± SEM. C: miR-30a expression is negatively correlated with HOMA-IR in human subjects.
Figure 2
Figure 2
Ectopic miR-30a expression in subcutaneous WAT improves insulin sensitivity. A: Adv-GFP or Adv-miR-30a was injected into the inguinal fat pad of DIO mice fed HFD for 16 weeks. miR-30a expression levels were confirmed using RNA (n = 5) isolated from iWAT (B), stromal vascular and adipocyte (WA) fractions (C), and liver (D). E: Body weight gain (% initial) was measured during ectopic miR-30a in iWAT. Two weeks after the initial injection, glucose metabolism was determined by glucose tolerance (F) and insulin tolerance (G) tests (n = 12 mice/group). Serum insulin levels (H) and HOMA-IR (I) were assessed in fasted mice (4 h) injected with Adv-miR-30a or Adv-GFP control (n = 12 mice/group). J: Mice expressing Adv-miR-30a or Adv-GFP in iWAT were fasted 4 h and tissues collected 10 min after PBS or insulin (0.5 units/kg). Western blot analysis and relative protein levels for pAkt (S473) and total Akt in iWAT and liver lysates. K: Liver sections were stained with Oil Red O to examine the effects of iWAT miR-30a overexpression in liver fat. L: qPCR was used to determine the expression of lipogenic genes in the liver. M: Reduced fat content in the liver was confirmed by measurement of hepatic triglycerides (TG). All data are expressed as mean ± SEM (n = 5). *P < 0.05.
Figure 3
Figure 3
miR-30a expression in iWAT of DIO mice improves energy balance. Body composition (A) and fat depot mass (normalized to body weight) (B) of DIO mice ectopically expressing Adv-GFP or Adv-miR-30a in iWAT. C: Energy expenditure (heat) during two complete 12-h light-dark cycles 11 days after local expression of Adv-GFP or Adv-miR-30a in iWAT of DIO mice. Average oxygen consumption (VO2) (D), carbon dioxide production (VCO2) (E), and respiratory exchange ratio (RER) (F) during the 12-h light-dark cycles were determined by Comprehensive Lab Animal Monitoring System (CLAMS). G: Cumulative food intake during CLAMS experiments (n = 5). H: Histology showing UCP1 immunostaining in iWAT of Adv-GFP or Adv-miR-30a DIO mice. Arrowheads indicate UCP1-positive cells. Scale bars, 50 μm. Adv-miR-30a expression in iWAT remodels adipocyte size (I) and restores expression of lipid metabolism genes (J) (n ≥ 4). All data are expressed as mean ± SEM. *P < 0.05. All metabolic cage measurements are presented on a per mouse basis. eWAT, epididymal WAT; fm, fat mass; IHC, immunohistochemistry; lbm, lean body mass; tbm, total body mass.
Figure 4
Figure 4
miR-30a ablates inflammation in the iWAT of diabetic mice. A: Immunohistochemistry (IHC) staining for resident proinflammatory macrophages in iWAT from DIO mice treated with local Adv-GFP or Adv-miR-30a injection. Scale bars, 50 μm. B: RPPA profiling performed 7 and 30 days after iWAT Adv-GFP or Adv-miR-30a injections. Antibody probes that show statistically significant change at 7 days are shown. Each column represents three mice per group. C: Western blotting with indicated antibodies to validate RPPA results or other miR-30a targets with independent iWAT lysates. D: RNA-Seq coupled with pathway analysis identified that inflammatory gene signatures are suppressed by ectopic Adv-miR-30a expression in subcutaneous WAT of DIO mice (574 genes total down, P < 0.10, n = 4/group). E: Relative mRNA expression of key genes that validate the anti-inflammatory signature of Adv-miR-30a in subcutaneous WAT (n ≥ 4). Flow cytometry analysis to verify that Adv-miR-30a expression in iWAT reduces local F4/80+ (F) and CD11c+ M1 macrophage infiltration (G) (n = 5 mice/group). Red, Adv-miR-30a; blue, Adv-GFP; gray, isotype control (n = 5 mice/group). All data are expressed as mean ± SEM. *P < 0.05.
Figure 5
Figure 5
STAT1 is a target of miR-30a in adipocytes. A: Top enriched, miR-30a repressed gene sets from the GSEA using the MSigDB C3 transcription factor (TF) targets gene set collection. B: mRNA expression of STAT1 target genes in subcutaneous WAT expressing Adv-GFP or Adv-miR-30a. C: Bioinformatic analysis of AGO-CLIP experiments show that miR-30a binds to two sites within the 3-UTR of STAT1. D: STAT1 3-UTR luciferase fusions were coexpressed with control or miR-30a mimic in human adipocytes. m1, mutant 1; m2, mutant 2 (n = 3 independent experiments). E: STAT1 mRNA, total protein, and activation (pSTAT1 Y701) are suppressed by miR-30a mimic transfection in human adipocytes. F: STAT1 siRNA, miR-30a, or transfection control was introduced into mature human adipocytes. The effects of STAT1 siRNA and miR-30a overexpression in human adipocytes were characterized by qPCR analysis of PPARγ2, ADIPOQ, FABP4, PGC1a, UCP1, PRDM16, and STAT1 mRNA levels (n ≥ 3 independent experiments). G: Expression levels of pSTAT1 Y701, total STAT1, ADIPOQ, UCP1, PRDM16, Hsp60, and CytC were analyzed by immunoblotting for human adipocytes transfected with STAT1 siRNA or a miR-30a mimic. H: Respiration (as OCR) was measured in human adipocytes transfected with STAT1 siRNA, miR-30a mimic, or control oligomers. The OCR was measured over time with the addition of oligomycin (α), carbonyl cyanide-4-(trifluoromethoxy)phenylhydrazone (FCCP) (β), and anti–mycin-A/rotenone (γ). Percent change in OCR (%basal) was normalized to baseline rates (n = 5/group). *P < 0.05, relative to control transfection.
Figure 6
Figure 6
Inhibiting miR-30a in subcutaneous WAT is proinflammatory. A: Recombinant Adv vectors expressing GFP scrambled control or miR-30a-5p inhibitor were used for iWAT infection in male 20-week-old mice (n = 4–5/group). B: Adv transduction of iWAT was confirmed by qPCR (n = 4–5 ± SEM). C: Body weight gain of mice expressing Adv-GFP or Adv-anti-miR-30a in iWAT. D: Three weeks after the first injection, glucose metabolism was determined by insulin tolerance tests (ITT; n = 4–5 mice/group). Serum insulin levels (E) and HOMA-IR (F) were assessed in fasted mice (4 h) injected with Adv-miR-30a or Adv-GFP control (n = 4–5 mice/group). G: Western blot analysis of total STAT1 levels in iWAT infected with control or anti-miR-30a Adv. qPCR was used to determine the expression of proinflammatory (H) and lipid metabolism (I) genes in iWAT (n = 4–5 ± SEM). J: Immunohistochemistry (IHC) staining for resident proinflammatory macrophages in iWAT from DIO mice treated with local Adv-GFP or Adv-anti-miR-30a injection. Scale bars, 50 μm. K: Adv-anti-miR-30a expression in iWAT increases adipocyte size. L: Western blot analysis of STAT1, STAT2, STAT3, ADIPOQ, CytC, and Hsp90 (loading control) in human adipocytes transfected with anti-control or anti-miR-30a single-stranded RNAs. M: Expression of miR-30a, proinflammatory, and metabolic transcript levels in mature human adipocytes expressing anti-control or anti-miR-30a (representative of three independent experiments). N: Respiration (as OCR) was measured in human adipocytes transfected with anti-control or anti-miR-30a. Percent change in OCR (%basal) was normalized to baseline rates (n = 5/group). O: Mitochondria (MitoTracker) and nuclei (DAPI) were labeled in human adipocytes transfected with anti-miR-30a as in LN. Image analysis was used to determine changes in MitoTracker staining (n = 2 independent experiments, 50–100 cells/experiment). Scale bars, 20 μm. *P < 0.05, relative to control transfection. a.u., arbitrary units.
Figure 7
Figure 7
miR-30a expression confers resistance to IFN-γ in white adipocytes. Relative mRNA levels of miR-30a-5p (A) and STAT1 target and metabolism genes (B) in human adipocytes treated ± recombinant IFN-γ. C: Chromatin immunoprecipitation (ChIP) qPCR analysis of PPAR-γ and STAT1 co-occupancy in human adipocytes treated with 0.1% BSA (vehicle) or recombinant IFN-γ. D: Immunoblots of total cell lysates from human adipocytes transfected with control or miR-30a mimic and treated with vehicle or IFN-γ for 10 min. E: qPCR analysis of STAT1 target genes and insulin sensitivity genes in cells transfected with control or miR-30a mimic and treated with vehicle or IFN-γ for 24 h. F: Respiration (as OCR) was measured in human adipocytes transfected with control or miR-30a mimic and treated with vehicle or IFN-γ for 24 h. Percent change in OCR (%basal) was normalized to baseline rates (n = 5 group). G: Immunoblots of total cell lysates from human adipocytes transfected with control or miR-30a mimic and treated with vehicle or IFN-γ for 72 h in serum-free media containing 0.2% BSA. Cells were subsequently exposed to insulin for 7 min in the presence or absence of IFN-γ to assess end points of insulin signaling. *P < 0.05, relative to control transfection.

References

    1. Guo F, Garvey WT. Cardiometabolic disease risk in metabolically healthy and unhealthy obesity: stability of metabolic health status in adults. Obesity (Silver Spring) 2016;24:516–525 - PMC - PubMed
    1. Tomiyama AJ, Hunger JM, Nguyen-Cuu J, Wells C. Misclassification of cardiometabolic health when using body mass index categories in NHANES 2005-2012. Int J Obes 2016;40:883–886 - PubMed
    1. Kim JY, van de Wall E, Laplante M, et al. . Obesity-associated improvements in metabolic profile through expansion of adipose tissue. J Clin Invest 2007;117:2621–2637 - PMC - PubMed
    1. Kusminski CM, Holland WL, Sun K, et al. . MitoNEET-driven alterations in adipocyte mitochondrial activity reveal a crucial adaptive process that preserves insulin sensitivity in obesity. Nat Med 2012;18:1539–1549 - PMC - PubMed
    1. Yaghootkar H, Lotta LA, Tyrrell J, et al. . Genetic evidence for a link between favorable adiposity and lower risk of type 2 diabetes, hypertension, and heart disease. Diabetes 2016;65:2448–2460 - PMC - PubMed

Publication types