. 2018 Aug 20;131(16):jcs217828.
doi: 10.1242/jcs.217828.

Primary cilia are necessary for Prx1-expressing cells to contribute to postnatal skeletogenesis

Affiliations

Primary cilia are necessary for Prx1-expressing cells to contribute to postnatal skeletogenesis

Emily R Moore et al. J Cell Sci. .

Abstract

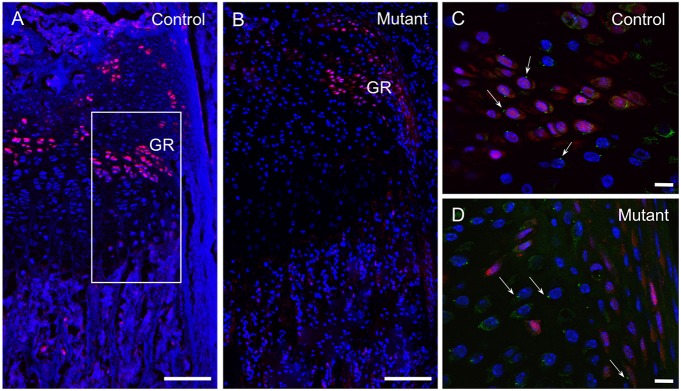
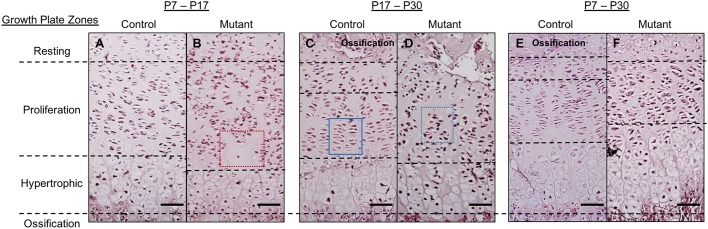
Although Prx1 (also known as PRRX1)-expressing cells and their primary cilia are critical for embryonic development, they have yet to be studied in the context of postnatal skeletogenesis owing to the lethality of mouse models. A tamoxifen-inducible Prx1 model has been developed, and we determined that expression directed by this promoter is highly restricted to the cambium layers in the periosteum and perichondrium after birth. To determine the postnatal role of these cambium layer osteochondroprogenitors (CLOPs) and their primary cilia, we developed models to track the fate of CLOPs (Prx1CreER-GFP;Rosa26tdTomato) and selectively disrupt their cilia (Prx1CreER-GFP;Ift88fl/fl). Our tracking studies revealed that CLOPs populate cortical and trabecular bone, the growth plate and secondary ossification centers during the normal program of postnatal skeletogenesis. Furthermore, animals lacking CLOP cilia exhibit stunted limb growth due to disruptions in endochondral and intramembranous ossification. Histological examination indicates that growth is stunted due to limited differentiation, proliferation and/or abnormal hypertrophic differentiation in the growth plate. Collectively, our results suggest that CLOPs are programmed to rapidly populate distant tissues and produce bone via a primary cilium-mediated mechanism in the postnatal skeleton.

Keywords: Growth plate; Osteochondroprogenitors; Periosteum; Postnatal skeletogenesis; Primary cilia; Prx1.


Conflict of interest statement

Competing interestsThe authors declare no competing or financial interests.

Figures

Fig. 1.
Fig. 1.
Experimental groups selected to evaluate juvenile skeletal developmental milestones. Following normal embryonic development, postnatal transgenic mice received injections of tamoxifen to induce Cre recombination-mediated tdTomato expression and/or primary cilia deletion in Prx1-expressing cells. The earliest injections were administered at postnatal day 7 (P7) so that secondary ossification centers (SOCs) could develop normally (Cooper et al., 2013). SOCs in the ulnae generally unite by P17. Our preliminary injection trials suggested P30 was optimal to observe significant increases in limb length and growth plate (GP) senescence. The group injected at P7 and euthanized (red X) at P17 was chosen to evaluate the role of CLOPs and their cilia in SOC unification. The P17–P30 group was selected to examine their behavior after SOCs unify. The P7–P30 group was selected to observe the overall contribution of CLOPs and their cilia to juvenile skeletal development. Animals received single or daily injections until they were euthanized depending on the experiment.
Fig. 2.
Fig. 2.
After birth, Prx1 expression is highly restricted to the cambium layers of the periosteum and perichondrium in the forelimbs. Fluorescence microscopy was used to identify cells that expressed Prx1 at the time mice were euthanized (green), recombined cells that expressed Prx1 at the time of injection two days prior to the time at which mice were euthanized (red), and nuclei (blue) in a Prx1CreER-GFP;Rosa26tdTomato reporter model. (A) H&E stain of the growth plate and corresponding fluorescence image depicting recombined cells (red) at P9. (B) Magnified boxed region from A to show green Prx1-expressing cells (examples denoted by arrowheads), red recombined cells (examples denoted by arrows), and recombined cells expressing Prx1 (asterisks). (C) Fluorescence and brightfield overlay of cortical bone and periosteum at P9. (D) Fluorescence image depicting recombined cells in the periosteum at P30. Green fluorescence visualized in muscle and bone marrow was determined to be autofluorescence when compared to Ift88fl/fl negative controls, which lack the Prx1CreER-GFP transgene. These tissues also lacked tdTomato-expressing cells. Nuclei are displayed in blue. The injection period (white label P7 or P28) and SAC date (red label P9 or P30) are noted in the upper right corner of each image. Scale bars: 50 µm. Labels refer to cortical bone (CB), groove of Ranvier (GR), perichondrium (PC), periosteum (PO), and muscle (M). Images are representative of n=5 animals per group, with one limb per animal and four sections per limb.
Fig. 3.
Fig. 3.
CLOPs initially in the cambium layers populate cartilage and bone tissue throughout the limb. Prx1CreER-GFP;Rosa26tdTomato mice received a single (A–D) or daily (E) injection of 33 mg/kg body weight tamoxifen solution to track recombined cells (red). (A) H&E stain and corresponding fluorescence image of the proximal ulnar head at P17. (B) H&E stain and corresponding fluorescence image of a cross section of the mid diaphysis of the ulna at P17. (C) H&E stain and corresponding fluorescence image of the growth plate at P17. (D) Fluorescence image of the growth plate at P30 with a single injection of tamoxifen at P17. (E) Fluorescence image of the growth plate at P30 with daily injections beginning at P7. Regions in E were magnified to display recombined cells in the periosteum (F), trabecular bone (G), groove of Ranvier (H) and growth plate (I). Nuclei are displayed in blue. Injection period (white) and SAC date (red) are noted in the upper right corner of each image. Labels refer to bone marrow (BM), cortical bone (CB), coronoid process (CP), epiphyseal disk (ED), growth plate (GP), muscle (M), perichondrium (PC), periosteum (PO), styloid process (SP) and trabecular bone (TB). Scale bars: 100 µm. The black box in C refers to the region examined in Fig. 6. Images are representative of n=5 animals per group, with one limb per animal and four sections per limb.
Fig. 4.
Fig. 4.
CLOPs lacking primary cilia do not readily enter the growth plate. Prx1CreER-GFP;Rosa26tdTomato control and Prx1CreER-GFP;Ift88fl/fl;Rosa26tdTomato experimental animals were injected with a single dose of 33 mg/kg body weight tamoxifen solution at P15 and euthanized at P17. Recombined cells (red) were visualized in the growth plates of animals with (A) and without (B) CLOP primary cilia. Magnified view of the groove of Ranvier (GR) in control (C) and experimental (D) groups. Immunohistochemistry for acetylated α-tubulin was performed to detect primary cilia (green, examples denoted by arrows). Nuclei are depicted in blue. Scale bars: 100 µm in (A,B); 10 µm (C,D). The right half of the growth plate is pictured in A and B. The white box in A refers to the region examined in Fig. 7. Images are representative of n=5 animals per group, with one limb per animal and four sections per limb.
Fig. 5.
Fig. 5.
Mice lacking CLOP primary cilia exhibit stunted limb development and growth plate chondrocyte proliferation. Ift88fl/fl control and Prx1CreER-GFP;Ift88fl/fl CLOP cilium knockout mice were injected with 33 mg/kg body weight tamoxifen daily beginning at either P7 or P17 until they were euthanized at either P17 or P30. (A) Cortical area, (B), marrow area and (C) length were quantified from H&E stains of control and experimental animal ulnae. (D) Proliferating growth plate chondrocytes were identified via immunohistochemistry for Proliferating Cell Nuclear Antigen (PCNA) and quantified in control experimental animals. Data are presented as mean±s.e.m. Images are representative of n=5 animals per group, with one limb per animal and five sections per limb. *P<0.05, **P<0.01, ***P<0.001. No sex-dependent differences were identified according to one-way ANOVA (P>0.473 for all measurements).
Fig. 6.
Fig. 6.
Juvenile mice lacking CLOP cilia demonstrate abnormal growth plate morphology. Ift88fl/fl control and Prx1CreER-GFP;Ift88fl/fl CLOP cilium knockout mice were injected with 33 mg/kg body weight tamoxifen daily beginning at either P7 or P17 until they were euthanized at either P17 or P30. Growth plates were stained with H&E to discern ulnar growth plate zones (black dashed lines) in the (A,B) P7–P17, (C,D) P17–P30 and (E,F) P7–P30 groups. Scale bars: 50 µm. The region of the growth plate examined here is represented by the solid black box in Fig. 3C. Images are representative of n=5 animals per group, with one limb per animal and five sections per limb.
Fig. 7.
Fig. 7.
Mice lacking CLOP cilia exhibit ectopic hypertrophy in the growth plate. Ift88fl/fl control and Prx1CreER-GFP;Ift88fl/fl CLOP cilium knockout mice were injected with 33 mg/kg body weight tamoxifen daily beginning at either P7 or P17 until they were euthanized at either P17 or P30. Immunohistochemistry for anti-Type X collagen was performed to identify hypertrophic chondrocytes (green) and the hypertrophic zone (HZ, white dashed lines) in the (A,B) P7–P17, (C,D) P17–P30 and (E,F) P7–P30 groups. Nuclei are displayed in blue. Scale bars: 50 µm. The region of the growth plate examined here is represented by the white box in Fig. 4A. Images are representative of n=5 animals per group, with one limb per animal and four sections per limb.
Fig. 8.
Fig. 8.
General ossification is stunted in juveniles when CLOP cilia are deleted. Ift88fl/fl control and Prx1CreER-GFP;Ift88fl/fl CLOP cilium knockout mice were injected with 33 mg/kg body weight tamoxifen daily beginning at either P7 or P17 until they were euthanized at either P17 or P30. Toluidine Blue O stains were performed to identify cartilage (purple), bone (off-white) and marrow (light blue) in the limbs of mice with and without CLOP primary cilia. The epiphyseal disk of P7–P30 control (A) and experimental (B) mice. The epiphyseal disk of P17–P30 control (C) and experimental (D) mice. The growth plate and trabecular bone of P7–P30 control (E) and experimental (F) mice. Black scale bars represent 100 µm. Images are representative of n=5 animals per group, with one limb per animal and four sections per limb.

References

    1. Alvarez J., Sohn P., Zeng X., Doetschman T., Robbins D. J. and Serra R. (2002). TGFbeta2 mediates the effects of hedgehog on hypertrophic differentiation and PTHrP expression. Development 129, 1913-1924. - PubMed
    1. Anderson C. T., Castillo . B., Brugmann S. A., Helms J. A., Jacobs C. R. and Stearns T. (2008). Primary cilia: cellular sensors for the skeleton. Anat. Rec. Adv. Integr. Anat. Evol. Biol. 291, 1074-1078. 10.1002/ar.20754 - DOI - PMC - PubMed
    1. Arnsdorf E. J., Jones L. M., Carter D. R. and Jacobs C. R. (2009). The periosteum as a cellular source for functional tissue engineering. Tissue Eng. Part A 15, 2637-2642. 10.1089/ten.tea.2008.0244 - DOI - PMC - PubMed
    1. Ascenzi M.-G., Lenox M. and Farnum C. (2007). Analysis of the orientation of primary cilia in growth plate cartilage: a mathematical method based on multiphoton microscopical images. J. Struct. Biol. 158, 293-306. 10.1016/j.jsb.2006.11.004 - DOI - PMC - PubMed
    1. Ascenzi M.-G., Blanco C., Drayer I., Kim H., Wilson R., Retting K. N., Lyons K. M. and Mohler G. (2011). Effect of localization, length and orientation of chondrocytic primary cilium on murine growth plate organization. J. Theor. Biol. 285, 147-155. 10.1016/j.jtbi.2011.06.016 - DOI - PMC - PubMed

Publication types

MeSH terms