. 2018 Jul 12;9(1):2690.
doi: 10.1038/s41467-018-05106-7.

The origin and adaptive evolution of domesticated populations of yeast from Far East Asia

Affiliations

The origin and adaptive evolution of domesticated populations of yeast from Far East Asia

Shou-Fu Duan et al. Nat Commun. .

Abstract

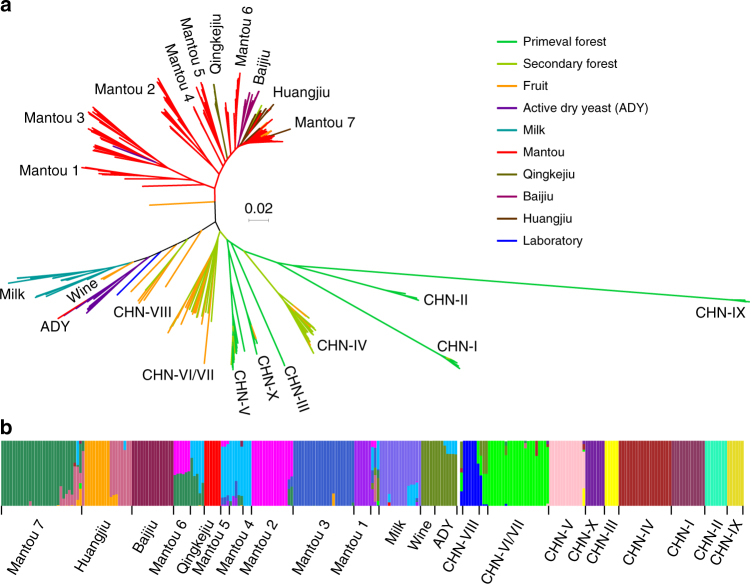
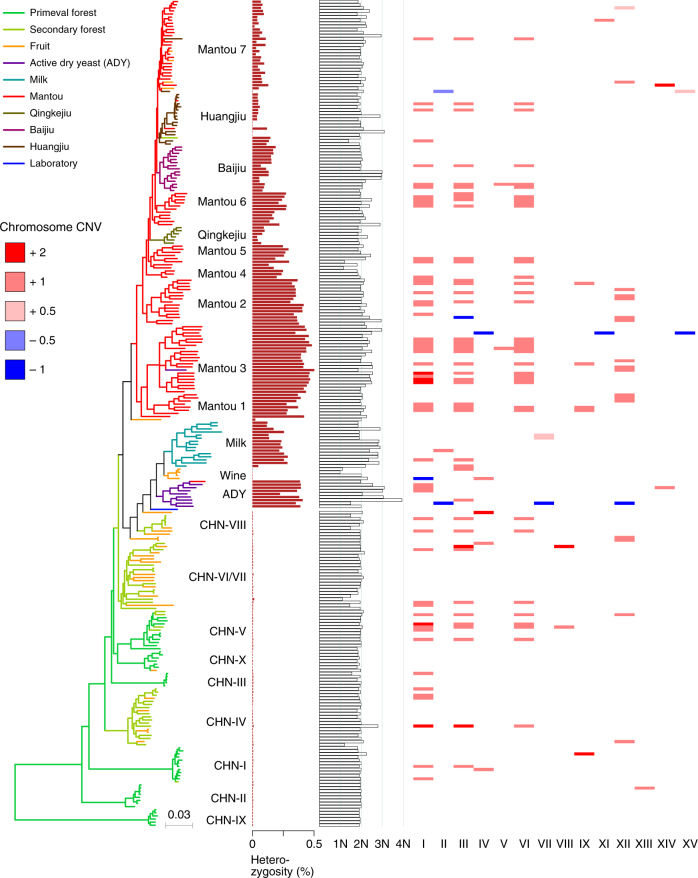
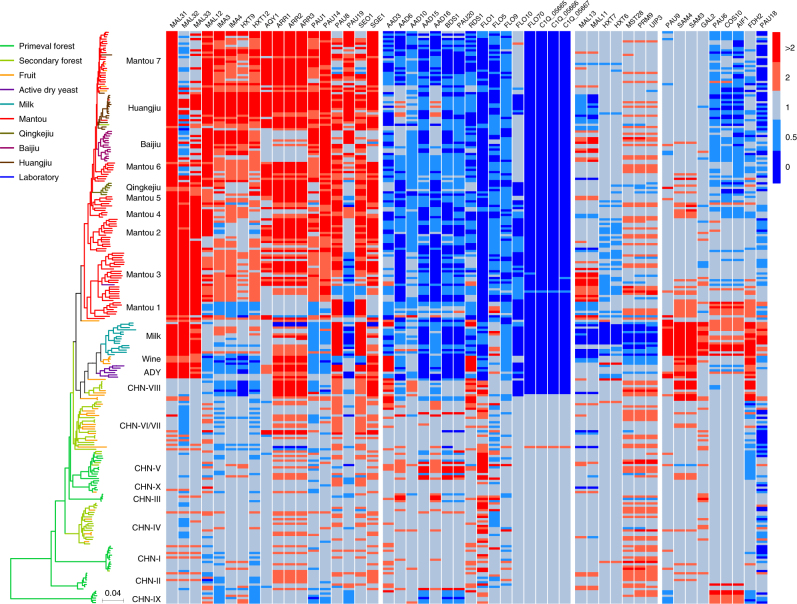
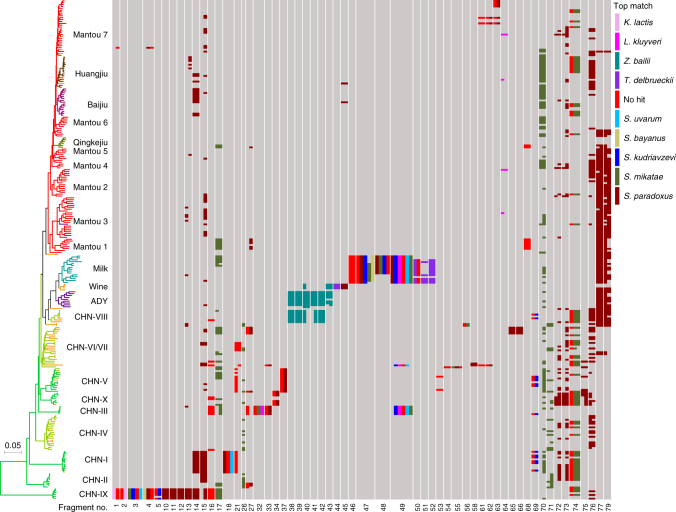
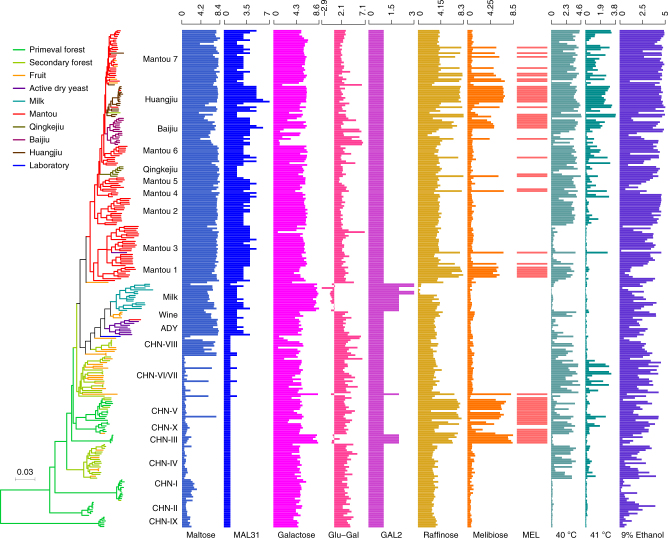
The yeast Saccharomyces cerevisiae has been an essential component of human civilization because of its long global history of use in food and beverage fermentation. However, the diversity and evolutionary history of the domesticated populations of the yeast remain elusive. We show here that China/Far East Asia is likely the center of origin of the domesticated populations of the species. The domesticated populations form two major groups associated with solid- and liquid-state fermentation and appear to have originated from heterozygous ancestors, which were likely formed by outcrossing between diverse wild isolates primitively for adaptation to maltose-rich niches. We found consistent gene expansion and contraction in the whole domesticated population, as well as lineage-specific genome variations leading to adaptation to different environments. We show a nearly panoramic view of the diversity and life history of S. cerevisiae and provide new insights into the origin and evolution of the species.


Conflict of interest statement

The authors declare no competing interests.

Figures

Fig. 1
Fig. 1
Phylogeny and population structure of wild and domesticated isolates of S. cerevisiae from China. a Unrooted tree from maximum likelihood analysis based on 923,479 genome-wide SNPs. Bootstrap support values to each lineage and major clade are 100% except for the Mangtou 7 lineage, which is supported by 80% bootstrap resampling. Scale bar, 0.02 substitutions per site. Strain branches are colored according to ecological origins. b Population structure inferred using the ADMIXTURE program based on 895,428 biallelic SNPs when K (the number of populations assumed) is set to 20 as determined by the minimum cross-validation error check. Each strain is represented by a single vertical line broken into 20 coloured segments, with lengths proportional to each of the 20 inferred clusters. Isolates in each identified population are consistent with the lineages identified in the phylogenetic tree presented in a
Fig. 2
Fig. 2
Heterozygosity, ploidy, and chromosome copy-number variation (CNV) in wild and domesticated isolates of S. cerevisiae. Isolates are represented by terminal branches in the phylogenetic tree constructed from the maximum likelihood analysis on genome wide SNPs and are colored according to their ecological origins. Heterozygosity is expressed as the ratio of heterozygous SNPs to the consensus genome size of each isolate. Ploidy of each isolate was estimated using flow cytometry and is represented by a bar graph. Amplification of individual chromosomes above 2n is shown by a pink or red stripe with a digital value (pink 0.5, amplification of a part of the chromosome; light red 1, one extra copy of the whole chromosome; dark red 2, two extra copies of the whole chromosome). Deletion of individual chromosome below 2n is shown by a blue stripe with a digital value (light blue −0.5, deletion of a part of the chromosome; dark blue −1, deletion of one copy of the whole chromosome)
Fig. 3
Fig. 3
Copy-number variation (CNV) of selected genes in wild and domesticated isolates of S. cerevisiae. Gene names are given at the top of the heat map. Isolates are represented by terminal branches in the phylogenetic tree constructed from the maximum likelihood analysis on genome wide SNPs and are colored according to their ecological origins. Heat map colors reflect different degrees of gene duplication (red shades) or deletion (blue shades) from the basal level (grey) according to the scale on the right with strain S288c as the reference. The exact relative values of CNV are given in Supplementary Data 6
Fig. 4
Fig. 4
Selected introgression and horizontal gene transfer (HGT) events in wild and domesticated isolates of S. cerevisiae. Isolates are represented by terminal branches in the phylogenetic tree constructed from the maximum likelihood analysis on genome wide SNPs and are colored according to their ecological origin as shown in Fig. 1. The fragments (numbered at the bottom) with top matches from species other than S. cerevisiae are shown, which are selected from the 79 possible introgression and HGT fragments (Supplementary Data 7) detected in the 266 isolates of S. cerevisiae included in the tree. Top matches or putative sources of the alien fragments are shown on the upper right based on sequence identities given in Supplementary Data 7
Fig. 5
Fig. 5
Phenotypic traits and associated gene copy-number variations (CNVs) of wild and domesticated isolates of S. cerevisiae. Isolates are represented by terminal branches in the phylogenetic tree constructed from maximum likelihood analysis on genome wide SNPs and are colored according to their ecological origins. Bar charts with labels at the bottom reflect phenotypic traits or CNVs. Maltose, Galactose, Raffinose, and Melibiose indicate growth rate (×1000) in the medium with each of the sugars as the sole carbon source; Glu-Gal indicates difference between the growth rates in glucose and in galactose; MAL31 and GAL2 indicate CNV of each of the genes; MEL1 indicates presence (solid bar) or absence (blank) of the gene; 40 °C, 41 °C, and 9% ethanol indicate growth efficiencies under the pressures

References

    1. McGovern PE, et al. Fermented beverages of pre- and proto-historic China. Proc. Natl Acad. Sci. USA. 2004;101:17593–17598. doi: 10.1073/pnas.0407921102. - DOI - PMC - PubMed
    1. Goffeau A, et al. Life with 6000 genes. Science. 1996;274:563–547. doi: 10.1126/science.274.5287.546. - DOI - PubMed
    1. Darwin C. The Variation of Animals and Plants under Domestication. 1st ed. London: John Murray; 1868. - PMC - PubMed
    1. Larson G, et al. Current perspectives and the future of domestication studies. Proc. Natl. Acad. Sci. USA. 2014;111:6139–6146. doi: 10.1073/pnas.1323964111. - DOI - PMC - PubMed
    1. Liti G. The fascinating and secret wild life of the budding yeast S. cerevisiae. eLife. 2015;4:e05835. doi: 10.7554/eLife.05835. - DOI - PMC - PubMed

Publication types

LinkOut - more resources