. 2018 Jul 9:3:16.
doi: 10.1038/s41525-018-0053-8. eCollection 2018.

Meta-analysis of the diagnostic and clinical utility of genome and exome sequencing and chromosomal microarray in children with suspected genetic diseases

Affiliations

Meta-analysis of the diagnostic and clinical utility of genome and exome sequencing and chromosomal microarray in children with suspected genetic diseases

Michelle M Clark et al. NPJ Genom Med. .

Abstract

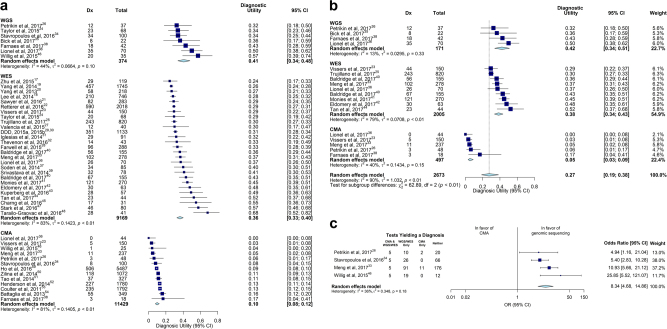
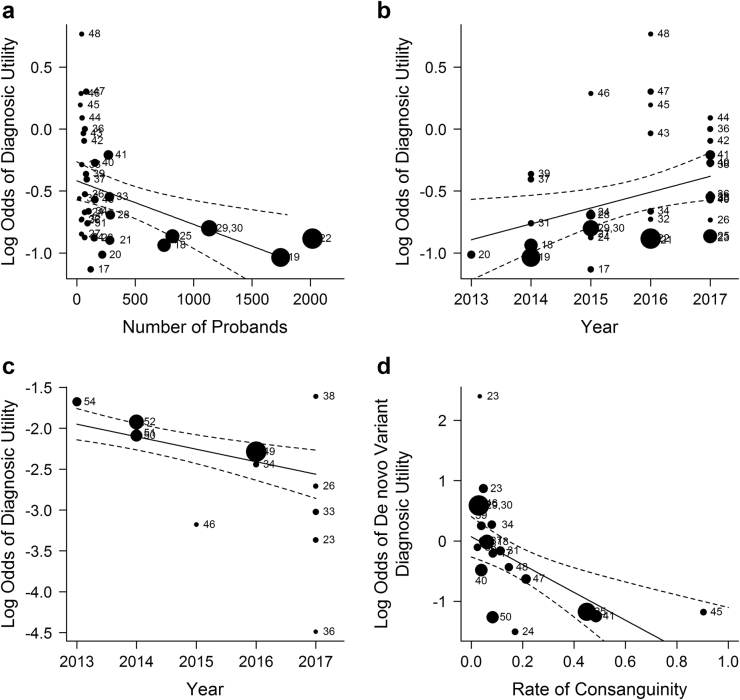
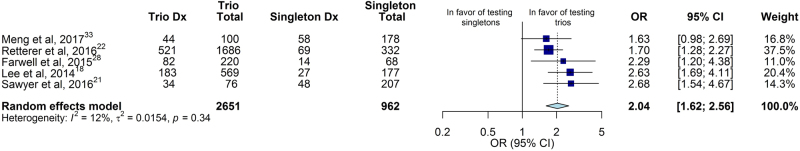
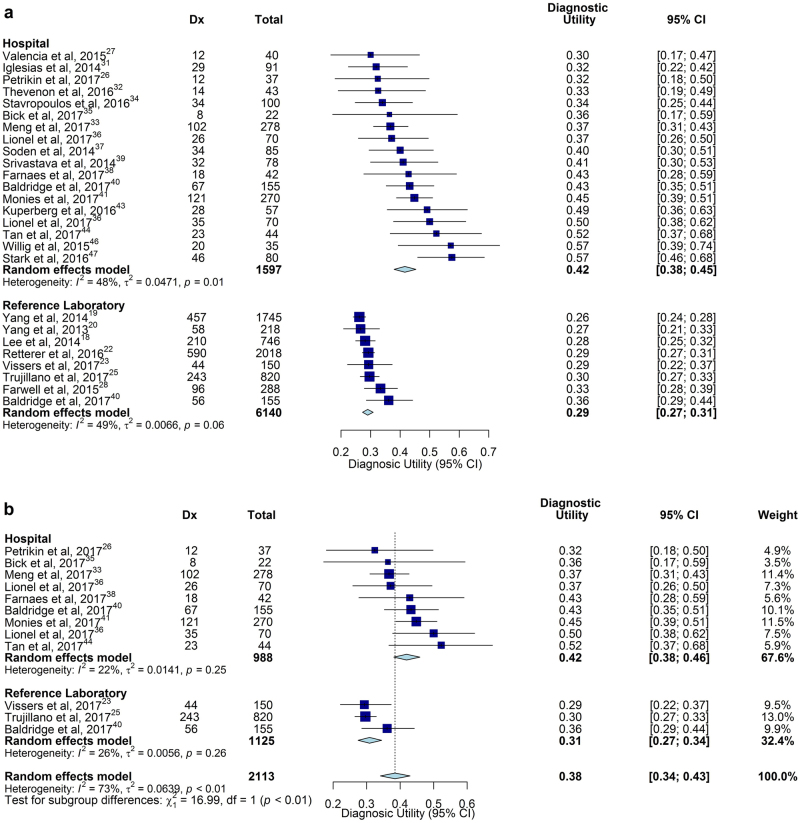
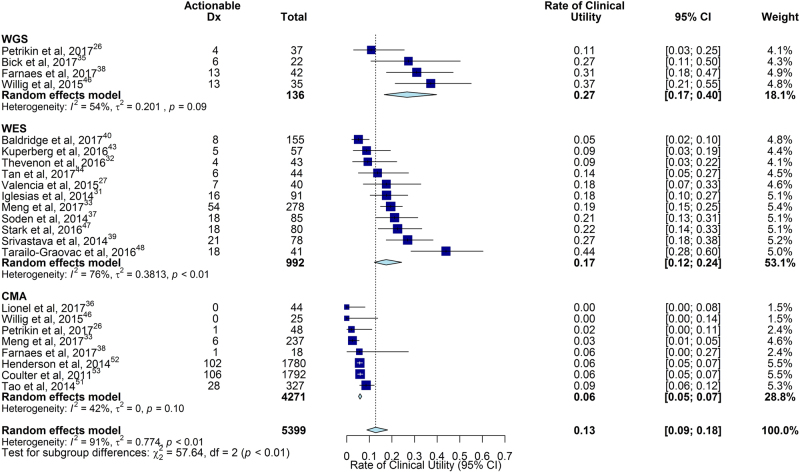
Genetic diseases are leading causes of childhood mortality. Whole-genome sequencing (WGS) and whole-exome sequencing (WES) are relatively new methods for diagnosing genetic diseases, whereas chromosomal microarray (CMA) is well established. Here we compared the diagnostic utility (rate of causative, pathogenic, or likely pathogenic genotypes in known disease genes) and clinical utility (proportion in whom medical or surgical management was changed by diagnosis) of WGS, WES, and CMA in children with suspected genetic diseases by systematic review of the literature (January 2011-August 2017) and meta-analysis, following MOOSE/PRISMA guidelines. In 37 studies, comprising 20,068 children, diagnostic utility of WGS (0.41, 95% CI 0.34-0.48, I2 = 44%) and WES (0.36, 95% CI 0.33-0.40, I2 = 83%) were qualitatively greater than CMA (0.10, 95% CI 0.08-0.12, I2 = 81%). Among studies published in 2017, the diagnostic utility of WGS was significantly greater than CMA (P < 0.0001, I2 = 13% and I2 = 40%, respectively). Among studies featuring within-cohort comparisons, the diagnostic utility of WES was significantly greater than CMA (P < 0.001, I2 = 36%). The diagnostic utility of WGS and WES were not significantly different. In studies featuring within-cohort comparisons of WGS/WES, the likelihood of diagnosis was significantly greater for trios than singletons (odds ratio 2.04, 95% CI 1.62-2.56, I2 = 12%; P < 0.0001). Diagnostic utility of WGS/WES with hospital-based interpretation (0.42, 95% CI 0.38-0.45, I2 = 48%) was qualitatively higher than that of reference laboratories (0.29, 95% CI 0.27-0.31, I2 = 49%); this difference was significant among studies published in 2017 (P < .0001, I2 = 22% and I2 = 26%, respectively). The clinical utility of WGS (0.27, 95% CI 0.17-0.40, I2 = 54%) and WES (0.17, 95% CI 0.12-0.24, I2 = 76%) were higher than CMA (0.06, 95% CI 0.05-0.07, I2 = 42%); this difference was significant for WGS vs CMA (P < 0.0001). In conclusion, in children with suspected genetic diseases, the diagnostic and clinical utility of WGS/WES were greater than CMA. Subgroups with higher WGS/WES diagnostic utility were trios and those receiving hospital-based interpretation. WGS/WES should be considered a first-line genomic test for children with suspected genetic diseases.


Conflict of interest statement

The authors declare no competing interests.

Figures

Fig. 1
Fig. 1
Comparison of diagnostic (Dx) utility of WGS, WES and CMA. a The pooled diagnostic utility of WGS and WES were both greater than of CMA. However, severe heterogeneity precluded quantitative analysis. b The subset of studies published in 2017 showed reduced heterogeneity for all subgroups. The pooled diagnostic utility with WGS was significantly higher than with CMA (P < 0.0001). c Among manuscripts that provided complete data for the frequency of diagnoses made by WES and CMA, the pooled odds of diagnosis was 8.3 times greater for WGS (P < 0.0001)
Fig. 2
Fig. 2
Exploration of heterogeneity of diagnostic utility in WGS and WES studies. a Meta-regression scatterplot for study size. On average, an increase of 1000 subjects decreased the odds of diagnosis by 28% (P = 0.01). Size of data point corresponds to the study’s inverse-variance weight. b Meta-regression scatterplot for diagnostic utility of WGS/WES vs year of study publication. On average, the odds of diagnosis increased by 16% per annum since 2013 (P = 0.01). c Meta-regression scatterplot for the diagnostic utility of CMA vs year of study publication. The odds of diagnosis decreased by an average of 14% per year between 2013 and 2017 (P < 0.001). d The rate of diagnosis associated with de novo variation varied inversely with consanguinity. On average, increasing the rate of consanguinity by 10% decreased the odds of de novo variant diagnoses by 21% (P < 0.001)
Fig. 3
Fig. 3
Comparison of diagnostic (Dx) utility of singleton and trio WGS/WES in studies where both analyses were performed. In five studies that conducted within-cohort comparisons of singleton and trio genomic sequencing, the pooled odds of diagnosis for trios was twice that of singletons (P < 0.0001)
Fig. 4
Fig. 4
Comparison of diagnostic (Dx) utility of WGS/WES in hospital laboratories and reference laboratories. a The pooled diagnostic utility of hospital-based testing was greater than reference laboratory testing. However, substantial heterogeneity was observed. b The subset of studies published in 2017 showed reduced heterogeneity for both subgroups. The pooled diagnostic utility was significantly greater in hospitals than in reference laboratories (P = 0.004)
Fig. 5
Fig. 5
Comparison of the rate of clinical utility of WGS, WES, and CMA. The rate of clinical utility was the proportion of children tested who received a change in medical or surgical management as a result of genetic disease diagnosis. The pooled rate of clinical utility of WGS and WES were both greater than of CMA. However, there was severe heterogeneity in the WES subgroup. Testing for subgroup differences amongst groups with low to moderate heterogeneity, we found that WGS diagnoses lead to an improved rate of clinical utility over CMA diagnoses

References

    1. March of Dimes. March of Dimes Data Book for Policy Makers: Maternal, Infant, and Child Health in the United States. Office of Government Affairs, March of Dimes (Washington, DC, 2016).
    1. Xu J, Murphy SL, Kochanek KD, Arias E. Mortality in the United States, 2015. NCHS Data Brief. 2016;267:1–8. - PubMed
    1. Wilkinson DJ, et al. Death in the neonatal intensive care unit: changing patterns of end of life care over two decades. Arch. Dis. Child Fetal Neonatal Ed. 2006;91:F268–F271. doi: 10.1136/adc.2005.074971. - DOI - PMC - PubMed
    1. Hagen CM, Hansen TW. Deaths in a neonatal intensive care unit: a 10-year perspective. Pediatr. Crit. Care Med. 2004;5:463–468. doi: 10.1097/01.PCC.0000128893.23327.C1. - DOI - PubMed
    1. Ray JG, Urquia ML, Berger H, Vermeulen MJ. Maternal and neonatal separation and mortality associated with concurrent admissions to intensive care units. CMAJ. 2012;184:E956–E962. doi: 10.1503/cmaj.121283. - DOI - PMC - PubMed