

Crohn's disease patient serum changes protein expression in a human mesenchymal stem cell model in a linear relationship to patients' disease stage and to bone mineral density
- PMID: 30003044
- PMCID: PMC6039964
- DOI: 10.1016/j.jcte.2018.06.002
Crohn's disease patient serum changes protein expression in a human mesenchymal stem cell model in a linear relationship to patients' disease stage and to bone mineral density
Abstract
Background: Crohn's disease (CD) is associated with a higher prevalence of osteoporosis, a complication that is recognized as a significant cause of morbidity. Its pathogenesis is controversial, but the activity of CD is one contributing factor.
Methods: We stimulated SCP-1 cells (mesenchymal stem cell line) under osteogenic conditions with serum from adult patients with CD in the symptomatic phase (SP) and in remission (R) and with control sera. Concentrations of IL-6, IL-1 beta, and TNF alpha in the sera were measured. Patients were classified as normal or osteopenic/osteoporotic based on bone mineral density (BMD) T-score measurements. After 14 days in culture, protein expression and gene ontology (GO) annotation analysis was performed.
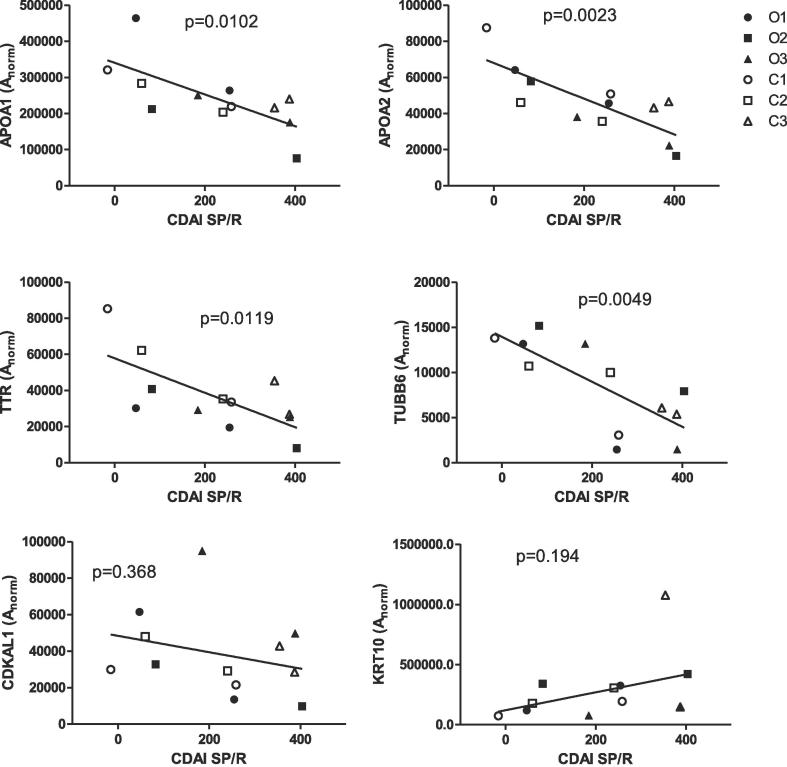
Results: Cytokine concentrations (IL-6, IL-1 beta, TNF alpha) varied within sera groups. None of the cytokines were significantly increased in the symptomatic phase compared to remission. Protein analysis revealed 17 proteins regulated by the SP versus R phase sera of disease. A linear relationship between CDAI (Crohn's disease activity index) and normalized protein expression of APOA1 and 2, TTR, CDKAL1 and TUBB6 could be determined. Eleven proteins were found to be differentially regulated comparing osteoporosis-positive and osteoporosis-negative sera. Gene annotation and further analysis identified these genes as part of heme and erythrocyte metabolism, as well as involved in hypoxia and in endocytosis. A significant linear relationship between bone mineral density and normalized protein expression could be determined for proteins FABP3 and TTR.
Conclusion: Our explorative results confirm our hypothesis that factors in serum from patients with CD change the protein expression pattern of human immortalized osteoblast like cells. We suggest, that these short time changes indeed influence factors of bone metabolism.
Keywords: Crohn’s disease; Cytokines; Gene ontology; Osteoporosis; Proteome analysis.
Figures


References
-
- Ghosh S. Low bone mineral density in Crohn’s disease, but not in ulcerative colitis, at diagnosis. Gastroenterology. 1994;107(4):1031–1039. - PubMed
-
- Johnell O. Mortality after osteoporotic fractures. Osteoporos Int. 2004;15(1):38–42. - PubMed
-
- Jalava T. Association between vertebral fracture and increased mortality in osteoporotic patients. J Bone Miner Res. 2003;18(7):1254–1260. - PubMed
-
- Schulte C.M. Review article: bone disease in inflammatory bowel disease. Aliment Pharmacol Ther. 2004;20(Suppl 4):43–49. - PubMed
LinkOut - more resources
Full Text Sources
Other Literature Sources
Research Materials
Miscellaneous
