. 2018 Jul 9:5:16.
doi: 10.1186/s40662-018-0111-4. eCollection 2018.

Long scan depth optical coherence tomography on imaging accommodation: impact of enhanced axial resolution, signal-to-noise ratio and speed

Affiliations

Long scan depth optical coherence tomography on imaging accommodation: impact of enhanced axial resolution, signal-to-noise ratio and speed

Yilei Shao et al. Eye Vis (Lond). .

Abstract

Background: Spectral domain optical coherence tomography (SD-OCT) was a useful tool to study accommodation in human eye, but the maximum image depth is limited due to the decreased signal-to-noise ratio (SNR). In this study, improving optical resolutions, speeds and the SNR were achieved by custom built SD-OCT, and the evaluation of the impact of the improvement during accommodation was investigated.

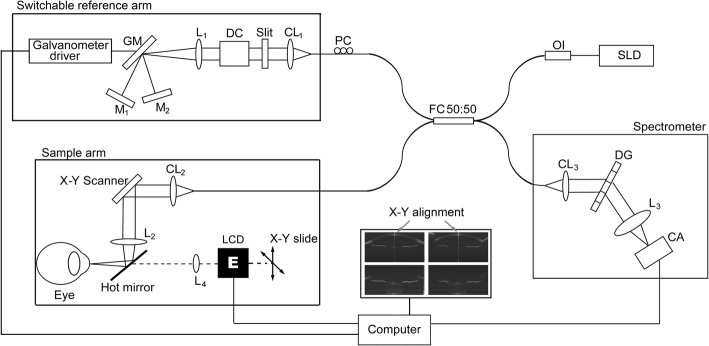
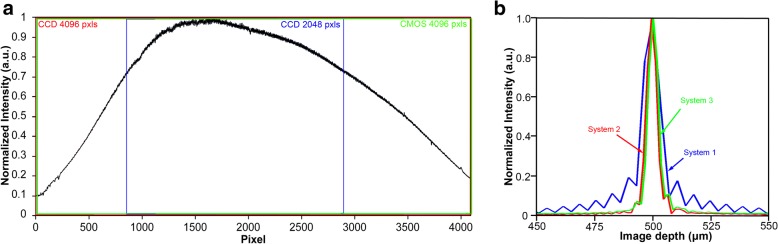
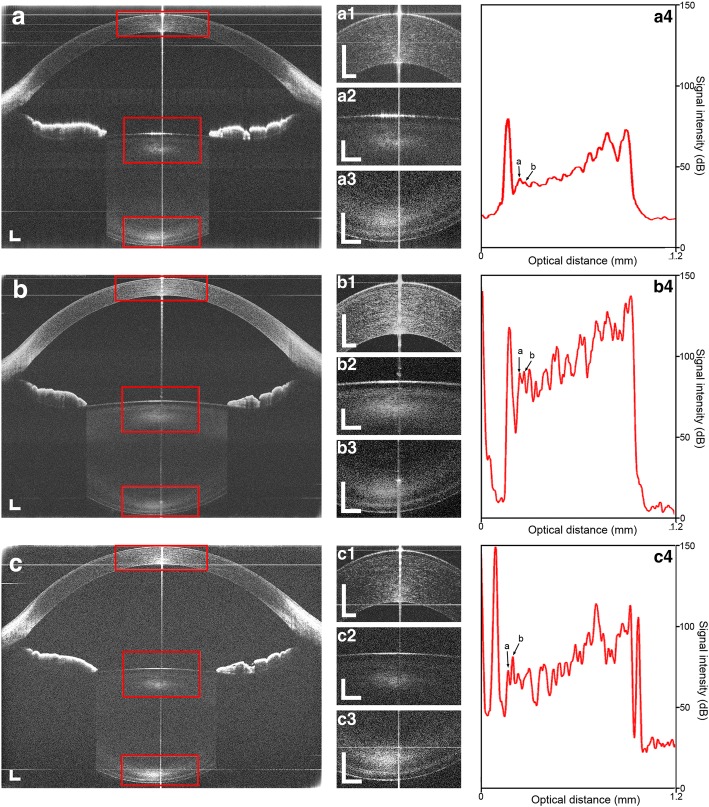
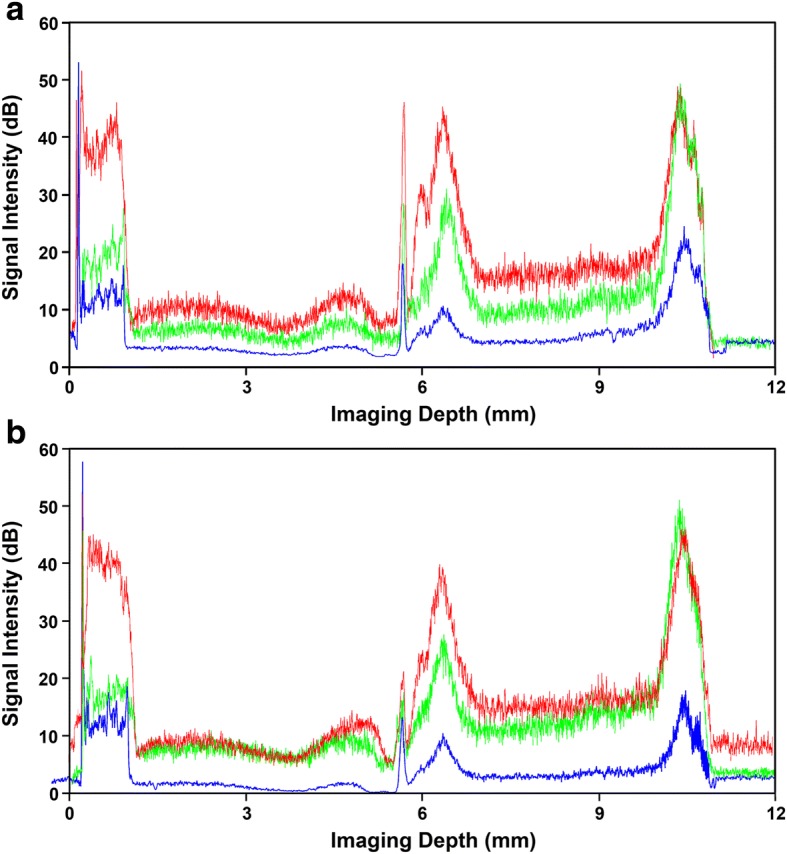
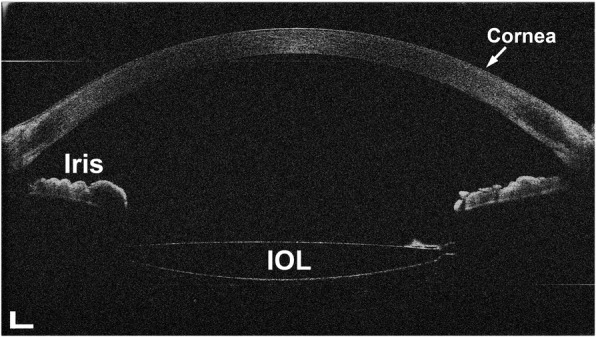
Methods: Three systems with different spectrometer designs, including two Charge Coupled Device (CCD) cameras and one Complementary Metal-Oxide-Semiconductor Transistor (CMOS) camera, were tested. We measured the point spread functions of a mirror at different positions to obtain the axial resolution and the SNR of three OCT systems powered with a light source with a 50 nm bandwidth, centered at a wavelength of 840 nm. Two normal subjects, aged 26 and 47, respectively, and one 75-year-old patient with an intraocular lens implanted were imaged.

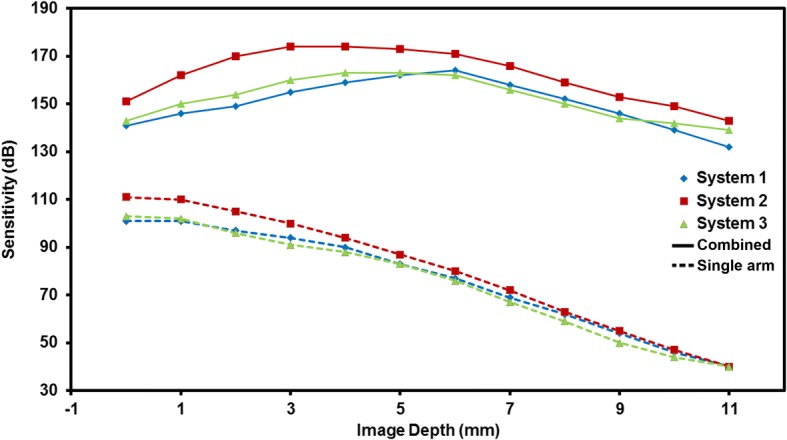
Results: The results indicated that spectrometers using cameras with 4096 camera pixels optimized the axial resolutions, due to the use of the full spectrum provided by the light source. The CCD camera system with 4096 pixels had the highest SNR and the best image quality. The system with the CMOS camera with 4096 pixels had the highest speed but had a compromised SNR compared to the CCD camera with 4096 pixels.

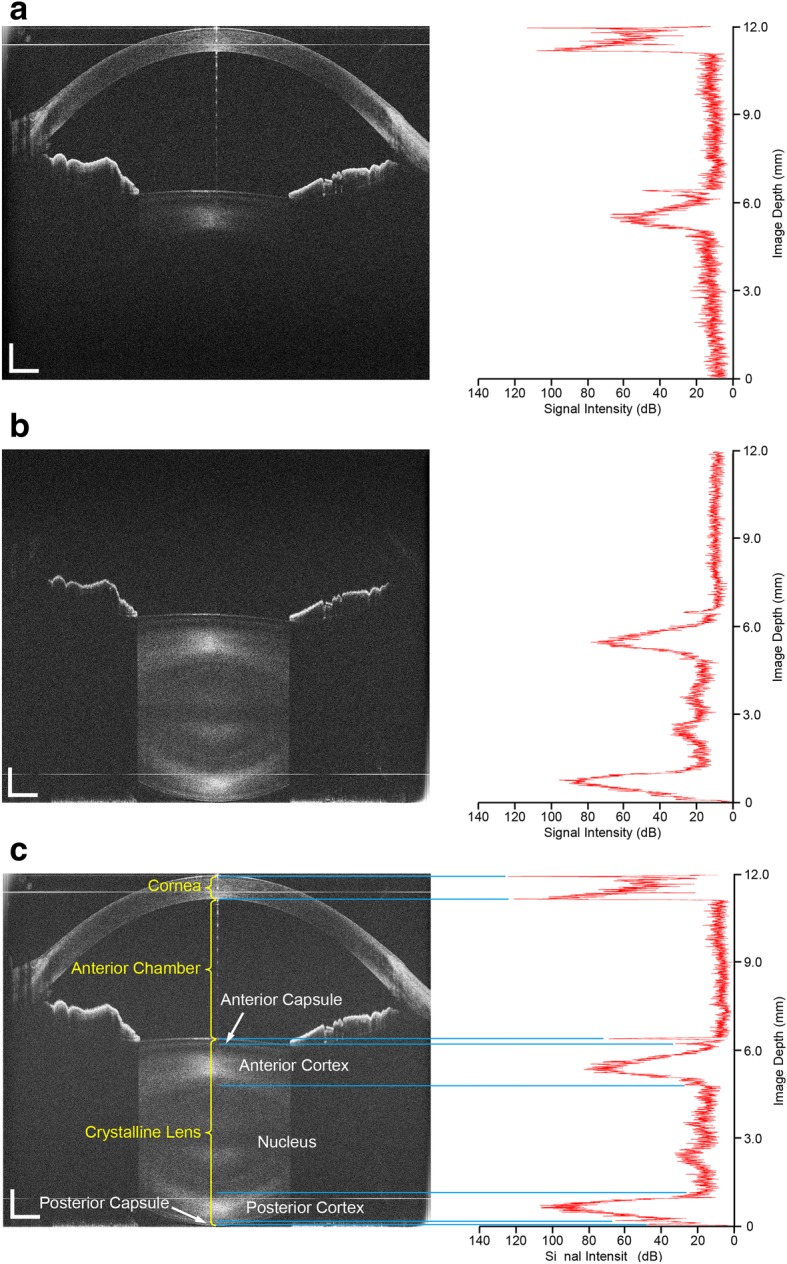
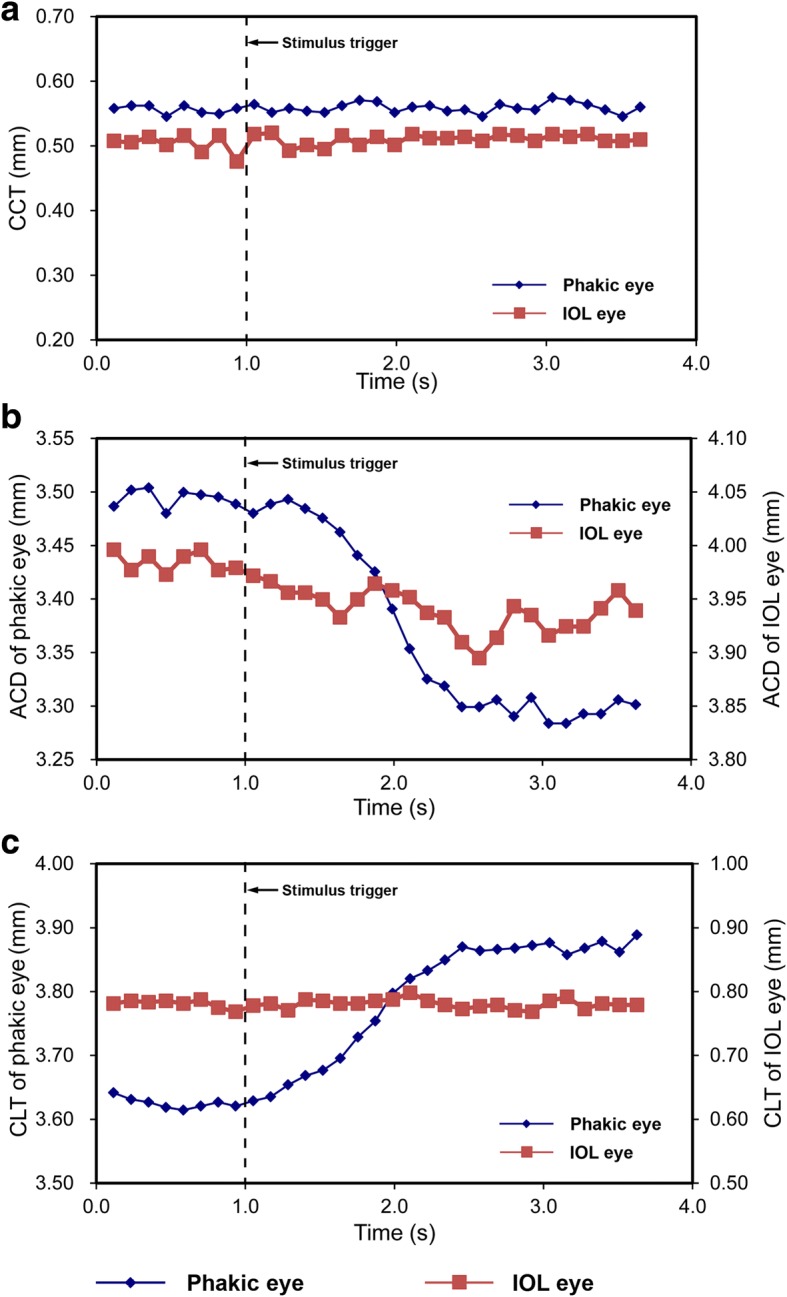
Conclusions: Using these three OCT systems, we imaged the anterior segment of the human eye before and after accommodation, which showed similar results among the different systems. The system using the CMOS camera with an ultra-long scan depth, high resolution and high scan speed exhibited the best overall performance and therefore was recommended for imaging real-time accommodation.

Keywords: Accommodation; Anterior segment; Axial resolution; Optical coherence tomography; Signal-to-noise ratio.


Conflict of interest statement

This study was approved by the institutional review board for human research at the University of Miami. Informed consent was obtained from each subject and all patients were treated in accordance with the tenets of the Declaration of Helsinki.Informed consent was obtained from each subject.The authors declare that they have no competing interests.

Figures

Fig. 1
Fig. 1
A schematic diagram depicting the spectral-domain OCT systems. SLD: superluminescent diode, OI: isolator, FC: fiber coupler, PC: polarization controller, CL1–3: collimating lenses, DC: dispersion compensator, L1–4: objective lenses, M1–2: refractive mirror, GM: galvanometer mirror, LCD: liquid-crystal display, DG: diffraction grating, CA: camera (CCD with 2048 pixels for system 1, CCD with 4096 pixels for system 2 and CMOS with 4096 pixels for system 3)
Fig. 2
Fig. 2
Spectrum of the light source captured by the three different systems (a) and the point spread functions (PSF) obtained using the three systems at a path difference of 0.5 mm (b). a: The areas of the available pixels from the cameras are indicated in blue (CCD with 2048 pixels), red (CCD with 4096 pixels) and green (CMOS with 4096 pixels) rectangles, respectively. b: Blue, the PSF of system 1 with the measured resolution of 10.9 μm in air; Red, the PSF of system 2 with the measured resolution of 7.0 μm in air; Green, of system 3 with the measured resolution of 7.0 μm in air
Fig. 3
Fig. 3
The sensitivity of the three systems measured at different image depths from the zero-delay line. Blue line, system 1 with CCD 2048 pixels; red line, system 2 with CCD 4096 pixels; green line, system 3 with CMOS. The solid line was the combined sensitivity acquired from two reference arms; the dotted line was obtained from a single arm
Fig. 4
Fig. 4
The images of the entire anterior segment from a 47-year-old subject was obtained and processed. a: The image and the longitudinal reflectivity profiles obtained from reference arm 1; b: The image and the longitudinal reflectivity profiles obtained from reference arm 2; c: The combined image obtained from overlapping image a and b, and the longitudinal reflectivity profiles through the whole anterior segment. Bar = 1 mm
Fig. 5
Fig. 5
The uncorrected images taken from the entire anterior segment of a 26-year-old subject using the three systems. a: Image obtained by system 1 using a CCD camera with 2048 pixels; b: Image obtained by system 2 using a CCD camera with 4096 pixels; c: Image obtained by system 3 using a CMOS camera. a1-a3, b1-b3, c1-c3: The magnified images of the corneal apex (1), the anterior (2) and the posterior (3) of the lens surface using the three systems, respectively. a4, b4, c4: Longitudinal reflectivity profiles through the cornea. The boundaries of the Bowman’s layer were identified as the peaks a and b. Bar = 500 μm
Fig. 6
Fig. 6
The longitudinal reflectivity profiles from a 26-year-old subject under the relaxed (a) and the accommodative (b) states. Blue line: Longitudinal profile obtained from system 1; Red line: Longitudinal profile obtained from system 2; Green line: Longitudinal profile obtained from system 3. The contrast scales were adjusted before obtaining the reflectivity profiles to demonstrate the peak locations representing the measured boundaries
Fig. 7
Fig. 7
The uncorrected image of the anterior segment presented from a 75-year-old IOL implanted eye. The cornea, anterior chamber, iris and the IOL are clearly presented. The image consists of 1024 A-lines of 4096 pixels each. Bar = 500 μm
Fig. 8
Fig. 8
The dynamic changes of the axial biometry of the anterior segment depicted for both a phakic eye and an IOL implanted eye. a: the dynamic changes in central corneal thickness; b: the dynamic changes in anterior chamber depth; c: the dynamic changes in central lens thickness. Blue line: phakic eye; Red line: IOL implanted eye. CCT, central corneal thickness; ACD, anterior chamber depth; CLT, central lens thickness

References

    1. Koretz JF, Cook CA, Kaufman PL. Accommodation and presbyopia in the human eye. Changes in the anterior segment and crystalline lens with focus. Invest Ophthalmol Vis Sci. 1997;38(3):569–578. - PubMed
    1. Glasser A, Kaufman PL. The mechanism of accommodation in primates. Ophthalmology. 1999;106(5):863–872. doi: 10.1016/S0161-6420(99)00502-3. - DOI - PubMed
    1. von Helmholtz H. Uber die akkommodation des auges. Archiv Ophthalmol. 1855;1:1–74.
    1. Dubbelman M, Van der Heijde GL, Weeber HA. Change in shape of the aging human crystalline lens with accommodation. Vision Res. 2005;45(1):117–32. - PubMed
    1. Hermans EA, Pouwels PJ, Dubbelman M, Kuijer JP, van der Heijde RG, Heethaar RM. Constant volume of the human lens and decrease in surface area of the capsular bag during accommodation: an MRI and Scheimpflug study. Invest Ophthalmol Vis Sci. 2009;50(1):281–289. doi: 10.1167/iovs.08-2124. - DOI - PubMed

LinkOut - more resources