Review
. 2019 Jan 1;36(1):35-107.
doi: 10.1039/c7np00064b. Epub 2018 Jul 13.

The value of universally available raw NMR data for transparency, reproducibility, and integrity in natural product research

James B McAlpine  1 Shao-Nong Chen  1 Andrei Kutateladze  2 John B MacMillan  3 Giovanni Appendino  4 Andersson Barison  5 Mehdi A Beniddir  6 Maique W Biavatti  7 Stefan Bluml  8 Asmaa Boufridi  9 Mark S Butler  10 Robert J Capon  10 Young H Choi  11 David Coppage  3 Phillip Crews  3 Michael T Crimmins  12 Marie Csete  13 Pradeep Dewapriya  10 Joseph M Egan  14 Mary J Garson  15 Grégory Genta-Jouve  16 William H Gerwick  17 Harald Gross  18 Mary Kay Harper  19 Precilia Hermanto  20 James M Hook  20 Luke Hunter  20 Damien Jeannerat  21 Nai-Yun Ji  22 Tyler A Johnson  3 David G I Kingston  23 Hiroyuki Koshino  24 Hsiau-Wei Lee  3 Guy Lewin  6 Jie Li  25 Roger G Linington  14 Miaomiao Liu  9 Kerry L McPhail  26 Tadeusz F Molinski  27 Bradley S Moore  17 Joo-Won Nam  27 Ram P Neupane  27 Matthias Niemitz  27 Jean-Marc Nuzillard  27 Nicholas H Oberlies  27 Fernanda M M Ocampos  5 Guohui Pan  27 Ronald J Quinn  9 D Sai Reddy  2 Jean-Hugues Renault  27 José Rivera-Chávez  27 Wolfgang Robien  27 Carla M Saunders  27 Thomas J Schmidt  27 Christoph Seger  27 Ben Shen  27 Christoph Steinbeck  27 Hermann Stuppner  27 Sonja Sturm  27 Orazio Taglialatela-Scafati  27 Dean J Tantillo  27 Robert Verpoorte  11 Bin-Gui Wang  28 Craig M Williams  15 Philip G Williams  27 Julien Wist  27 Jian-Min Yue  27 Chen Zhang  27 Zhengren Xu  27 Charlotte Simmler  1 David C Lankin  1 Jonathan Bisson  1 Guido F Pauli  1
Affiliations
Review

The value of universally available raw NMR data for transparency, reproducibility, and integrity in natural product research

James B McAlpine et al. Nat Prod Rep. .

Erratum in

  • Correction: The value of universally available raw NMR data for transparency, reproducibility, and integrity in natural product research.
    McAlpine JB, Chen SN, Kutateladze A, MacMillan JB, Appendino G, Barison A, Beniddir MA, Biavatti MW, Bluml S, Boufridi A, Butler MS, Capon RJ, Choi YH, Coppage D, Crews P, Crimmins MT, Csete M, Dewapriya P, Egan JM, Garson MJ, Genta-Jouve G, Gerwick WH, Gross H, Harper MK, Hermanto P, Hook JM, Hunter L, Jeannerat D, Ji NY, Johnson TA, Kingston DGI, Koshino H, Lee HW, Lewin G, Li J, Linington RG, Liu M, McPhail KL, Molinski TF, Moore BS, Nam JW, Neupane RP, Niemitz M, Nuzillard JM, Oberlies NH, Ocampos FMM, Pan G, Quinn RJ, Reddy DS, Renault JH, Rivera-Chávez J, Robien W, Saunders CM, Schmidt TJ, Seger C, Shen B, Steinbeck C, Stuppner H, Sturm S, Taglialatela-Scafati O, Tantillo DJ, Verpoorte R, Wang BG, Williams CM, Williams PG, Wist J, Yue JM, Zhang C, Xu Z, Simmler C, Lankin DC, Bisson J, Pauli GF. McAlpine JB, et al. Nat Prod Rep. 2019 Jan 1;36(1):248-249. doi: 10.1039/c8np90041h. Epub 2018 Nov 23. Nat Prod Rep. 2019. PMID: 30468235 Free PMC article.

Abstract

Covering: up to 2018With contributions from the global natural product (NP) research community, and continuing the Raw Data Initiative, this review collects a comprehensive demonstration of the immense scientific value of disseminating raw nuclear magnetic resonance (NMR) data, independently of, and in parallel with, classical publishing outlets. A comprehensive compilation of historic to present-day cases as well as contemporary and future applications show that addressing the urgent need for a repository of publicly accessible raw NMR data has the potential to transform natural products (NPs) and associated fields of chemical and biomedical research. The call for advancing open sharing mechanisms for raw data is intended to enhance the transparency of experimental protocols, augment the reproducibility of reported outcomes, including biological studies, become a regular component of responsible research, and thereby enrich the integrity of NP research and related fields.


Figures

Fig. 1
Fig. 1. The rigor and integrity of structure elucidation and chemical identity depend not only on the type of data used to build the evidence, but importantly also on the point of view from which they are analyzed. This can be symbolized by looking at Rubik's cube from various viewpoints: perspective (A) may lead to the conclusion that the cube is solved. The two other projections, (B) and (C), are both compatible with (A) and isometric. Both increase the amount of visible information, but while B confirms the original hypothesis derived from (A), (C) refutes it. Following this analogy, the availability of raw (NMR) data enables researchers to view the entire “cube of evidence” from the same and/or from different angles. Thus, raw (NMR) data is an important means of enhancing transparency, reproducibility, and integrity, and even empowers investigators to use existing evidence to generate new scientific insights.
Fig. 2
Fig. 2. The putative (A) and revised (B) structure of 2-heptyl-5-hexylfuran-3-carboxylic acid (HHCA; 3), which was reported as pseudopyronine-B. Arrows in A and B indicate 1H–13C HMBC correlations; red color indicates 4JH,H coupling of interest. Panel C shows the putative explanation of the MS/MS fragmentation of HHCA in negative mode; fragmentation of the pseudomolecular ion [M – H] = m/z 293.2. Panel D provides the correct true explanation for the observed MS/MS fragment. The arrow with the solid line in (C) and (D) directly shows the decarboxylation process.
Fig. 3
Fig. 3. 1H–13C HMBC NMR spectrum of pseudopyronine B (4); insert show details of the 160 ppm region.
Fig. 4
Fig. 4. Selected regions of 2D NMR spectra of arthrofactin (6). (A) The 1H–13C HMBC 2D NMR spectrum indicated that both Hα of Asp11 and Hβ of Thr3 are coupled with the carbonyl of Asp11. (B) The 1H–1H NOESY spectrum exhibited key NOE correlations between Hγ of Thr3 and Hα of Asp11, indicative of the ring closure between Thr3 and Asp11.
Fig. 5
Fig. 5. Comparison of the results of typical 1H NMR processing with spectrometer default settings (exponential multiplication [EM] with LB = 0.3 Hz; often the default processing scheme in NMR spectrometers) and lineshape-enhancing methods such as Gaussian–Lorentzian plus zero filling (LG) shows that raw data availability enables the analysis of what otherwise would be considered a multiplet or “br d” of H-5a in aquatolide (8). Representing a ddddq signal of near first order, a wealth of structural information can be extracted from raw data as simple as a 1D 1H NMR spectrum, for each of the hydrogen signals, yielding an almost complete structural picture of the aquatolide molecule from <200 kB of raw data.
Fig. 6
Fig. 6. Partial 1H NMR spectra of the authentic natural product (A) and synthetic [d-Hiva2], [d-MeAla11]-coibamide (B).
Fig. 7
Fig. 7. Downfield portion of the 1H NMR spectra of the authentic natural product (A), synthetic [d-Hiva2], [d-MeAla11]-coibamide (B), all-l-coibamide (C), and [d-MeAla11]-all-l-coibamide (D).
Fig. 8
Fig. 8. Simulation of the H2 multiplet (3.99 ppm) of aldingenin B with J1a,2 = 11.2 Hz and J1b2 = 4.8 Hz (apparent constants: 9.6 and 6.3 Hz, reported by Crimmins et al.96).
Fig. 9
Fig. 9. Generalisation of a caged skeleton containing a bridgehead double bond (bicyclo[m.n.o]).
Fig. 10
Fig. 10. 13C NMR spectra (150 MHz) of methylene region for (A) the originally proposed structure for aromin (33) and (B) montanacin D (34). Region for two methylenes at α-positions of ketone carbonyl group was omitted (48.74 (C8), 43.42 (C10) for 33, and 49.13 (C9), 43.76 ppm (C11) for 34, respectively). Spectra were measured in CDCl3 solution at 25 °C. Assignments were carried out by analyses of several 2D experiments including HMBC data.
Fig. 11
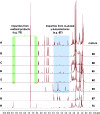
Fig. 11. NMR profiles of (A) gallinamide A (37), as reported and adopted from; (B) synthetic gallinamide A (37) as reported and adopted from; (C) symplostatin 4 (38) as isolated and adopted from; and (D) synthetic symplostatin 4 (38) as reported and adopted from. Variations in the spectra signals in the isoleucine region (1.0 to 3.0) led to speculation that the compounds were diastereomers. Further studies showed this was not the case after investigation and direct comparison of the region (highlighted red) by Conroy et al. Variations in pH and/or concentration give rise to other spectral differences, such as those seen in the NH region (highlighted green). The construction of this figure demonstrates the challenge of reporting high quality, scalable comparison data without access to the original files.
Fig. 12
Fig. 12. The partial 1H NMR spectra of phainanoid B (39; A) and phainanoid F (40; B).
Fig. 13
Fig. 13. Chemical shifts (ppm) and coupling constants (Hz) of OH-24 in the phainanoids B (39) and F (40): the optimized 3D structures ((A): OMe-25 represents phainanoid B; (B) OAc-25 represents phainanoid F) generated by Hartree–Fock/3-21G showing the dihedral angles of H–C–O–H (black) and H-bond angles (red) and lengths (Å).
Fig. 14
Fig. 14. Comparison of the 1H NMR signal splitting patterns of a mixture of elatenyne (53) and laurendecumenyne B (54) with different post-acquisition processing. Spectrum A shows the typical “standard” processing with exponential multiplication (EM) using an LB value of 0.3 Hz. Spectrum B was generated from the same FID in two steps: reference deconvolution for a 1.0 Hz lineshape optimization, followed by Lorentzian–Gaussian windows function (LG; LB = –2.2 Hz, GB = 0.25) for resolution enhancement. Both spectra were zero filled to 128k real data points. The resolution enhanced spectrum B allows a more consistent assignment of multiplicities and resonance locations, in particular for the key signals of H-9 and H-10.
Fig. 15
Fig. 15. Expanded HMBC spectrum of a mixture of elatenyne (53) and laurendecumenyne B (54).
Fig. 16
Fig. 16. An expansion of the calculated (above) and experimental (middle) 1H NMR spectrum of 5′-O-methyl-3-hydroxyflemingin A (57), as well as the difference (residual; below); recorded in CDCl3 at 600 MHz. The table shows the relevant assignments, chemical shifts, and coupling constants.
Fig. 17
Fig. 17. Comparison of the 1H NMR spectra of the target molecules to be isolated (59–63), the impurities contained, 67 and 71 and the mixture initially isolated (A).
Fig. 18
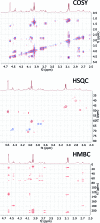
Fig. 18. Expanded 2D NMR spectra of the thiotetronate (63) showing the focused region of the impurity.
Fig. 19
Fig. 19. Low field region of the 1H NMR spectrum (500 MHz) of pseudoanisatin (72a + 72b). Top: spectrum in acetone-d6. Middle: spectrum of the same sample in D2O; bottom: spectrum of the same sample re-dissolved in acetone-d6 after the measurement in water. All assignments confirmed by 2D spectra. Signals of the cyclic hemiketal form 72b are marked with an asterisk. It becomes obvious from the signals of H-14b that water stabilizes the latter. Full reversibility of the change in the equilibrium is demonstrated by the spectrum shown at the bottom. The change of multiplicity of the H-3 signals is due to H/D exchange.
Fig. 20
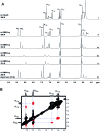
Fig. 20. NMR techniques that facilitate the identification of natural products existing as rotamers as exemplified by the structural elucidation of guangnanmycin A (74a/b). (A) 1H NMR spectra of guangnanmycin A recorded in CD3OD (I) and DMSO-d6 at varying temperatures (II–VI). (B) ROESY spectrum of guangnanmycin A with red signals denoting normal NOE correlations and black signals denoting the exchange correlation signals between the two rotamers appearing in the opposite phase.
Fig. 21
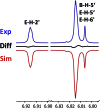
Fig. 21. Case study of proanthocyanidin A1 (PCA1, 75) which shows higher order effects. Quantum mechanical simulation (HiFSA) allows producing accurate NMR parameters of the experimental spectrum (Exp, in blue) and a perfectly fitted simulated spectrum (Sim, in red).
Fig. 22
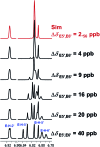
Fig. 22. Simulation of higher order spin systems of E-H-5′ and E-H-6′ in proanthocyanidin A1 (PCA1, 75) with various distances between two coupled-hydrogens. Simulation was performed with the PERCH software tool.
Fig. 23
Fig. 23. Workflow for the Web-Based Small Molecule Accurate Recognition Technology (SMART). The workflow is divided into two parts; ‘development’ and ‘deployment’. In the development section, new HSQC inputs are curated by SMART and used to train the modified deep Convolutional Neural Networks (CNN) algorithm. The training process is performed using cloud computing or a server machine. The training data set is compiled, the CNN algorithm tuned, and the web framework maintained. The training data set is compiled by merging user uploaded HSQC spectra and HSQC spectra obtained from literature publications. In the deployment section, HSQC spectra of newly isolated pure natural product molecules are automatically embedded by SMART into a cluster space near similar, previously-characterized compounds in the training data set. The resultant embedding in the cluster map is visualized in a 2D cluster map (nodes: HSQC spectra processed by SMART; node colors: compounds from the same natural product family; internode distance: a quantification of molecular structural similarity).
Fig. 24
Fig. 24. NMR spectra of five lead-like enhanced (LLE) fractions of the extract Sauropus sp. The fraction samples were prepared from NatureBank at the Griffith Institute for Drug Discovery (; https://www2.griffith.edu.au/institute-drug-discovery).
Fig. 25
Fig. 25. NMR fingerprints of single active fractions from four taxa, Erylus amissus, Garcinia sp., Cryptocarya novoguineensis, and Styrax faberi. The fraction samples were prepared from NatureBank at the Griffith Institute for Drug Discovery (; https://www2.griffith.edu.au/institute-drug-discovery).
Fig. 26
Fig. 26. Mycothiazole (88) full 1H NMR spectra (CDCl3, 600 MHz) annotated with atom position numbers with output obtained by classical FID work-up.
Fig. 27
Fig. 27. Mycothiazole (88) expanded 1H NMR spectra regions (CDCl3, 600 MHz) obtained from different FID processing. [A] H-15: top panel – classic FID workup, middle panel – J (Hz) measurements, bottom panel – FID workup using second derivative/nonlinear fitting processing. [B] H-15: top panel – J (Hz) measurements, bottom panel – FID reprocessing using a sign square apodization vs. that used for [A] bottom panel. [C] H-6: top panel – J (Hz) measurements, bottom panel – classic FID workup. [D] H-14: top panel – classic FID workup, middle panel – J (Hz) measurements, bottom panel – FID workup using second derivative/nonlinear fitting processing and suppression of H-6 resonance signals.
Fig. 28
Fig. 28. Mycothiazole (88) expanded 1H NMR spectra regions (CDCl3, 600 MHz) for H-7/7′ and H-3/3′ obtained from FIDs processed using second derivative/nonlinear fitting.
Fig. 29
Fig. 29. Mycothiazole (88) expanded 1H NMR spectral regions (CDCl3, 600 MHz) for H-5 and H-17 obtained from FIDs processed using second derivative/nonlinear fitting.
Fig. 30
Fig. 30. Mycothiazole(88) partial HMBC spectra (CDCl3, 500/125 MHz) obtained by classic work-up of FIDS but expanded to show the faint ‘breakthrough’ correlations used to measure 1JC-11,H-11 = 186.9 Hz.
Fig. 31
Fig. 31. 1H NMR spectrum of bis-(methylthio)-ester 94 (400 MHz, CDCl3). The X-scale is in Hz. (A) normalized Y-scale. (B) Vertical expansion of (A). Note, coincidence of the two SMe signals (2.43 ppm, s). Sample and spectra, courtesy of M. N. Salib (UC San Diego).
Fig. 32
Fig. 32. Comparison of 1H NMR spectra processed with default settings (i.e., EM with an LB value of 0.3 Hz) vs. the use of line shape enhancement (i.e., SINM plus EM with an LB value of 0.3 Hz) for H-6 of butein (100) at 7.11 ppm.
Fig. 33
Fig. 33. Comparison of 1H NMR spectra processed with default settings (i.e., EM with an LB value of 0.3 Hz) vs. the use of line shape enhancement (i.e., SINM plus EM with an LB value of 0 Hz) for H-8′ of vernoniyne (101) at 1.97 ppm. Comparison of typical long-range 1H–13C correlation map processed with 1 K per 512 data (i.e., without zero-filling) in F2 and F1, respectively and QSINE as window functions in both dimensions and higher processed using EM of 0.0 Hz on both dimensions and zero-filling to 4 K per 1 K in F2 and F1, respectively. This is just a simple example, there are many other advanced ways to process 2D correlation maps.
Fig. 34
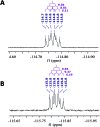
Fig. 34. The 13C NMR spectrum of the aromatic region of (A) m-F-l-phenylalaninol standard (125 MHz in MeOH-d3), and (B) m-F-phenylalaninol in m-F-Pheol-alamethicin F50 (175 MHz in MeOH-d3). The prominent doublet (with a JCF of ∼243 Hz) indicated the point of attachment of the 19F in the molecule. The other aromatic 13C signals all display doublets due to long-range coupling to this 19F.
Fig. 35
Fig. 35. The 19F NMR spectrum of (A) m-F-l-phenylalaninol standard, and (B) m-F-phenylalaninol in m-F-Pheol-alamethicin F50. The observed coupling constants are for JHF. Running the 19F NMR experiment is a straightforward way to verify its incorporation. Both spectra were obtained at 470 MHz in MeOH-d3.
Fig. 36
Fig. 36. Partial 1H, 1H-decoupled 19F, 19F, and 19F-decoupled 1H NMR spectra of N-Boc-4,4-difluoroproline (103), showing all of the ring-attached atoms in each case. Twin sets of signals are observed due to the presence of Boc rotamers. The indicated J-values (top) correspond to the major rotamer of 103.
Fig. 37
Fig. 37. 1H NMR (900 MHz, methanol-d4) spectrum for amycin B (107).
Fig. 38
Fig. 38. Support for the call for disseminating raw NMR data comes from the global natural product research community, as shown by the locations of the authors who contributed to the present study.
None
James B. McAlpine
None
Guido F. Pauli

References

    1. Bisson J., Simmler C., Chen S.-N., Friesen J. B., Lankin D. C., McAlpine J. B., Pauli G. F. Nat. Prod. Rep. 2016;33:1028–1033. - PMC - PubMed
    1. Elyashberg M., Williams A. J. and Blinov K., Contemporary Computer-Assisted Approaches to Molecular Structure Elucidation, The Royal Society of Chemistry, Cambridge, 2012.
    1. Buevich A. V., Elyashberg M. E. J. Nat. Prod. 2016;79:3105–3116. - PubMed
    1. Lodewyk M. W., Soldi C., Jones P. B., Olmstead M. M., Rita J., Shaw J. T., Tantillo D. J. J. Am. Chem. Soc. 2012;134:18550–18553. - PubMed
    1. Kuhn S., Schlörer N. E. Magn. Reson. Chem. 2015;53:582–589. - PubMed

Publication types

MeSH terms

Substances