

Analysis of oxygen uptake efficiency parameters in young people with cystic fibrosis
- PMID: 30003381
- PMCID: PMC6153633
- DOI: 10.1007/s00421-018-3926-8
Analysis of oxygen uptake efficiency parameters in young people with cystic fibrosis
Abstract
Purpose: This study characterised oxygen uptake efficiency (OUE) in children with mild-to-moderate cystic fibrosis (CF). Specifically, it investigated (1) the utility of OUE parameters as potential submaximal surrogates of peak oxygen uptake ([Formula: see text]), and (2) the relationship between OUE and disease severity.
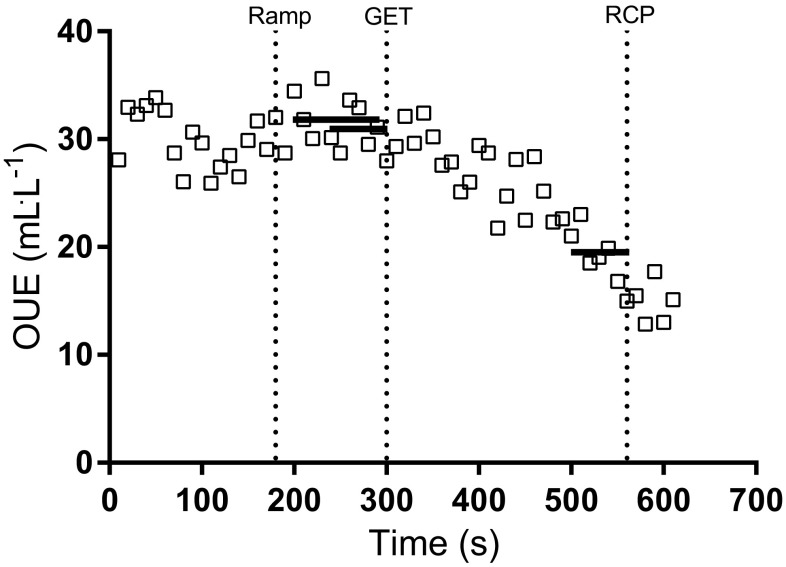
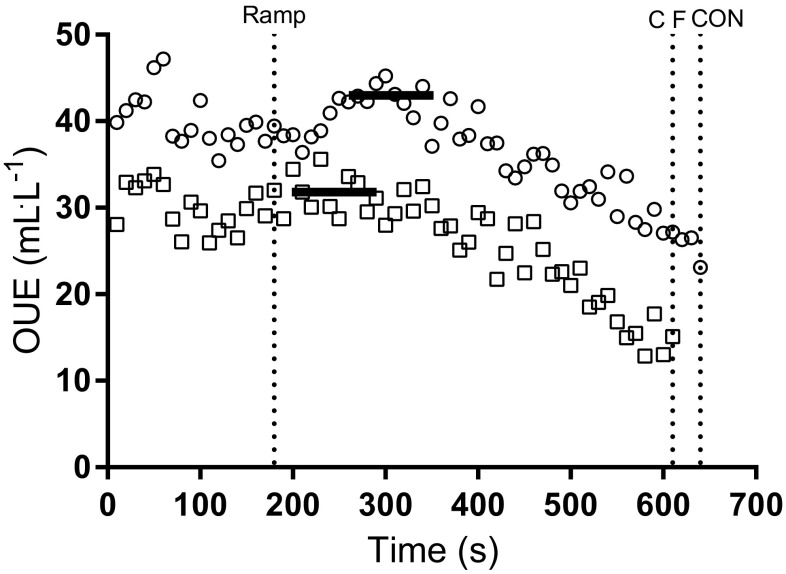
Methods: Cardiopulmonary exercise test (CPET) data were collated from 72 children [36 CF, 36 age- and sex-matched controls (CON)], with OUE assessed as its highest 90-s average (plateau; OUEP), the gas exchange threshold (OUEGET) and respiratory compensation point (OUERCP). Pearson's correlation coefficients, independent t tests and factorial ANOVAs assessed differences between groups and the use of OUE measures as surrogates for [Formula: see text].
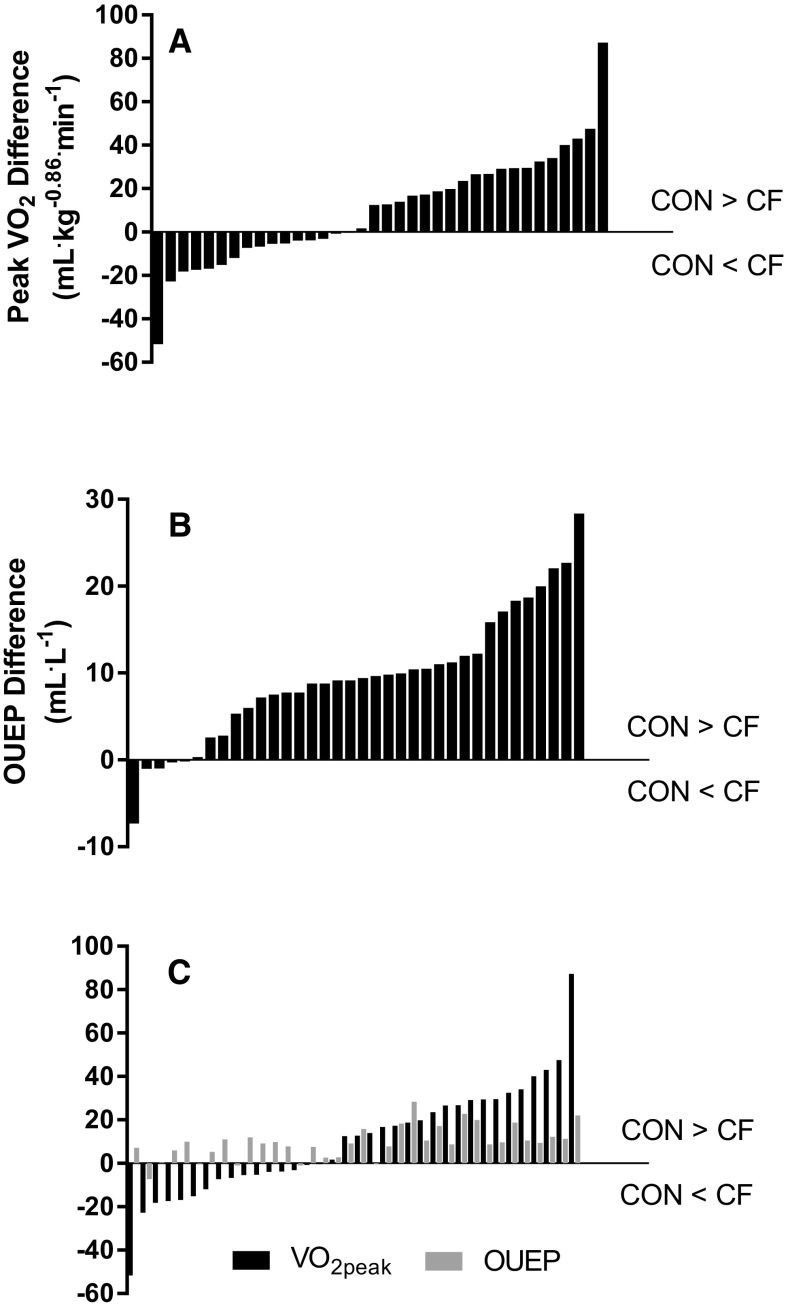
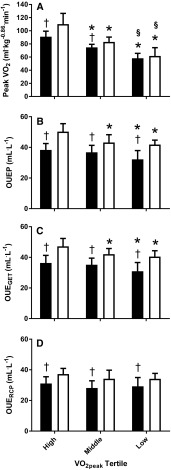
Results: A significant (p < 0.05) reduction in allometrically scaled [Formula: see text] and all OUE parameters was found in CF. Significant (p < 0.05) correlations between measurements of OUE and allometrically scaled [Formula: see text], were observed in CF (r = 0.49-0.52) and CON (r = 0.46-0.52). Furthermore, measures of OUE were significantly (p < 0.05) correlated with pulmonary function (FEV1%predicted) in CF (r = 0.38-0.46), but not CON (r = -0.20-0.14). OUEP was able to differentiate between different aerobic fitness tertiles in CON but not CF.
Conclusions: OUE parameters were reduced in CF, but were not a suitable surrogate for [Formula: see text]. Clinical teams should, where possible, continue to utilise maximal CPET parameters to measure aerobic fitness in children and adolescents with CF. Future research should assess the prognostic utility of OUEP as it does appear sensitive to disease status and severity.
Keywords: Adolescence; Aerobic fitness; Exercise testing; Paediatrics; Respiratory disease.
Conflict of interest statement
LVC is currently an employee of Springer Nature, but was solely associated with the University of Exeter at the time that the research was conducted.
Figures
References
-
- Abdi H. The Bonferonni and Šidák corrections for multiple comparisons. In: Salkind N, editor. Encyclopedia of measurement and statistics. Thousand Oaks: Sage; 2007. pp. 103–107.
-
- Arena R, Myers J, Hsu L, Peberdy MA, Pinkstaff S, Bensimhon D, Chase P, Vicenzi M, Guazzi M. The minute ventilation/carbon dioxide production slope is prognostically superior to the oxygen uptake efficiency slope. J Cardiac Fail. 2007;13(6):462–469. doi: 10.1016/j.cardfail.2007.03.004. - DOI - PubMed
-
- Baba R, Nagashima M, Goto M, Nagano Y, Yokota M, Tauchi N, Nishibata K. Oxygen uptake efficiency slope: a new index of cardiorespiratory functional reserve derived from the relation between oxygen uptake and minute ventilation during incremental exercise. J Am Coll Cardiol. 1996;28(6):1567–1572. doi: 10.1016/S0735-1097(96)00412-3. - DOI - PubMed
-
- Barron A, Francis DP, Mayet J, Ewert R, Obst A, Mason M, Elkin S, Hughes AD, Wensel R. Oxygen uptake efficiency slope and breathing reserve, not anaerobic threshold, discriminate between patients with cardiovascular disease over chronic obstructive pulmonary disease. JACC Heart Fail. 2016;4(4):252–261. doi: 10.1016/j.jchf.2015.11.003. - DOI - PMC - PubMed
MeSH terms
Substances
LinkOut - more resources
Full Text Sources
Other Literature Sources
Medical
