. 2019 Mar;56(3):2185-2201.
doi: 10.1007/s12035-018-1205-7. Epub 2018 Jul 12.

Absence of Stress Response in Dorsal Raphe Nucleus in Modulator of Apoptosis 1-Deficient Mice

Affiliations

Absence of Stress Response in Dorsal Raphe Nucleus in Modulator of Apoptosis 1-Deficient Mice

Hui Zhao et al. Mol Neurobiol. 2019 Mar.

Abstract

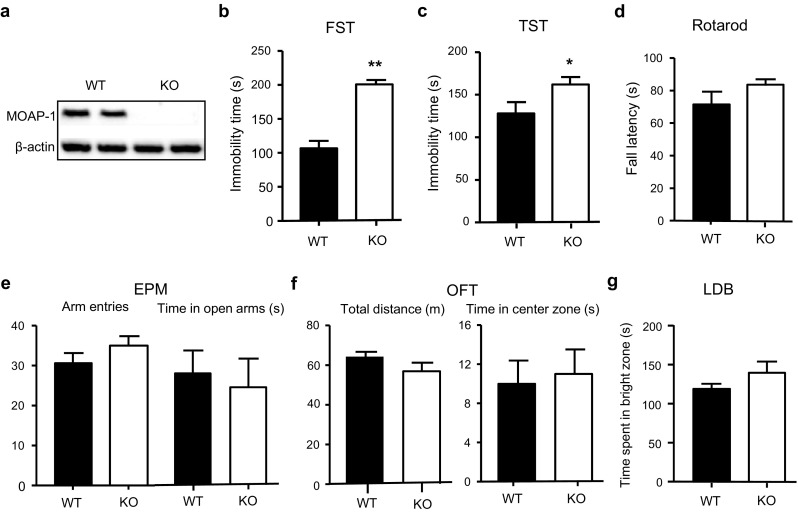
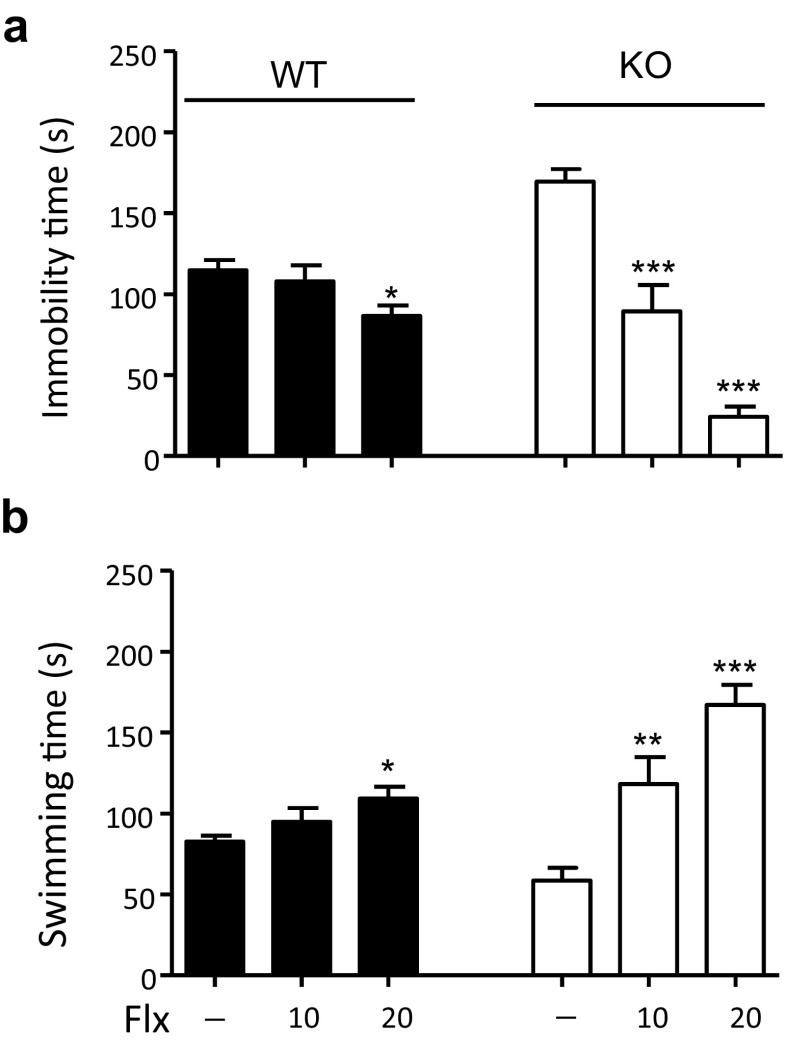
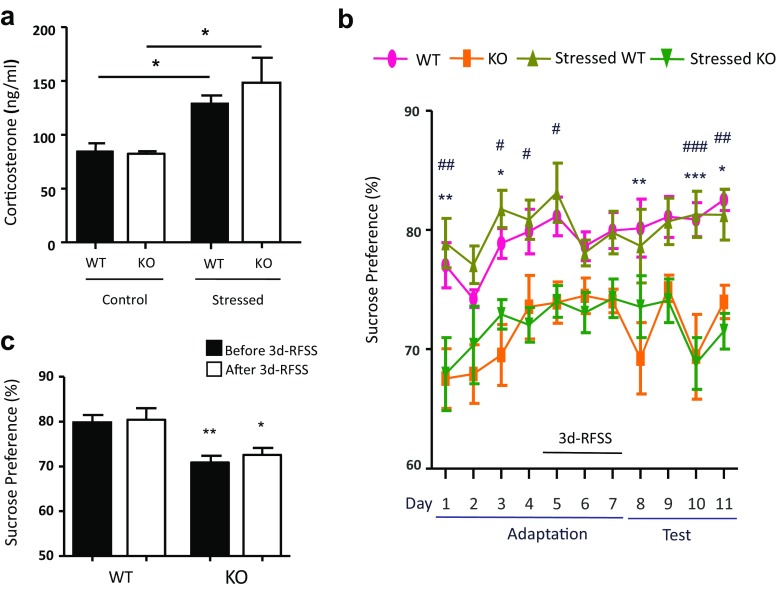
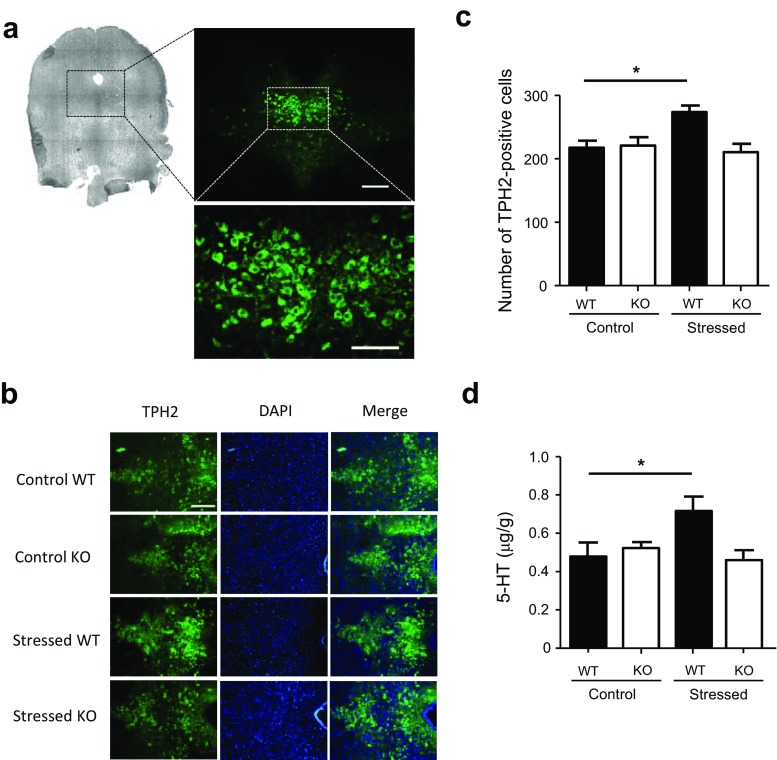
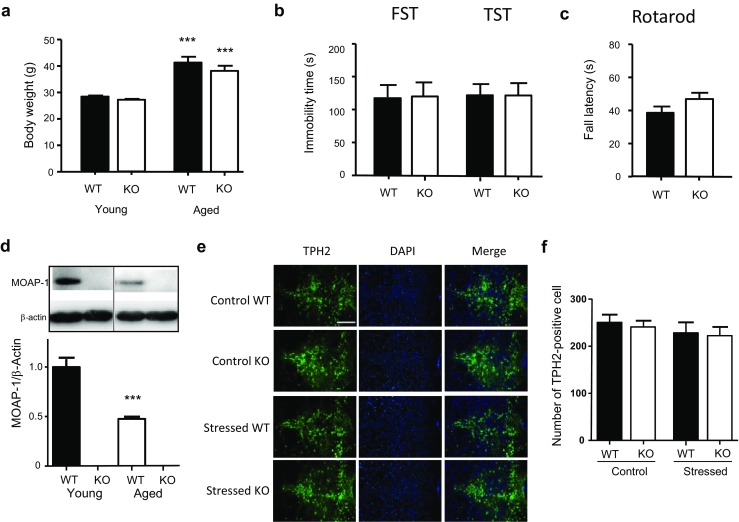
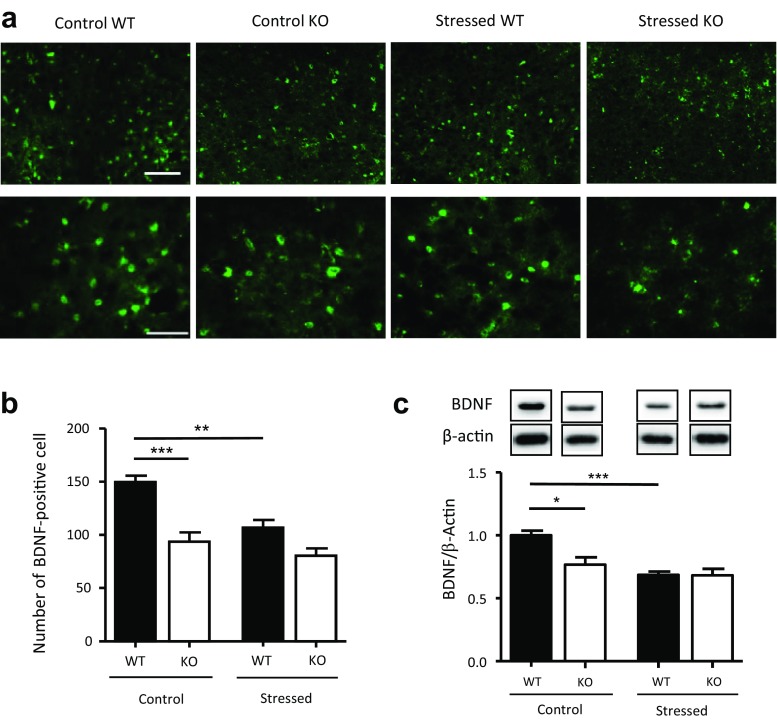
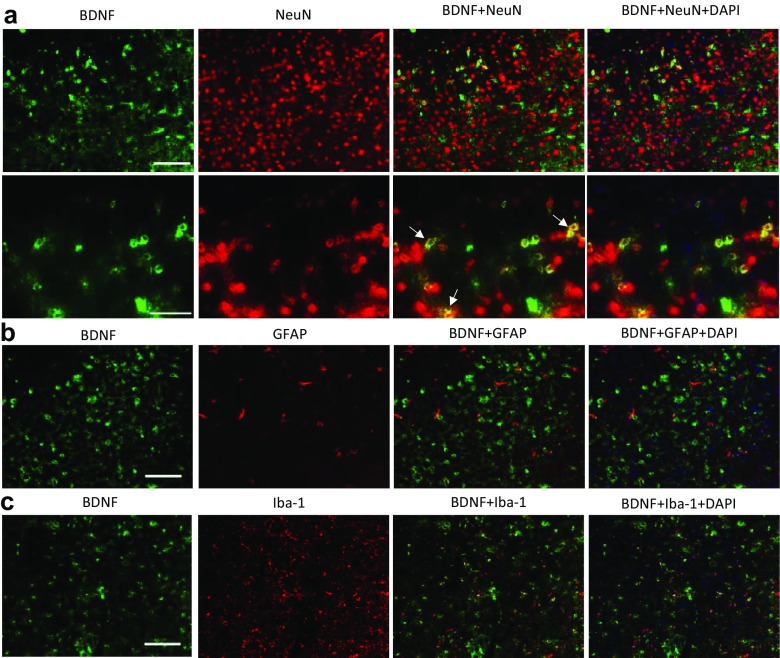
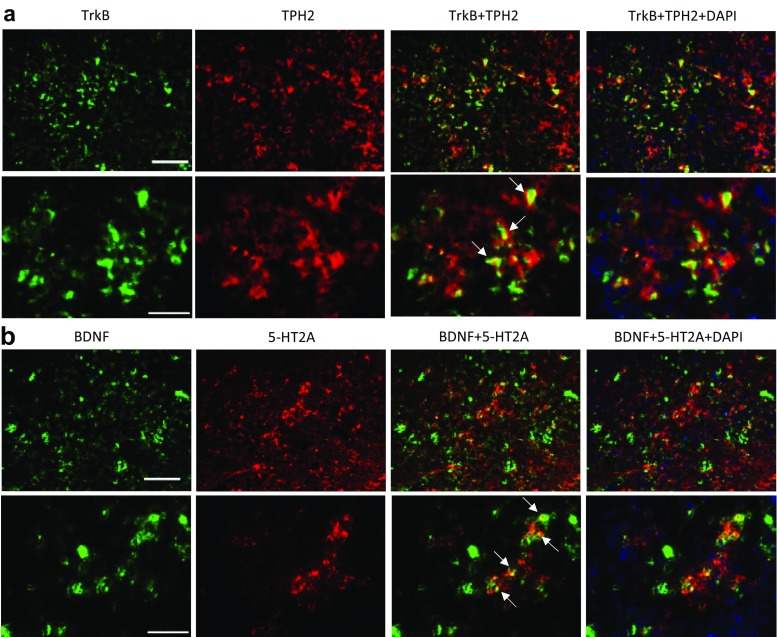
Modulator of apoptosis 1 (MOAP-1) is a Bcl-2-associated X Protein (BAX)-associating protein that plays an important role in regulating apoptosis. It is highly enriched in the brain but its function in this organ remains unknown. Studies on BAX-/- mice suggested that disruption of programmed cell death may lead to abnormal emotional states. We thus hypothesize that MOAP-1-/- mice may also display stress-related behavioral differences and perhaps involved in stress responses in the brain and investigated if a depression-like trait exists in MOAP-1-/- mice, and if so, whether it is age related, and how it relates to central serotonergic stress response in the dorsal raphe nucleus. Young MOAP-1-/- mice exhibit depression-like behavior, in the form of increased immobility time when compared to age-matched wild-type mice in the forced swimming test, which is abolished by acute treatment of fluoxetine. This is supported by data from the tail suspension and sucrose preference tests. Repeated forced swimming stress causes an up-regulation of tryptophan hydroxylase 2 (TPH2) and a down-regulation of brain-derived neurotrophic factor (BDNF) in the dorsal raphe nucleus (DRN) in young wild-type (WT) control mice. In contrast, TPH2 up-regulation was not observed in aged WT mice. Interestingly, such a stress response appears absent in both young and aged MOAP-1-/- mice. Aged MOAP-1-/- and WT mice also have similar immobility times on the forced swimming test. These data suggest that MOAP-1 is required in the regulation of stress response in the DRN. Crosstalk between BDNF and 5-HT appears to play an important role in this stress response.

Keywords: Brain-derived neurotrophic factor; Depression; Dorsal raphe nucleus; Modulator of apoptosis; Serotonin; Stress.


Conflict of interest statement

Conflict of Interest

The authors declare that they have no conflict of interest.

Figures

Fig. 1
Fig. 1
Performance of modulator of apoptosis 1 (MOAP-1)−/− (KO) and wild-type control (WT) mice (age 3–6 months) in various behavioral tests. a Western blot showing a lack of MOAP-1 protein expression in the cerebral cortex of MOAP-1−/− mice. b Immobility time in the forced swimming test (FST), n = 15–17. c Immobility time in the tail suspension test (TST), n = 15–18. d Fall latency in the rotarod test, n = 14. e Total number of arm entries and time spent in open arms on the elevated plus maze (EPM), n = 10. f Total distance traveled and time spent in the center zone in the open field test (OFT), n = 10–12. g Time spent in bright zone in the light dark box (LDB), n = 15. Data are presented as mean ± SEM. Total trial time was 4 min for FST, 10 min for OFT, and 5 min for all others. *P < 0.05, **P < 0.01 against WT by independent two-tailed t test
Fig. 2
Fig. 2
Effects of fluoxetine (Flx) on the FST in modulator of apoptosis 1 (MOAP-1)−/− (KO) and wild-type control (WT) mice. Mice (n = 8–10, 3–6 months old) were administered Flx (10 or 20 mg/kg) 30 min before the forced swimming test. Duration (s) of the immobility (a) and swimming (b) are presented as mean ± SEM. Statistical analysis was performed by one-way ANOVA: a For WT mice, F = 3.624, P < 0.05. For MOAP-1−/− mice, F = 58.61, P < 0.001. b For WT mice, F = 3.531, P < 0.05. For MOAP-1−/− mice, F = 20.90, P < 0.001. *P < 0.05, **P < 0.01, and ***P < 0.001 against untreated control by post hoc analysis with Bonferroni correction
Fig. 3
Fig. 3
Effects of 3d-RFSS on plasma corticosterone levels and sucrose preference in modulator of apoptosis 1 (MOAP-1)−/− (KO) and wild-type control (WT) mice (age 3–6 months). a Plasma corticosterone levels with or without stress treatment, n = 4–5. Data are presented as mean ± SEM. Statistical analysis was performed by one-way ANOVA: F = 5.848, P < 0.05. *P < 0.05 against control WT or MOAP-1 KO by Bonferroni correction. b Sucrose preference measured daily in WT and MOAP-1−/− mice over 11 days. 3d-RFSS was applied from days 5–7. Data are presented as mean ± SEM, n = 8. Statistical analysis was performed by two-way ANOVA with repeated measures followed by Bonferroni correction: day factor: F = 4.54, P < 0.001; group factor: F = 16.91, P < 0.001; day × group interaction: F = 0.90, P = 0.6274. *P < 0.05, **P < 0.01, and ***P < 0.001 for WT vs KO; #P < 0.05, ##P < 0.01, and ###P < 0.001 for stressed WT vs stressed KO. c Comparison between before stress (combined data for days 1–4) and after stress (combined data for days 8–11). Data are presented as mean ± SEM, n = 8. Statistical analysis was performed by one-way ANOVA followed by Bonferroni correction: F = 8.254, P < 0.001. *P < 0.05, **P < 0.01 when compared to the corresponding WT controls
Fig. 4
Fig. 4
Effects of stress on the expression of tryptophan hydroxylase (TPH) 2 in the dorsal raphe nucleus (DRN) of modulator of apoptosis 1 (MOAP-1)−/− (KO) and wild-type control (WT) mice (age 3–6 months). a Brightfield image of a coronal section of mouse midbrain at − 4.6 mm from Bregma (left panel). TPH2 immunofluorescent staining can be seen concentrated in the DRN. Scale bar = 200 μm (middle panel) and 100 μm (right panel). b Representative photomicrographs of TPH2 immunofluorescent staining in the DRN of the WT and MOAP-1−/− mice with or without stress treatment. Scale bar = 200 μm. c Number of TPH2 immunopositive cells in the DRN in WT and MOAP-1−/− mice with or without stress treatment, n = 3–6. Data are presented as mean ± SEM. ANOVA: F = 5.917, P < 0.05. *P < 0.05 for control vs stressed WT mice by Bonferroni correction. d 5-HT levels in midbrain of WT and MOAP-1−/− mice with or without stress treatment, n = 4. Data are presented as mean ± SEM. ANOVA: F = 4.366, P < 0.05. *P < 0.05 for control vs stressed WT mice by Bonferroni correction
Fig. 5
Fig. 5
Behavior and stress response in aged (22–26 months old) modulator of apoptosis 1 (MOAP-1)−/− (KO) and wild-type control (WT) mice. a Comparison of body weight of young (n = 19) and aged (n = 12) MOAP-1+/+ and MOAP-1−/− mice. One-way ANOVA: F = 45.65, P < 0.0001. ***P < 0.001 against the corresponding young mice by Bonferroni correction. b Performance of aged mice in the FST and TST, n = 14–15. No statistical significance observed. c Fall latency of aged mice in the rotarod test, n = 15–17. No statistical significance observed. d Western blot showing decreased MOAP-1 protein expression in the midbrain region of aged WT in comparison to young (3–6 months) WT mice. ***P < 0.001 against young WT mice by independent two-tailed t test. e Representative photomicrographs of tryptophan hydroxylase (TPH) 2 immunofluorescent staining in the dorsal raphe nucleus (DRN) of the aged WT and MOAP-1−/− mice with or without 3d-RFSS treatment. Scale bar = 200 μm. f Number of TPH2 immunopositive cells in the DRN in WT and MOAP-1−/− mice, n = 3–4. ANOVA: F = 0.515, not significant. Data are presented as mean ± SEM
Fig. 6
Fig. 6
Effects of stress on the expression of brain-derived neurotrophic factor (BDNF) in the dorsal raphe nucleus (DRN) of modulator of apoptosis 1 (MOAP-1)−/− (KO) and wild-type control (WT) mice (age 3–6 months). a Representative photomicrographs of BDNF immunofluorescent staining in the DRN of the WT and MOAP-1−/− mice with or without stress treatment. Scale bar = 100 μm (top panel) or 50 μm (bottom panel). b Number of BDNF immunopositive cells in the DRN in WT and MOAP-1−/− mice with or without stress treatment, n = 4–5. Data are presented as mean ± SEM. ANOVA: F = 17.38, P < 0.001. **P < 0.01 and ***P < 0.001 against control WT by Bonferroni correction. c Expression of BDNF in the midbrain region by Western blot analysis, n = 3–4. Data are presented as mean ± SEM. ANOVA: F = 10.52, P < 0.05. *P < 0.05, ***P < 0.001 by Bonferroni correction. Representative blot bands of the corresponding groups are shown in the top panel
Fig. 7
Fig. 7
Cellular localization of brain-derived neurotrophic factor (BDNF) in the dorsal raphe nucleus (DRN) of wildtype mice. a Double staining of BDNF with NeuN. Scale bar = 100 μm (top) and 50 μm (bottom). White arrows indicate colocalization. b Double staining of BDNF with glial fibrillary acidic protein (GFAP). Scale as in (a), top panel. c Double staining of BDNF with induction of brown adipocytes 1 (Iba-1). Scale as in (a), top panel
Fig. 8
Fig. 8
Double immunostaining of a tropomyosin-related kinase B (TrkB) and tryptophan hydroxylase 2 (TPH2) and b brain-derived neurotrophic factor (BDNF) and 5-hydroxytryptamine (5HT)2A receptor in the dorsal raphe nucleus (DRN) of wild-type mice. Scale bars = 100 μm (top) or 50 μm (bottom). White arrows indicate colocalization
Fig. 9
Fig. 9
Neurogenesis in the hippocampus of modulator of apoptosis 1 (MOAP-1)−/− (KO) and wild-type control (WT) mice following 3d-RFSS (age 3–6 months). Immunohistochemical staining of a BrdU, b Ki67, and c DCX in the dentate gyrus. The right panels are representative photomicrographs. Arrows indicate positively stained cells. The white box indicates the area where the high magnification photomicrograph was taken. Scale bar = 200 or 40 μm. The left panels present the number of positively stained cells. Data are presented as mean ± SEM, n = 4. Statistical analysis performed by one-way ANOVA: a F = 0.2749, b F = 0.6245, c F = 0.3487, no statistical significance

References

    1. Fu NY, Sukumaran SK, Yu VC. Inhibition of ubiquitin-mediated degradation of MOAP-1 by apoptotic stimuli promotes BAX function in mitochondria. Proc Natl Acad Sci U S A. 2007;104:10051–10056. - PMC - PubMed
    1. Tan KO, Fu NY, Sukumaran SK, Chan SL, Kang JH, Poon KL, Chen BS, Yu VC. MAP-1 is a mitochondrial effector of BAX. Proc Natl Acad Sci U S A. 2005;102:14623–14628. - PMC - PubMed
    1. Tan KO, Tan KM, Chan SL, Yee KS, Bevort M, Ang KC, Yu VC. MAP-1, a novel proapoptotic protein containing a BH3-like motif that associates with BAX through its Bcl-2 homology domains. J Biol Chem. 2001;276:2802–2807. - PubMed
    1. Law J, Salla M, Zare A, Wong Y, Luong L, Volodko N, Svystun O, Flood K, Lim J, Sung M, Dyck JRB, Tan CT, Su YC, Yu VC, Mackey J, Baksh S. Modulator of apoptosis 1 (MOAP-1) is a tumor suppressor protein linked to the RASSF1A protein. J Biol Chem. 2015;290:24100–24118. - PMC - PubMed
    1. Tan CT, Zhou QL, Su YC, Fu NY, Chang HC, Tao RN, Sukumaran SK, Baksh S, Tan YJ, Sabapathy K, Yu CD, Yu VC. MOAP-1 mediates Fas-induced apoptosis in liver by facilitating tBid recruitment to mitochondria. Cell Rep. 2016;16:174–185. - PubMed

MeSH terms

Substances