

Single neuron activity and c-Fos expression in the rat striatum following electrical stimulation of the peripheral vestibular system
- PMID: 30003674
- PMCID: PMC6043475
- DOI: 10.14814/phy2.13791
Single neuron activity and c-Fos expression in the rat striatum following electrical stimulation of the peripheral vestibular system
Abstract
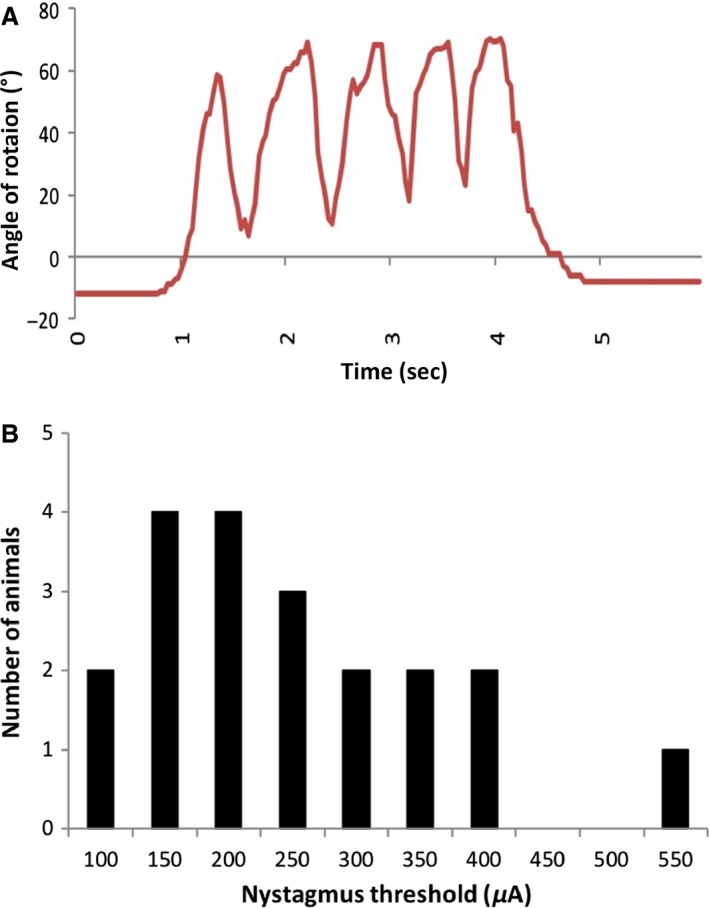
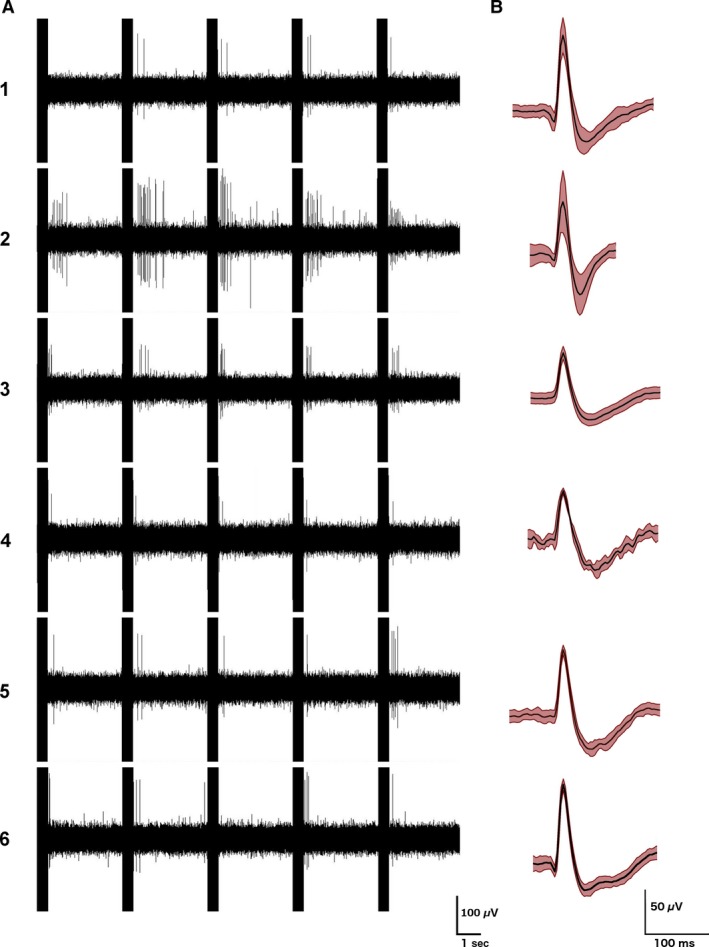
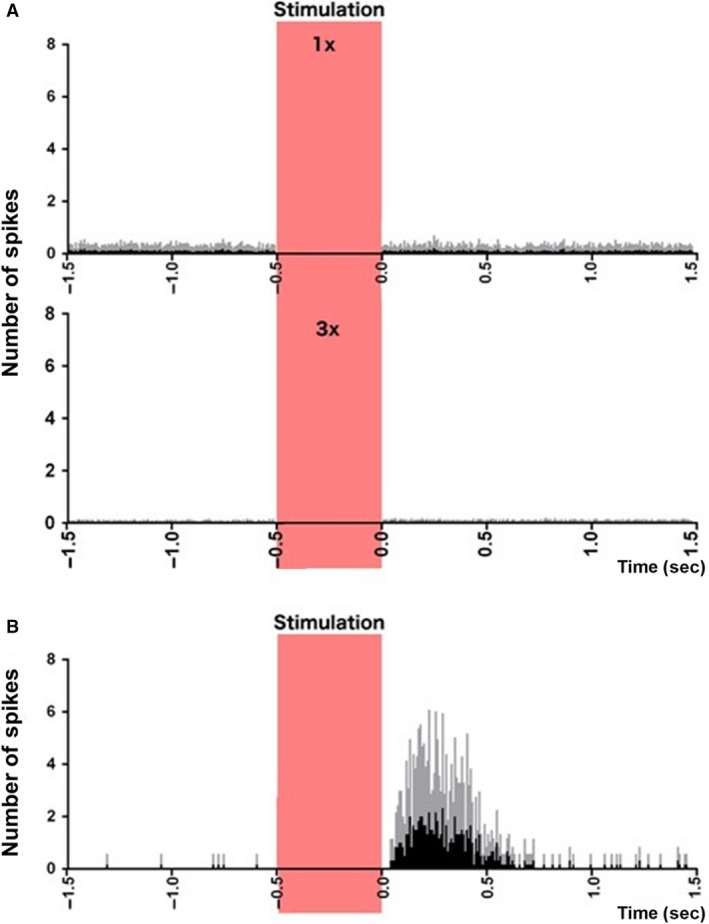
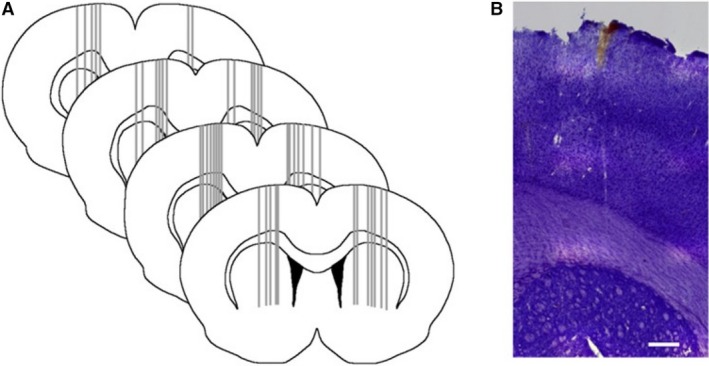
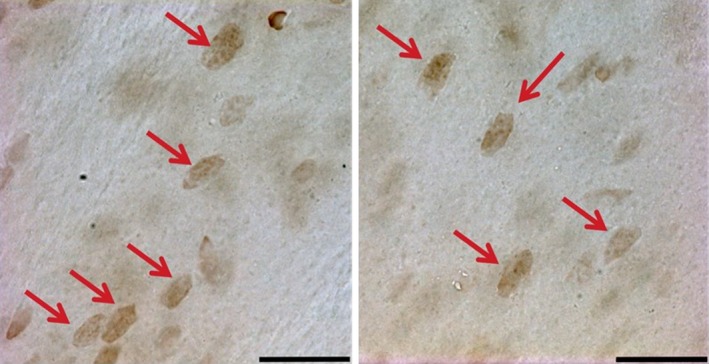
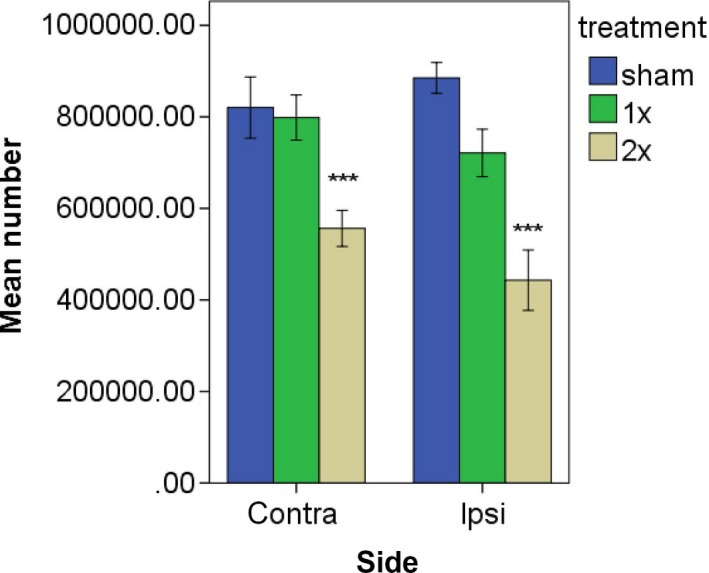
Connections between the vestibular system and the basal ganglia have been postulated since the early 20th century. However, the results of electrophysiological studies investigating neuronal responses to electrical stimulation of the vestibular system have been inconsistent. The aim of this study was to investigate the effects of electrical stimulation of the vestibular labyrinth on single neuron activity and c-Fos expression in the rat striatum. We used electrical stimulation of the vestibular labyrinth (various intensities delivered to the round window) to examine the electrophysiological response of striatal neurons and c-Fos expression. From 507 single neurons recorded (n = 20 rats), no vestibular-responsive neuron was found at 1× and 2× the nystagmus threshold; however, 6 neurons were found at 3× the threshold. These neurons were found bilaterally, with a response latency of ~50 msec from the end of the stimulus. For the c-Fos study, the number of neurons expressing c-Fos was quantified using stereological methods. Stimulation at 2× the threshold for nystagmus (n = 5 rats) resulted in a significant decrease in the number of neurons expressing c-Fos in the bilateral striatum compared to both the sham control group (n = 5) and the lower stimulus intensity group (n = 5) (P ≤ 0.0001 for both). The results of this study demonstrate that: (1) some single striatal neurons respond to electrical vestibular stimulation, however, these responses are circumscribed and infrequent; (2) electrical stimulation of the vestibular labyrinth results in a decrease in the number of striatal neurons expressing c-Fos, in a current-dependent manner.
Keywords: c-Fos; single neurons; striatum; vestibular.
© 2018 The Authors. Physiological Reports published by Wiley Periodicals, Inc. on behalf of The Physiological Society and the American Physiological Society.
Figures


References
-
- Anker, A. , Ali A., Arendt H., Cass S., Cotter L., Jian B., et al. 2003. Use of electrical vestibular stimulation to alter genioglossal muscle activity in awake cats. J. Vestib. Res. 13:1–8. - PubMed
-
- Barnes, T. D. , Kubota Y., Hu D., Jin D. Z., and Graybiel A. M.. 2005. Activity of striatal neurons reflects dynamic encoding and recoding of procedural memories. Nature 437:1158–1161. - PubMed
-
- Barter, J. W. , Castro S., Sukharnikova T., Rossi M. A., and Yin H. H.. 2014. The role of the substantia nigra in posture control. Eur. J. Neurosci. 39:1465–1473. - PubMed
Publication types
MeSH terms
Substances
LinkOut - more resources
Full Text Sources
Other Literature Sources
