. 2018 Jul 13:7:e37963.
doi: 10.7554/eLife.37963.

SLC6A14, an amino acid transporter, modifies the primary CF defect in fluid secretion

Affiliations

SLC6A14, an amino acid transporter, modifies the primary CF defect in fluid secretion

Saumel Ahmadi et al. Elife. .

Abstract

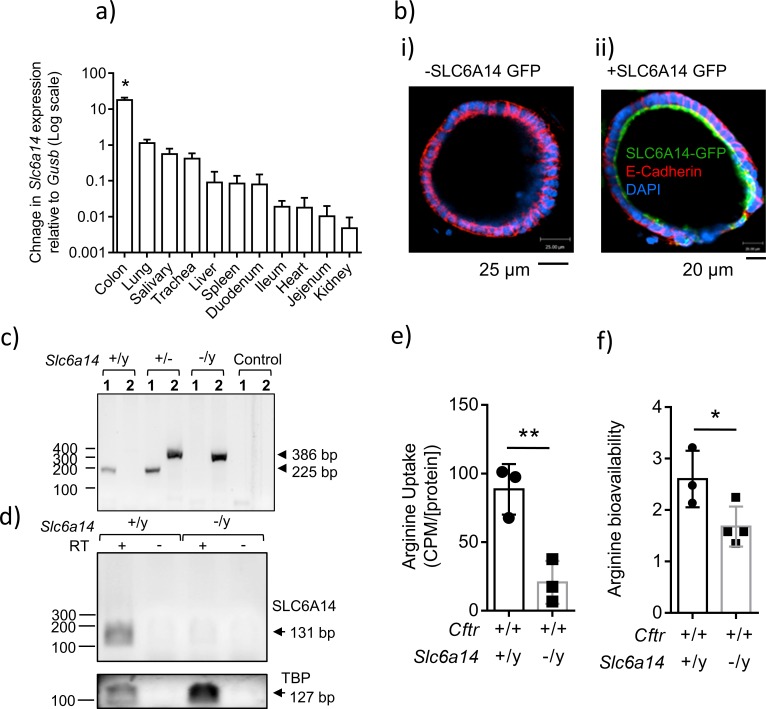
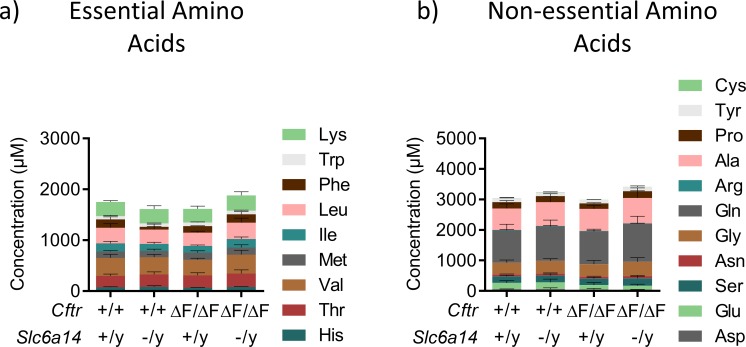
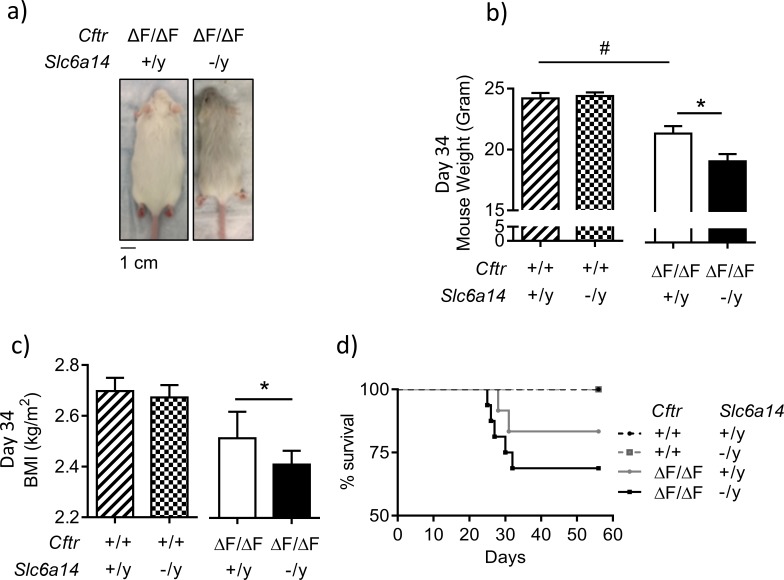
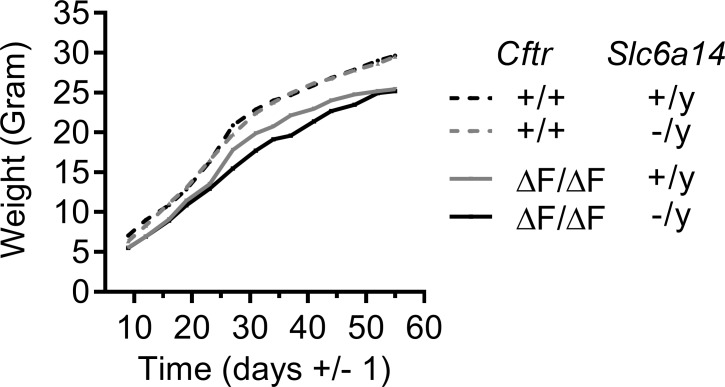
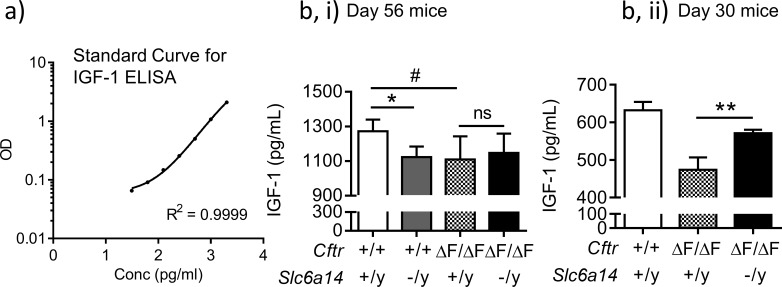
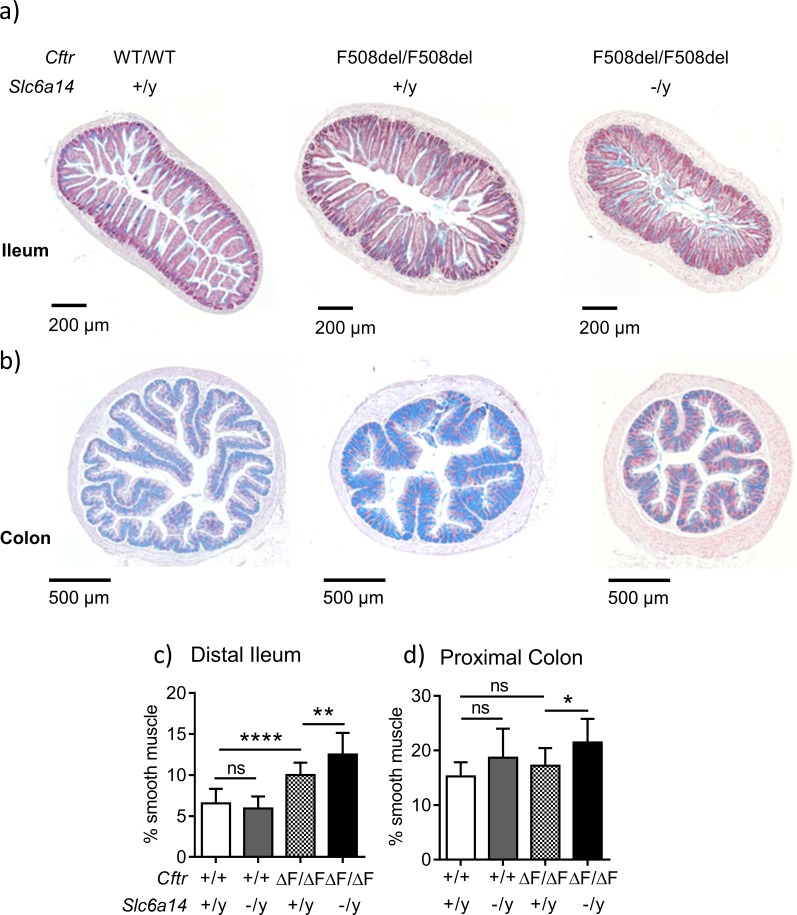
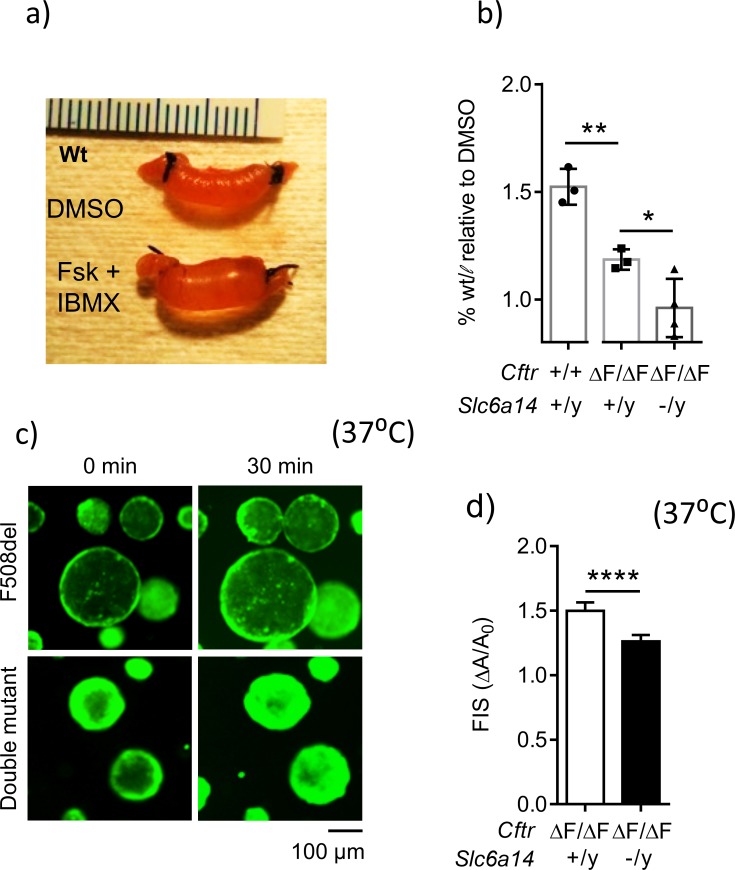
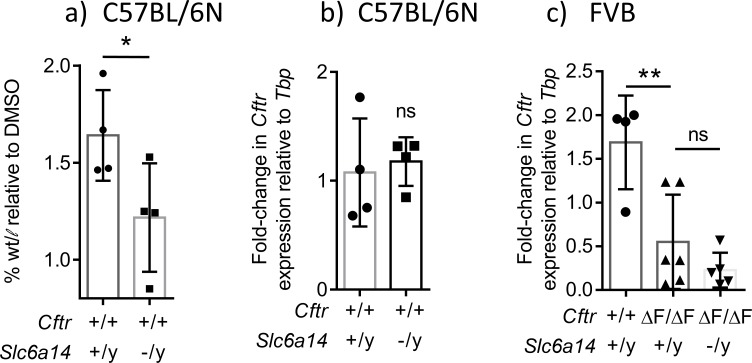
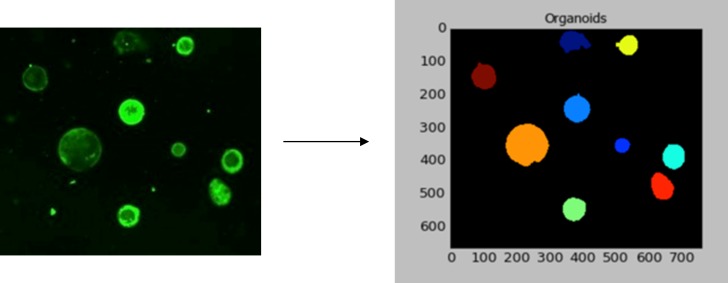
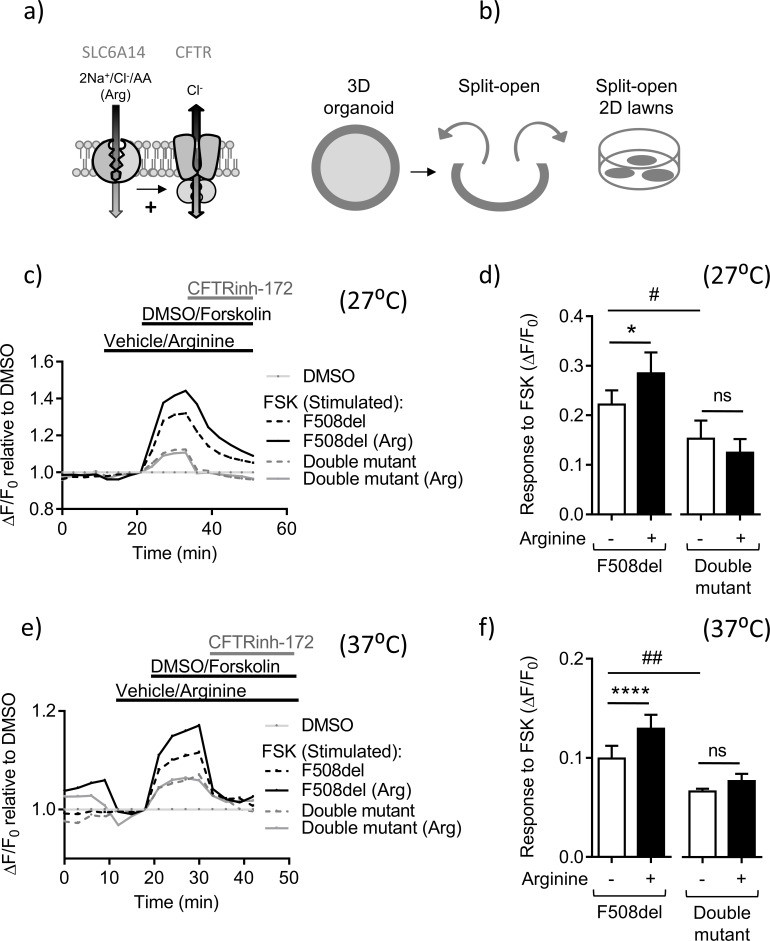
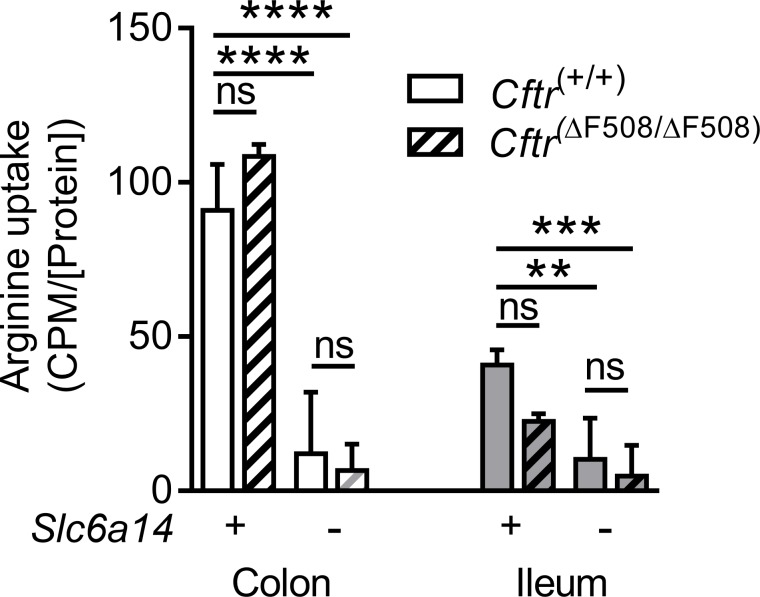
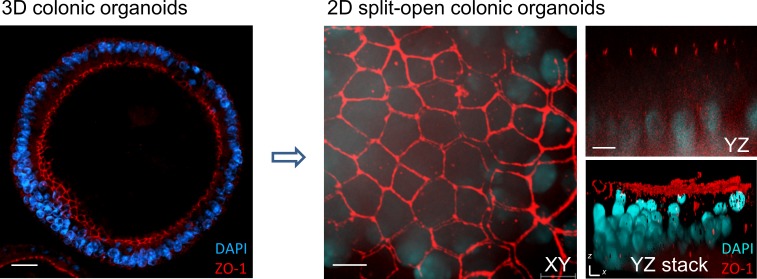
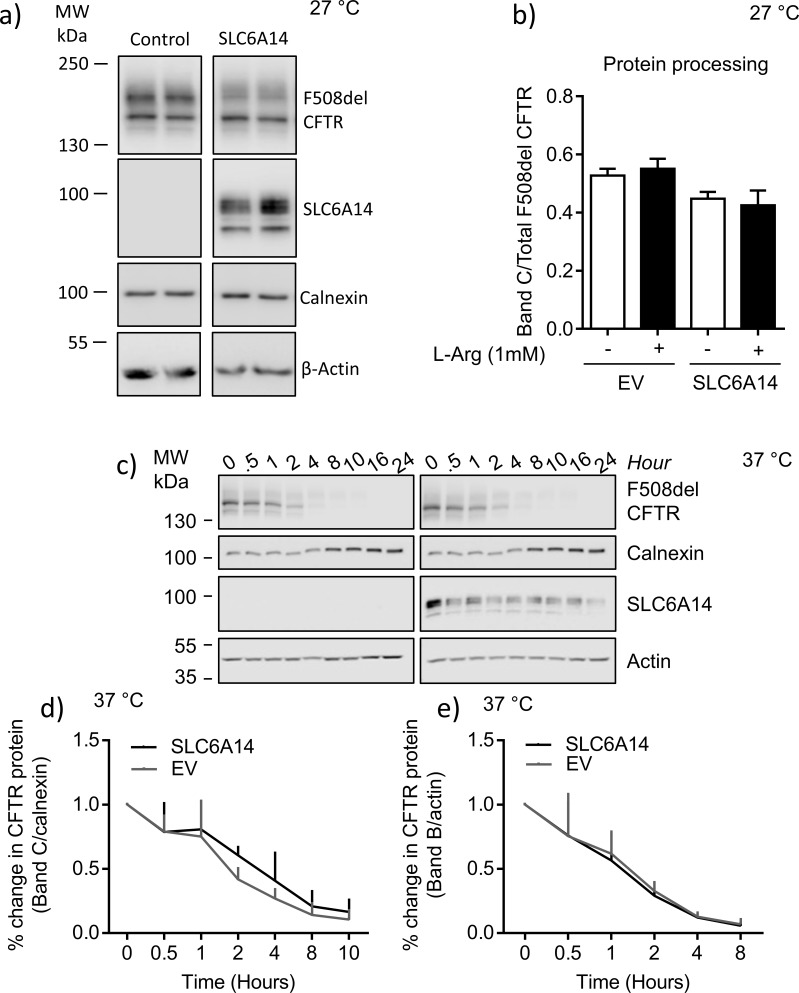
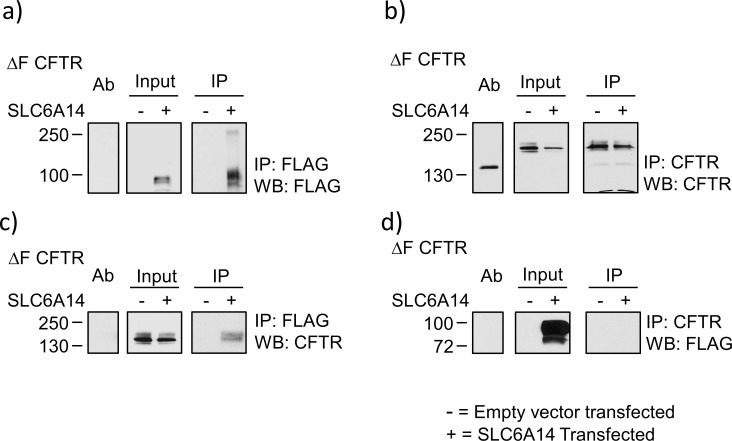
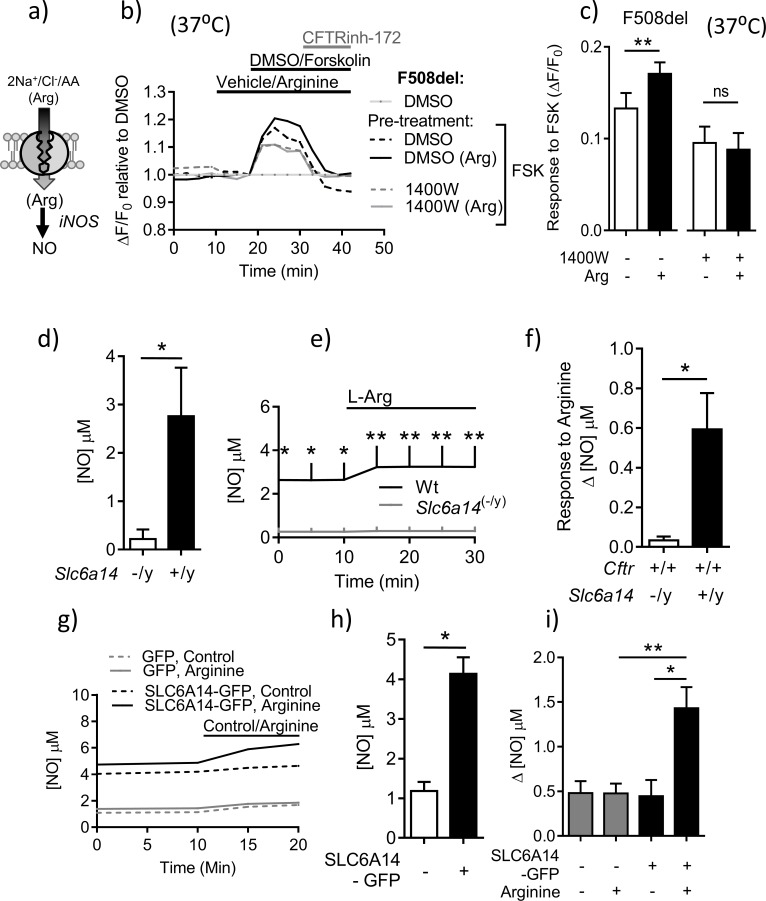
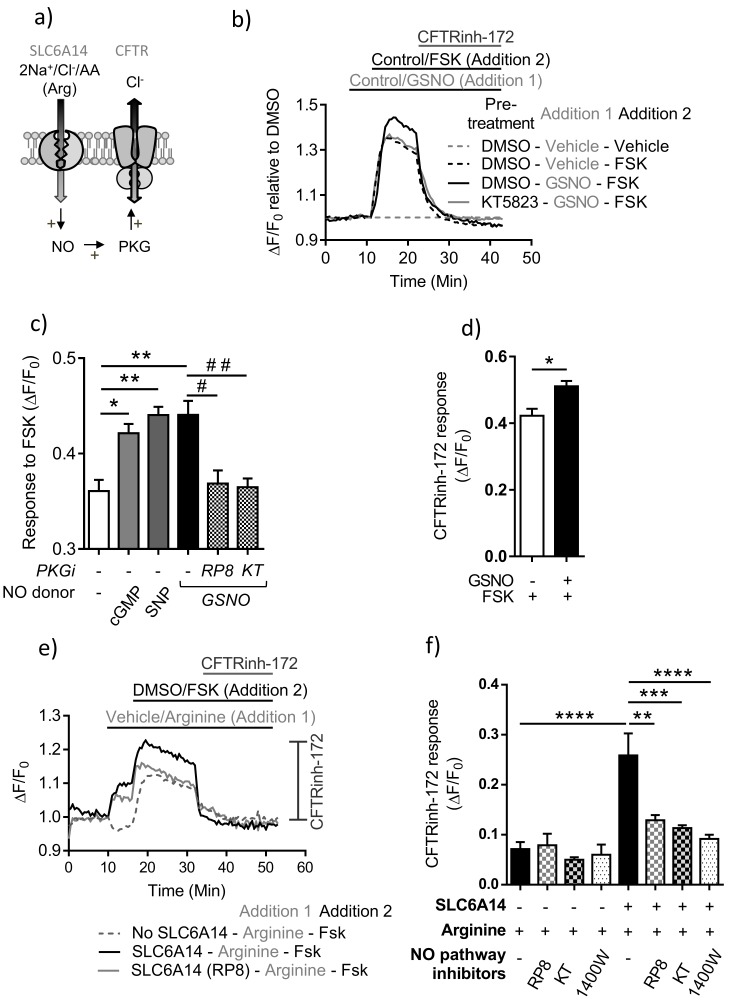
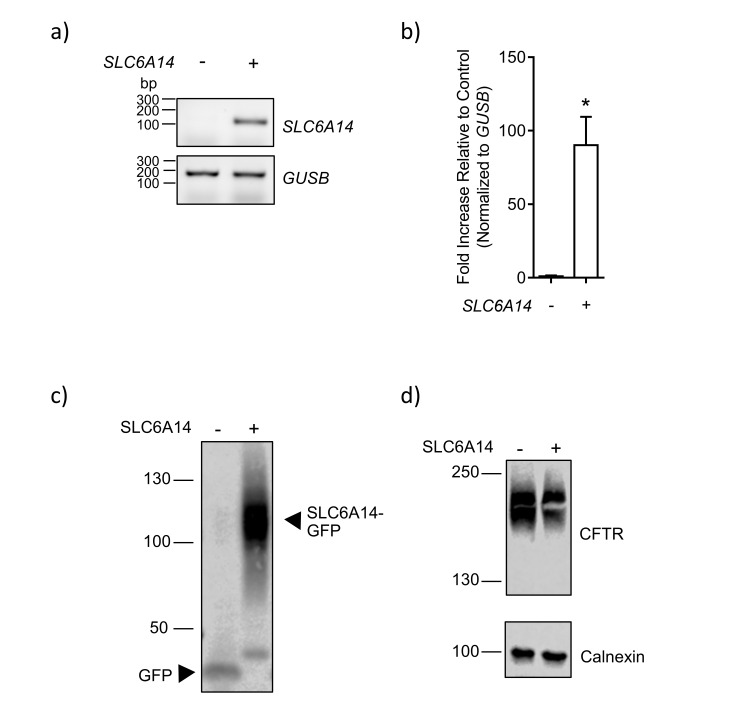
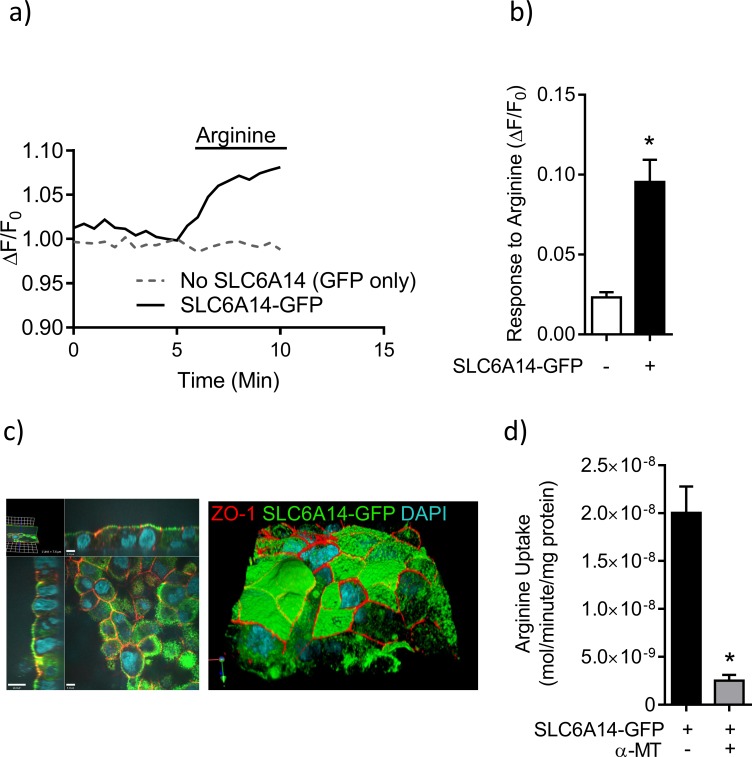
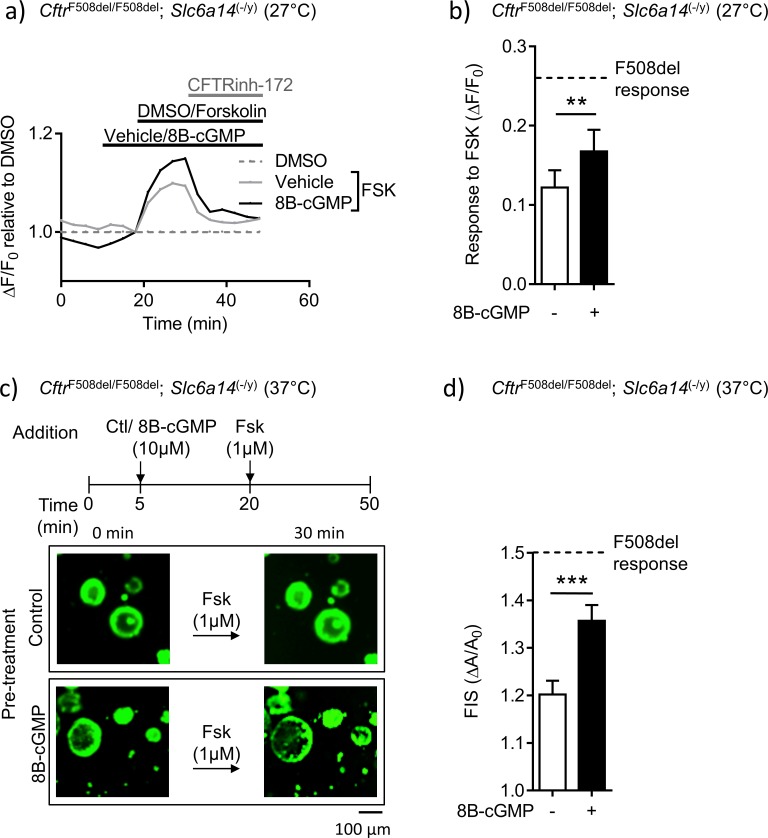
The severity of intestinal disease associated with Cystic Fibrosis (CF) is variable in the patient population and this variability is partially conferred by the influence of modifier genes. Genome-wide association studies have identified SLC6A14, an electrogenic amino acid transporter, as a genetic modifier of CF-associated meconium ileus. The purpose of the current work was to determine the biological role of Slc6a14, by disrupting its expression in CF mice bearing the major mutation, F508del. We found that disruption of Slc6a14 worsened the intestinal fluid secretion defect, characteristic of these mice. In vitro studies of mouse intestinal organoids revealed that exacerbation of the primary defect was associated with reduced arginine uptake across the apical membrane, with aberrant nitric oxide and cyclic GMP-mediated regulation of the major CF-causing mutant protein. Together, these studies highlight the role of this apical transporter in modifying cellular nitric oxide levels, residual function of the major CF mutant and potentially, its promise as a therapeutic target.

Keywords: F508del-CFTR; amino acid transporter; colonic cell line; human biology; medicine; mouse; nitric oxide signaling; organoids.


Conflict of interest statement

SA, SX, YW, MD, RK, CL, FL, KD, JR, CB No competing interests declared

Figures

Figure 1.
Figure 1.. Expression of SLC6A14 in various CF affected tissues.
(a) mRNA Expression of Slc6a14 normalized to housekeeping gene Gusb was measured in various CF-affected tissues, using qRT-PCR. Bars represent mean ± SEM. One-way ANOVA with Tukey’s multiple comparison test was performed (*p<0.0001, n ≥ 3 biological replicates). (b) Colonic organoids derived from a wild-type C57BL/6N mice were transduced with human SLC6A14-GFP, fixed and immunostained for GFP, murine E-Cadherin and DAPI (i) Immunofluorescence of non-transduced colonic organoids. (ii) Fluorescence imaging showing apical localization of SLC6A14-GFP. (c) For genotype confirmation, DNA was collected from Slc6a14(+/y) and Slc6a14(-/y) mice tails and PCR was performed (35 cycles). Two different sets of primers were used (set 1, 2). Set one amplified the wild-type allele only (225 bp), and primer set two amplified the Slc6a14 knock-out allele only (386 bp). Hence, two bands are observed in heterozygous mice. (d) Slc6a14 mRNA expression in the colon of Wt and Slc6a14-KO mice was measured by PCR of the cDNA (30 cycles). Tbp was used as the housekeeping gene. (e) Ex vivo closed loop assay was performed after injecting buffer containing 3H-arginine supplemented with 100 µM or 20 mM cold arginine. After 15 mins, the epithelium was lysed and intracellular 3H-arginine levels measured. Bar graph represents mean ± SD of arginine uptake by the epithelium (counts per minute, CPM), normalized to total protein in the lysate (CPM/[protein]). Unpaired t-test was performed (**p=0.0082; n = 3 biological replicates). (f) Bar graphs represent arginine bioavailability in freshly lysed colonic tissue (mean ± SD). Arginine bioavailability is defined as the ratio of arginine to citrulline plus ornithine. Unpaired t-test was performed (*p=0.047; n = 3 biological replicates).
Figure 1—figure supplement 1.
Figure 1—figure supplement 1.. Deletion of Slc6a14 in CF mice does not cause a change in serum amino-acid levels.
Serum was collected from Wt, CF (CftrF508del/F508del), Slc6a14(-/y) and double mutant (CftrF508del/F508del; Slc6a14(-/y)) mice on FVB background. Stacked bar graph represents levels of essential amino acids (a) or non-essential amino acids (b) in the serum (mean ± SD). Two-way ANOVA with Tukey’s multiple comparison test was performed. No relevant significant changes were observed (n ≥ 4 for each genotype).
Figure 2.
Figure 2.. Disruption of Slc6a14 in F508del CF mice leads to decrease in weight gain post weaning.
(a) Dorsal view of CF (CftrF508del/F508del) mice and double mutant (CftrF508del/F508del; Slc6a14(-/y)) mice. Both were day 30 male mice. (b) Bar graph represents weights of Wt, CftrF508del/F508del, Slc6a14(-/y) and double mutant (CftrF508del/F508del; Slc6a14(-/y)) mice at day 34 (mean ± SEM). Unpaired t-test was performed (#p=0.005, *p=0.04; n ≥ 4 mice for each genotype). (c) Bar graph represents Body Mass Index (BMI) of mice at day 34 (mean ± SEM). Unpaired t-test was performed (*p=0.03; n > 5 mice for each genotype). (d) The graph represents Kaplan-Meier survival curves for the four genotypes of mice. Double mutant mice were susceptible to death post-weaning. There was no statistical difference in the survival, between Wt and F508del-Cftr mice, However, the survival of double mutant mice was significantly lower than Slc6a14(-/y) mice (Log Rank test, p=0.0036; Wt mice n = 14, Slc6a14(-/y)n = 15, CftrF508del/F508deln = 10, double mutant - CftrF508del/F508del; Slc6a14(-/y)n = 11).
Figure 2—figure supplement 1.
Figure 2—figure supplement 1.. Line graph represents weight gain over time in Wt, CftrF508del/F508del, Slc6a14(-/y) and double mutant (CftrF508del/F508del; Slc6a14(-/y)) mice.
Figure 2—figure supplement 2.
Figure 2—figure supplement 2.. Deletion of Slc6a14 in CF mice does not cause a change in serum IGF-1 levels.
(a) Standard curve for ELISA-based detection of IGF-1 levels. Purified IGF-1 was used generate the standard curve. Sigmoidal 4PL curve fit was used as recommended by the manufacturer. Goodness of fit as measured by R2 was 0.9999. (b) ELISA-based IGF-1 detection assay was performed on serum samples obtained from 56 day old mice (i) or 30 day old mice (ii), and actual concentrations interpolated from the standard curve. Bar graphs represent mean ± SD. Serum was collected from Wt, CF (CftrF508del/F508del), Slc6a14(-/y) and double mutant (CftrF508del/F508del; Slc6a14(-/y)) mice on FVB background. One-way ANOVA with Tukey’s multiple comparison test was performed (*p=0.048, #p=0.015, **p=0.0422, n ≥ 6 for each genotype for day 56 mice, n ≥ 3 for day 30 CF and double mutant mice).
Figure 3.
Figure 3.. Slc6a14 disruption results in an increase in smooth muscle thickness in the ileum and colon.
(a) Representative distal ileal sections stained with Alcian blue, for Wt, CftrF508del/F508del and double mutant (CftrF508del/F508del; Slc6a14(-/y)) mice. (b) Representative colonic sections stained with Alcian blue, for Wt, CftrF508del/F508del and double mutant (CftrF508del/F508del; Slc6a14(-/y)) mice. (c) Bar graph represents ileal smooth muscle area relative to total section area for each genotype (mean ± SD). One-Way ANOVA with Tukey’s multiple comparison test was performed (**p=0.007, ****p<0.0001, n ≥ 4 mice for each genotype). (d) Bar graph represents colon smooth muscle area relative to total section area for each genotype (mean ± SD). One-Way ANOVA with Tukey’s multiple comparison test was performed (*p=0.042, n ≥ 4 mice for each genotype).
Figure 3—figure supplement 1.
Figure 3—figure supplement 1.. Representative intestinal section with annotations (green line) made in 3DHISTECH software are shown. These annotations were used to calculate relevant areas of tissue layers.
Figure 4.
Figure 4.. Loss of Slc6a14 worsens defective F508del Cftr-mediated secretion in murine colonic epithelium.
(a) In vivo closed loop assay performed on Wt mice. Each loop was injected with CFTR cAMP agonist forskolin (FSK 10 µM) and IBMX (100 µM), or DMSO vehicle. Weight relative to length is used as a measure of fluid secretion. (b) Bar graph represents fluid secretion in loops stimulated with CFTR cAMP agonist FSK and IBMX, relative to DMSO alone (mean ± SD). Fluid secretion is represented as weight/length for each loop. Wt mice showed significantly higher fluid secretion than CftrF508del/F508del (unpaired t-test, # p=0.0036, n = 3 for each genotype). Double mutant (CftrF508del/F508del; Slc6a14(-/y)) mice showed significantly lower fluid secretion than CF CftrF508del/F508del mice (unpaired t-test, *p=0.0428, **p=0.0036, n ≥ 3 biological replicates for each genotype). (c) Representative fluorescence images of murine colonic organoids derived from CftrF508del/F508del and double mutant (CftrF508del/F508del; Slc6a14(-/y)) mice, and their responses to 30 min of stimulation with FSK (1 µM). (d) Bar graph represents FSK- induced swelling (FIS) after 30 min of stimulation, in both CftrF508del/F508del and double mutant (CftrF508del/F508del; Slc6a14(-/y)) murine organoids (mean ± SD). FIS is measured as change in area of the organoid after 30 min of FIS (ΔA) relative to baseline before stimulation (A0). Unpaired t-test was performed (****p<0.0001, n > 4 biological replicates for each genotype).
Figure 4—figure supplement 1.
Figure 4—figure supplement 1.. Disruption of Slc6a14 decreases the fluid secretory capacity of the colonic epithelium by modulating apical constituents of the epithelium.
(a) Bar graph represents fluid secretory capacity of in vivo colonic closed loops stimulated with CFTR cAMP agonist FSK (10 µM) and IBMX (100 µM), relative to DMSO alone (mean ± SD). Experiments were performed on Wt and Slc6a14(-/y) mice on C57BL/6N background. Fluid secretion is represented as weight/length (w/l) for each loop stimulated with FSK and IBMX, normalized to w/l for vehicle DMSO. Paired t-test was performed (*p=0.0125, n = 4 mice for each genotype). (b) Bar graph depicts Cftr mRNA expression relative to housekeeping gene Tbp, from freshly lysed colon of Wt and Slc6a14(-/y) mice on C57BL/6N background (mean ± SD). Unpaired t-test was performed (ns = not significant, n = 4 for each genotype). These data show that the decrease in secretion does not reflect a decrease in Cftr mRNA expression (c) Bar graph represents Cftr mRNA expression relative to housekeeping gene Tbp, from freshly lysed colon of Wt, CF (CftrF508del/F508del) and double mutant (CftrF508del/F508del; Slc6a14(-/y)) mice on FVB background (mean ± SD). One-way ANOVA with Tukey’s multiple comparison test was performed (**p=0.0057, ns = not significant, n ≥ 4 for each genotype).
Figure 4—figure supplement 2.
Figure 4—figure supplement 2.. Analysis of FSK-induced swelling of murine colonic organoids.
In a 96-well plate, at least 100 organoids/well were analyzed. Whole well stitched fluorescence images (four fields/well) were exported as TIFF files and analyzed using CellProfiler v2.01 (Carpenter Lab), as described in the methods. The figure shows a representative fluorescence image of organoids for which a mask was generated for each fluorescent object (organoid). Different colored masks represent individual organoids.
Figure 5.
Figure 5.. Slc6a14 expression mediates arginine-dependent enhancement of mutant F508del CFTR channel function in murine intestinal tissues.
(a) Hypothetical model depicting that SLC6A14 could affect CFTR channel function. (b) Diagram depicts the concept of gaining apical access to the epithelium by splitting open a 3D organoid, thereby resulting in patches of split-open 2D lawns, which can then be studied using fluorescence-based assays. (c) Split-open colonic organoids from CF (CftrF508del/F508del) and double mutant (CftrF508del/F508del; Slc6a14(-/y)) mice were studied for CFTR channel function using the previously described membrane potential-based ACC assay. Line graph represents change in fluorescence relative to baseline (ΔF/F0) as a measure of F508del-CFTR function after low temperature rescue (27°C) of the mutant protein. After capturing baseline fluorescence reads, cells were acutely treated with L-arginine (1 mM) to activate SLC6A14 or vehicle, followed by CFTR activation with cAMP agonist forskolin (FSK 10 µM) or vehicle DMSO. Thereafter, CFTRinh-172 (10 µM) was added to all the wells. (d) Bar graph represents maximum change in ACC fluorescence from baseline (ΔF/F0) after acute addition of FSK, following low temperature (27°C) rescue of F508del-CFTR protein in split-open murine organoids (mean ± SEM). Paired t-test was performed (*p=0.045, ns = not significant, n = 4 mice for each genotype). (e) ACC assay performed on split-open colonic organoids from CF (CftrF508del/F508del) and double mutant (CftrF508del/F508del; Slc6a14(-/y)) mice for CFTR channel function at physiological temperature (37°C). As above, SLC6A14 was activated with L-arginine (1 mM) or vehicle followed by CFTR stimulation by FSK (10 µM) or vehicle DMSO. All wells received CFTRinh-172 (10 µM) after activation to confirm the role for CFTR. (f) Bar graph represents maximum change in ACC fluorescence from baseline (ΔF/F0) after acute addition of FSK, at physiological temperature (37°C) in F508del-CFTR split-open murine organoids (mean ± SEM). Paired t-test was performed (****p<0.0001, ns = not significant, n = 3 mice for each genotype).
Figure 5—figure supplement 1.
Figure 5—figure supplement 1.. Slc6a14 is a major arginine transporter in the colonic epithelium.
Ex vivo intestinal closed loop assay was performed in mice on FVB background across four genotypes: Wt, CF (CftrF508del/F508del), Slc6a14(-/y) and double mutant (CftrF508del/F508del; Slc6a14(-/y)). Each loop for each mouse was injected with buffer containing 3[H]-arginine supplemented with 100 µM or 20 mM cold arginine. Bar graph represents arginine uptake by the epithelium (counts per minute – CPM), normalized to total protein in the lysate (CPM/[protein]), mean ± SD. Two-way ANOVA with Tukey’s multiple comparison test was performed for colon and ileum (**p=0.0013, ***p=0.0007, ****p<0.0001, ns = not significant, n ≥ 4 for each genotype of mouse).
Figure 5—figure supplement 2.
Figure 5—figure supplement 2.. Split-open organoid model.
Confocal immunofluorescence images of apical epithelial marker ZO-1 (red) and nuclei (blue) in murine 3D colonic organoid (left panel) and 2D split-open colonic organoids (right panel, shown as XY, YZ and YZ stacked images). Scale bar = 5 µm.
Figure 5—figure supplement 3.
Figure 5—figure supplement 3.. SLC6A14 does not enhance processing or cell surface stability of F508del-CFTR in BHK over-expression system.
(a) BHK cells over-expressing mutant F508del-CFTR were transiently transfected with SLC6A14-FLAG or Empty Vector (EV). Cells were lysed and subjected to western blotting. Representative western blots probed with anti-CFTR, anti-FLAG, anti-calnexin, or anti-actin antibodies are shown. (b) Bar graph represents mature CFTR expression calculated as a ratio of CFTR Band C over total F508del-CFTR expression (mean ± SEM). Paired t-test was performed (for EV control transfected p=0.2470, for SLC6A14 transfected p=0.2874, ns = not significant, n = 4 for each group). (c) Cycloheximide Brefeldin A chase was performed on BHK cells over-expressing F508del-CFTR and transiently transfected with EV control or SLC6A14-FLAG. Cells were incubated at 27°C for 24 hr to rescue mutant F508del-CFTR, and then moved to 37°C at the start of the chase experiment. Representative western blots probed for loading control calnexin for CFTR and actin for SL6A14, are shown. (d) Line graph represents decay over time of mature CFTR (Band C) normalized to loading control calnexin in BHK cells transiently transfected with either EV control or SLC6A14. Change in Band C/Calnexin protein expression was normalized to the first time point (t = 0). Two-way ANOVA with Sidak’s multiple comparison test was performed (p>0.05 for all time points, n = 3 biological replicates). (e) Line graph represents decay over time of immature CFTR (Band B) normalized to loading control calnexin in BHK cells transiently transfected with either EV control or SLC6A14. Change in Band C/Calnexin protein expression was normalized to the first time point (t = 0). Two-way ANOVA with Sidak’s multiple comparison test was performed (p>0.05 for all time points, n = 3 biological replicates).
Figure 5—figure supplement 4.
Figure 5—figure supplement 4.. SLC6A14 interaction with mutant F508del-CFTR.
BHK cells over-expressing mutant F508del-CFTR and either SLC6A14-FLAG (+) or EV control (-) were used for co-immunoprecipitation. IP = Immunoprecipitation, WB = Western Blot. (a) SLC6A14 was immunoprecipitated with FLAG antibody. Representative western blot of the input lysate before the IP and after the IP are shown. (b) CFTR was immunoprecipitated using the anti-CFTR 596 antibody. Representative western blot of the input lysate before the IP and after the IP are shown. (c) SLC6A14 was immunoprecipitated with FLAG antibody. Representative western blot of the input lysate before the co-IP and after the co-IP are shown. (d) CFTR was immunoprecipitated using the anti-CFTR 596 antibody. Representative western blot of the input lysate before the IP and after the IP are shown.
Figure 6.
Figure 6.. SLC6A14 expression enhances residual cAMP-dependent F508del channel function in murine intestinal tissues via arginine-mediated NO signaling.
(a) Hypothetical model depicting the role of SLC6A14 in transporting arginine across the apical surface thereby increasing intracellular nitric oxide (NO) levels. (b) Split-open colonic organoids from CF (CftrF508del/F508del) mice were studied using the ACC assay at physiological temperature (37°C). Line graph represents change in fluorescence relative to baseline (ΔF/F0) as a measure of F508del-CFTR, after pre-incubation with vehicle or inducible Nitric-oxide Synthase (iNOS) inhibitor 1400W (100 µM) for 30 mins. (c) Bar graph represents maximum change in ACC fluorescence from baseline (ΔF/F0) after acute addition of FSK, at physiological temperature (37°C) in F508del-CFTR split-open murine organoids (mean ± SEM), after 30 mins pre-incubation with vehicle or iNOS inhibitor 1400W (100 µM). (**p=0.006, ns = not significant, n = 4 biological replicates for each genotype). (d) Epithelial basal NO levels measured using DAF-FM fluorophore, by splitting open colonic organoids derived from Wt and Slc6a14(-/y) mice. Bar graph represents mean ± SEM. Unpaired t-test was performed (*p=0.022, n = 5 biological replicates). (e) Line graph represents change in NO levels upon acute addition of L-arginine (1 mM), in split-open colonic organoids derived from C57Bl/6 Wt and Slc6a14(-/y) mice. Two-way ANOVA with Sidak’s multiple comparison test was performed (p<0.0001, n ≥ 4 for each genotype, for t = 0, 5, 10 mins *p<0.05, for t = 15, 20, 25 mins **p=0.006) (f) Bar graph represents maximum change in intracellular NO levels upon acute addition of L-arginine (1 mM), in split-open colonic organoids from Wt and Slc6a14(-/y) mice (mean ± SD). Unpaired t-test was performed (*p=0.009, n ≥ 4 biological replicates for each genotype). (g) Line graph represents basal [NO] levels and change in [NO] after addition of SLC6A14 agonist L-arginine (1 mM) or control (buffer alone), in split-open murine FVB CftrF508del/F508del colonic organoids transduced with human SLC6A14-GFP or control GFP. (h) Bar graph represents basal [NO] levels in split-open murine organoids transduced with SLC6A14-GFP or just GFP. Mean ± SEM is plotted. Unpaired t-test was performed (*p<0.0001, n = 3 biological replicates). (i) Bar graph represents change in [NO] levels (Δ[NO]) after addition of SLC6A14 agonist L-arginine (1 mM) or control (buffer alone), in split open FVB CftrF508del/F508del colonic organoids transduced with human SLC6A14-GFP or control GFP. Mean ± SEM is plotted. One-way ANOVA with Tukey’s multiple comparison test was performed (*p=0.02, **p=0.006, n ≥ 3 biological replicates for each condition).
Figure 6—figure supplement 1.
Figure 6—figure supplement 1.. iNOS expression in primary murine colonic tissue.
Fresh murine colonic tissue was homogenized and RNA was extracted. iNOS gene and housekeeping gene Tbp mRNA expression was measured using PCR (35 cycles), in presence or absence of reverse transcriptase (RT) enzyme. Expected product size for iNOS cDNA amplification is 115 bp and for Tbp cDNA is 131 bp.
Figure 6—figure supplement 2.
Figure 6—figure supplement 2.. NO-mediated signaling potentiates mutant F508del CFTR function in intestinal epithelial cells.
(a) Split-open ileal organoids from F508del-CFTR (CftrF508del/F508del; Slc6a14(+/y)) mice were used to perform ACC assay, after low temperature (27°C) rescue of the mutant F508del CFTR protein. Line graph represents change in fluorescence from baseline (ΔF/F0) relative to DMSO vehicle addition. After capturing baseline reads, cells were acutely treated with GSNO (10 µM) or vehicle, followed by addition of CFTR cAMP agonist FSK (10 µM) or DMSO. All wells received CFTRinh-172 (10 µM) at the end. (b) Each point on the scatter plot represents maximum change in ACC fluorescence from baseline (ΔF/F0) after acute addition of FSK. Paired t-test was performed (*p=0.005, n = 3 biological replicates defined as different passages of murine ileal organoids, and n ≥ 2 technical replicates for each biological replicate).
Figure 6—figure supplement 3.
Figure 6—figure supplement 3.. Standard curve for Nitric-Oxide (NO) measurement.
(a) Split-open organoids from Wt mice were used to measure NO levels with DAF-FM fluorescence. Increasing levels of NO in the epithelium were achieved by addition of known NO donor (Proli NONOate). Linear regression was used to fit the data. Goodness of the fit was R2 = 0.84 (n = 3 biological replicates). (b) Split-open organoids from Wt C57Bl/6 mice, and transduced with GFP, were used to measure NO levels with DAF-FM fluorescence, as described in the methods. A standard curve was generated by increasing intracellular NO levels using a NO donor (Proli NONOate). Linear regression was used to fit the data. Goodness of the fit was R2 = 0.95 (n = 3 biological replicates).
Figure 7.
Figure 7.. PKA-dependent channel activity of CFTR is enhanced by NO dependent activation of PKG in colonic epithelium.
(a) Model depicting the hypothesis that SLC6A14-mediated arginine uptake across the epithelium would lead to an increase in intracellular NO levels, which would then potentiate CFTR channel function via PKG activation. (b) Line graph represents CFTR function measured using the FLIPR® membrane potential assay in Caco-2 colonic intestinal epithelial cells. Cells were pre-treated with PKG inhibitor KT5823 (1 µM) or DMSO control. After reading baseline intracellular NO levels were increased using NO donor GSNO (10 µM) or vehicle control, followed by cAMP activation of CFTR using FSK (10 µM) or DMSO vehicle. (c) Bar graph represents response to FSK from baseline (ΔF/F0), in Caco-2 cells pre-treated with PKG inhibitors Rp-8-pCPT-cGMPS (RP8), KT5823 or vehicle DMSO, followed by addition of NO donor GSNO as shown in Figure 7b. The effect on FSK response by another NO donor SNP (50 µM) and direct increase of intracellular cGMP (10 µM) was also studied in this system. Mean ± SEM are plotted. One-way ANOVA with Tukey’s multiple comparison test was performed (*p=0.006, **p=0.0001, # p=0.004, # # p=0.002, n = 3 biological replicates). (d) Bar graph represents CFTRinh-172 (10 µM) response, elicited at the end of the experiment after full CFTR activation. Mean ± SEM are plotted. Unpaired t-test was performed (*p=0.007, n = 3 biological replicates). (e) Line graph represents CFTR function measured using the FLIPR® membrane potential assay in Caco-2 epithelial cells transduced with SLC6A14-GFP or control GFP alone. Cells were pre-treated with PKG inhibitors Rp-8-pCPT-cGMPS (10 µM), KT5823 (1 µM), or iNOS inhibitor 1400W (50 µM) or DMSO control. After reading for baseline, SLC6A14 was stimulated using L-arginine (1 mM) or vehicle control, followed by cAMP activation of CFTR using FSK (10 µM) or DMSO vehicle. This was followed by addition of CFTRinh-172 (10 µM). (f) Bar graph represents CFTRinh-172 (10 µM) response, elicited at the end of the experiment after full CFTR activation, in Caco-2 cells over-expressing SLC6A14-GFP or control GFP. Mean ±SEM are plotted. One-way ANOVA with Tukey’s multiple comparison test was performed (****p<0.0001, **p=0.003, ***p=0.0001, n = 3 biological replicates).
Figure 7—figure supplement 1.
Figure 7—figure supplement 1.. SLC6A14-GFP over-expression in Caco2 colonic epithelial cells.
(a) SLC6A14 expression in Caco2 cells transduced with SLC6A14-GFP or GFP alone, was measured. SLC6A14 mRNA expression normalized to housekeeping gene GUSB was measured using PCR for 40 cycles. Amplification of SLC6A14 cDNA segment was observed (175 bp) in Caco2 cells over-expressing SLC6A14-GFP, but not in the control over-expressing GFP alone. Housekeeping gene GUSB (197 bp) was present in both the samples. (b) Bars represent relative mRNA expression of SLC6A14 normalized to housekeeping gene GUSB (mean ± SEM, unpaired t-test, *p=0.001, n = 3 technical replicates). (c) Caco2 cells overexpressing SLC6A14-GFP or GFP alone were lysed and subjected to western blotting. The blot was probed with anti-GFP antibody. (d) Caco2 cells overexpressing SLC6A14-GFP or GFP alone were lysed and subjected to western blotting. The blot was probed with anti-CFTR (596) and anti-calnexin antibodies.
Figure 7—figure supplement 2.
Figure 7—figure supplement 2.. SLC6A14-GFP functions as an electrogenic amino-acid (arginine) transporter.
(a) Caco-2 cells transduced with SLC6A14-GFP or control (GFP only) were assessed for functional expression of SLC6A14-GFP as an electrogenic amino acid transporter. Line graph represents FLIPR® based membrane potential change in these cells at baseline and upon acute addition of L-arginine (1 mM). (b) Bar graph represents response to L-arginine measured as maximum change in fluorescence (ΔF) relative to baseline (F0), in Caco-2 cells over-expressing SLC6A14-GFP or control (GFP only). (c) CFBE cells transduced with SLC6A14-GFP localizes to the apical surface, to the same plane as ZO-1 (red). (d) 3H-arginine uptake was mediated by CF bronchial epithelial cells (CFBE’s) transduced with SLC6A14-GFP. Bar graph represents mean ± SD of arginine uptake by the epithelium (mol/minute/mg ofprotein). Alpha-methyl-tryptophan (α-MT 1 mM), an inhibitor of SLC6A14, significantly inhibited uptake. Unpaired t-test (*p<0.0001, n = 3 biological replicates defined as different cell passages).
Figure 8.
Figure 8.. Mutant F508del-CFTR function in double mutant murine organoids can be enhanced by directly enhancing PKG-mediated phosphorylation.
(a) Split-open organoids from double mutant (CftrF508del/F508del; Slc6a14(-/y)) mice were used to perform ACC assay, after low temperature (27°C) rescue of the mutant F508del CFTR protein. Line graph represents change in fluorescence from baseline (ΔF/F0) relative to DMSO vehicle addition. After capturing baseline read, cells were acutely treated with 8Br-cGMP (10 µM) or vehicle, followed by addition of CFTR cAMP agonist FSK (10 µM). All wells received CFTRinh-172 (10 µM) at the end. (b) Bar graph represents maximum change in ACC fluorescence from baseline (ΔF/F0) after acute addition of FSK, following low temperature (27°C) rescue of F508del-CFTR protein in double mutant spilt-open organoids (mean ± SEM). Stippled line represents ACC response to FSK in temperature rescued (27°C) CF (CftrF508del/F508del) split-open murine organoids, in absence of 8Br-cGMP. Paired t-test was performed (**p=0.0029, n = 5 mice for each genotype). (c) Organoids from double mutant (CftrF508del/F508del; Slc6a14(-/y)) mice were stained with Calcein AM and after capturing baseline images, organoids were acutely treated with 8Bromo-cGMP (8Br-cGMP 10 µM) for 15 mins, followed by FSK (1 µM) for 30 mins. Representative images of forskolin-induced swelling (FIS) are shown for organoids pre-treated with 8Br-cGMP or vehicle (control). Experiments were performed at physiological temperature of 37°C. (d) Bar graph represents FIS response in double mutant (CftrF508del/F508del; Slc6a14(-/y)) murine organoids, as measured by change in area from baseline after 30 mins of FSK addition (ΔA/A0). Stippled line represents FIS response in CF (CftrF508del/F508del) organoids in absence of 8Br-cGMP. Graph represents mean ± SEM. Experiments were performed at physiological temperature of 37°C. Unpaired t-test was performed (***p=0.0005, n = 4 mice).

References

    1. Ahmadi S, Bozoky Z, Di Paola M, Xia S, Li C, Wong AP, Wellhauser L, Molinski SV, Ip W, Ouyang H, Avolio J, Forman-Kay JD, Ratjen F, Hirota JA, Rommens J, Rossant J, Gonska T, Moraes TJ, Bear CE. Phenotypic profiling of CFTR modulators in patient-derived respiratory epithelia. npj Genomic Medicine. 2017;2:12. doi: 10.1038/s41525-017-0015-6. - DOI - PMC - PubMed
    1. Anderson CM, Ganapathy V, Thwaites DT. Human solute carrier SLC6A14 is the beta-alanine carrier. The Journal of Physiology. 2008;586:4061–4067. doi: 10.1113/jphysiol.2008.154500. - DOI - PMC - PubMed
    1. Babu E, Bhutia YD, Ramachandran S, Gnanaprakasam JP, Prasad PD, Thangaraju M, Ganapathy V. Deletion of the amino acid transporter Slc6a14 suppresses tumour growth in spontaneous mouse models of breast Cancer. Biochemical Journal. 2015;469:17–23. doi: 10.1042/BJ20150437. - DOI - PubMed
    1. Bazett M, Honeyman L, Stefanov AN, Pope CE, Hoffman LR, Haston CK. Cystic fibrosis mouse model-dependent intestinal structure and gut microbiome. Mammalian Genome. 2015;26:222–234. doi: 10.1007/s00335-015-9560-4. - DOI - PMC - PubMed
    1. Bear CE, Li C, Kartner N, Bridges RJ, Jensen TJ, Ramjeesingh M, Riordan JR. Purification and functional reconstitution of the cystic fibrosis transmembrane conductance regulator (CFTR) Cell. 1992;68:809–818. doi: 10.1016/0092-8674(92)90155-6. - DOI - PubMed

Publication types

MeSH terms

Substances