. 2018 Dec 15;526(18):2955-2972.
doi: 10.1002/cne.24494. Epub 2018 Nov 14.

Long-term histological changes in the macaque primary visual cortex and the lateral geniculate nucleus after monocular deprivation produced by early restricted retinal lesions and diffuser induced form deprivation

Affiliations

Long-term histological changes in the macaque primary visual cortex and the lateral geniculate nucleus after monocular deprivation produced by early restricted retinal lesions and diffuser induced form deprivation

Toru Takahata et al. J Comp Neurol. .

Abstract

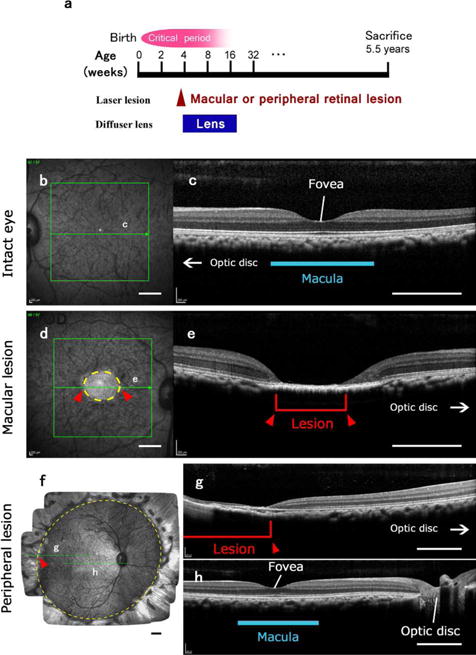
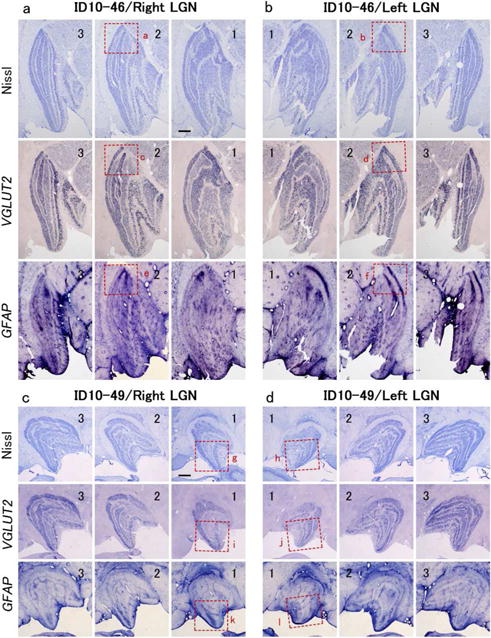
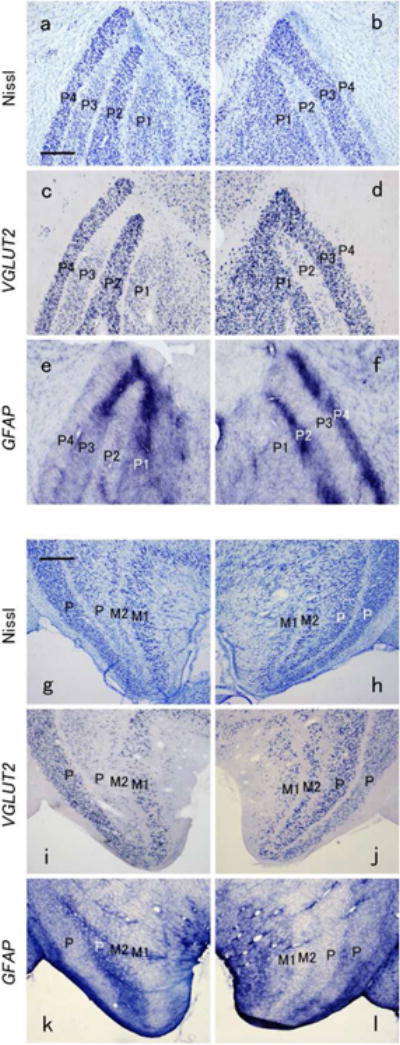
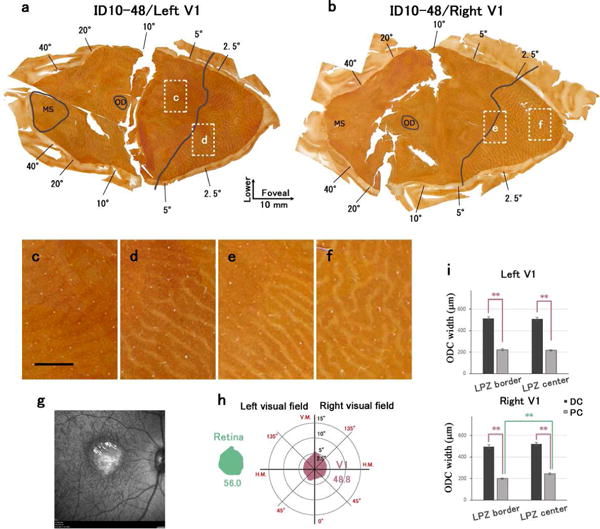
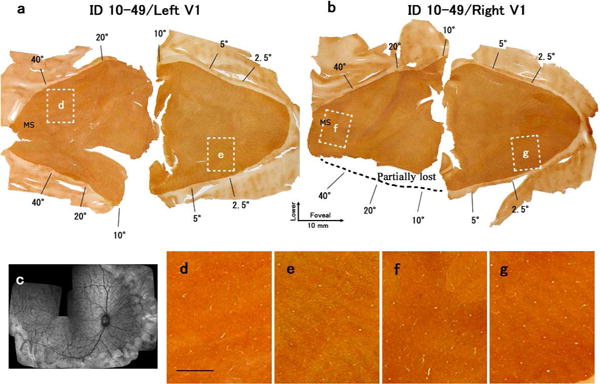
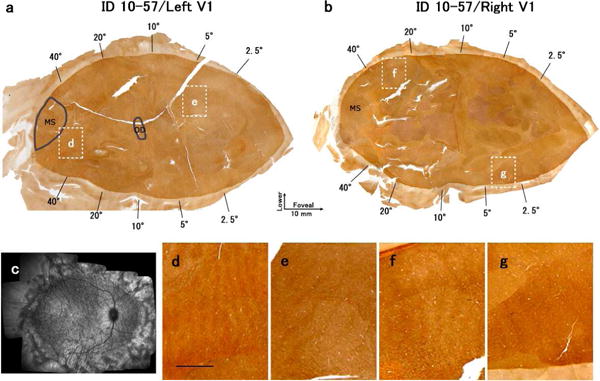
Ocular dominance (OD) plasticity has been extensively studied in various mammalian species. While robust OD shifts are typically observed after monocular eyelid suture, relatively poor OD plasticity is observed for early eye removal or after tetrodotoxin (TTX) injections in mice. Hence, abnormal binocular signal interactions in the visual cortex may play a critical role in eliciting OD plasticity. Here, we examined the histochemical changes in the lateral geniculate nucleus (LGN) and the striate cortex (V1) in macaque monkeys that experienced two different monocular sensory deprivations in the same eye beginning at 3 weeks of age: restricted laser lesions in macular or peripheral retina and form deprivation induced by wearing a diffuser lens during the critical period. The monkeys were subsequently reared for 5 years under a normal visual environment. In the LGN, atrophy of neurons and a dramatic increase of GFAP expression were observed in the lesion projection zones (LPZs). In V1, although no obvious shift of the LPZ border was found, the ocular dominance columns (ODCs) for the lesioned eye shrunk and those for the intact eye expanded over the entirety of V1. This ODC size change was larger in the area outside the LPZ and in the region inside the LPZ near the border compared to that in the LPZ center. These developmental changes may reflect abnormal binocular interactions in V1 during early infancy. Our observations provide insights into the nature of degenerative and plastic changes in the LGN and V1 following early chronic monocular sensory deprivations.

Keywords: RRID: AB_2187552; RRID: AB_2313581; cytochrome oxidase histochemistry; monocular form deprivation; monocular inactivation; ocular dominance columns; visual cortex development.


Conflict of interest statement

Conflict of Interest

Authors declare no conflict of interest about this publication.

Figures

Figure 1
Figure 1
Visual deprivation produced by laser lesions of the retina of one eye and a period of visual deprivation for that eye with a diffuser lens. The other eye remained intact. (a) The time of the laser lesions and the period of deprivation with the diffuser lens. Although the diffuser lens was removed when the monkeys were 4-5 months old, the eye remained myopic or hyperopic. The deprivations were within the critical period of development where the ocular columns of visual cortex can be altered, but the full extent of this period is not well defined. After 5 years, the monkeys were sacrificed. (b)-(e). Examples of a retinal lesion of the macula, and the macula of the intact eye for monkey ID10-46. In (b) and (d), the fundus of the intact eye (b) and the lesioned eye (d) are shown as imaged through the pupil. Green arrows in the green boxes indicate the levels of the transverse sections through the retina shown in (c) and (e). Intact macular region is indicated with a blue line in (c). As the extent of the retinal lesions is apparent (circled with a yellow dashed line and also indicated with red arrowheads and a red bracket), the loss of vision in the right eye can be extrapolated based on a standard value for retinal magnification factor as within 5.9 × 7.3 degrees of central vision in this case. (f)-(h) Example of a retinal lesion of the peripheral retina. (f) A mosaic image of the fundus of the lesioned right eye of monkey ID10-49 taken through the pupil. Laser lesions damaged the entire periphery of the retina outside the yellow dashed circle. Green arrows indicate the levels of the transverse sections through the retina that are shown through a part of the lesion (g) and through the intact fovea and central retina (h). Red arrowheads and a red bracket indicate the site of the lesion. Scale bars = 1 mm.
Figure 2
Figure 2
(a), (b): Histological effects of the visual deprivation and a macular lesion of the right eye in case ID10-46 on the ipsilateral (a) and contralateral (b) LGN. The sections move from anterior to posterior as the annotated number increases from 1 to 3. Note that the layers with inputs from the deprived ipsilateral right eye in (a) are less densely stained in the Nissl and VGLUT2-ISH preparations, while layers with contralateral inputs from the deprived right eye are also less densely stained in (b). In the posterior extent of parvocellular LGN layers where the macula is represented, the lightly stained layers become even less stained indicating some neuron loss or atrophy from the macular lesion. The GFAP-ISH staining was more intense in these same regions of the deprived LGN layers, suggesting that astrogliosis occurred after the retinal lesion. The red squares (a-d) outline parts of the LGN that are shown at higher magnification in Figure 3. (c), (d): the histological effects of the diffuser lens and lesions of the peripheral retina of the right eye in case ID10-49. The sections move from anterior to posterior as the annotated number increases from 1 to 3. Note lighter staining in Nissl and VGLUT2-ISH preparations of the deprived layers in the ipsilateral and contralateral (d) LGNs is similar to case ID10-46 in (a) and (b), thus reflecting the effect of the diffuser lens. A decrease of neuronal signal intensity in the parts of geniculate layers representing the lesioned peripheral retina is, at best, only weakly apparent. Scale bars = 1 mm
Figure 3
Figure 3
Magnified views of portions of the LGN layer indicated by squares in Figure 2. A-F are from case ID10-46 with a diffusion lens and a macular lesion of the right eye. Ipsilateral LGN sections on right, contralateral sections, left. A comparison of dorsal layer P3 in (a) and (c) indicates that the pale staining Nissl cells in (a) are likely glia, as the cells in that region of (c) do not exhibit VGLUT2 mRNA signals. The laminar regions expressing the least Nissl or VGLUT2 mRNA contain the most ISH signals for GFAP, suggesting that activated astrocytes were accumulated as a result of the macular lesion. (g)-(l) show magnified views of parts of LGN sections from case ID10-49 with a diffusion lens and lesions of the peripheral retina of the right eye. As in the case with a macular lesion, the layers deprived by the diffuser lens in the ipsilateral and contralateral LGNs are less dark with the Nissl and VGLUT2 ISH preparations. This is moderately apparent in the ventral part of the internal P layers in (g) and more so in (i), which indicate that the loss is of neurons. In (k), the dense expression of GFAP indicates accumulation of activated astrocyte. Overall, the effects of the lesions of the peripheral retina are variably apparent, and less obvious that those of the macular lesions. Scale bars = 500 μm.
Figure 4
Figure 4
Changes in CO expression in V1 after a macular lesion and a diffuser lens for the right eye in case ID10-46. (a), (b): Mosaic images of tangential sections of left V1 stained for CO activity. (a) is mainly in layer 3 and (b) is mainly in layer 4. The estimated LPZ border is drawn by solid black lines. The expected retinotopic map follows Van Essen et al. (Van Essen et al., 1984), which is shown in (c). White windows indicate the magnified regions shown in D-G. Note the CO blobs in layer 3 and ODC stripes in layer 4 are observed. Scale bar in (d) = 2 mm. PC/pale CO columns, DC/dark CO columns. (h): The extent of the LPZ of vision loss was estimated from the CO staining of V1 sections. Impairment zone of the right V1 is unknown, because the tissue of right V1 was accidentally lost. The area and shape of retinal lesion was also calculated from retinal scan, and compared with that of V1. V.M./vertical meridian, H.M./horizontal meridian. I: Average widths of ODCs within LPZ were measured in CO staining sections. Dark CO columns were significantly larger than pale CO columns in both LPZ border and LPZ center, and pale CO columns in LPZ border were significantly smaller than those in LPZ centers (Unpaired Student t-test, ** P < 0.001).
Figure 5
Figure 5
Changes in CO expression in V1 after a macular lesion and a diffuser lens for the right eye in case ID10-48. (a), (b): Mosaic images of tangential sections mainly in layer 4 that were stained for CO activity. (a) is left V1 and (b) is right V1. LPZ border is marked by solid black line. White windows indicate regions magnified in C-F. Scale bar in (c) = 2 mm. (g): Retinal scan of the right eye by showing the lesion (arrow). (h): The LPZ was estimated from the CO staining of V1 sections, and its area was calculated. The area and shape of retinal lesion was also calculated from the retinal scan, and compared with that of V1. (i): Average widths of ODCs within LPZ were measured in CO staining sections. Dark CO columns were significantly larger than pale CO columns in both LPZ border and LPZ center, and pale CO columns near the LPZ border were significantly smaller than those in LPZ centers of right V1 (Unpaired Student t-test, ** P < 0.001).
Figure 6
Figure 6
Changes in CO expression in V1 after a macular lesion and a diffuser lens for the left eye in case ID10-54. (a), (b): Mosaic images of tangential sections mainly in layer 4 that were stained for CO activity. (a) is left V1 and (b) is right V1. LPZ border is marked by solid black line. White windows indicate the regions magnified in (c)-(f). Scale bar in (c) = 2 mm. (g): Retinal scan of the right eye by SD-OCT showing the lesion (arrow). (h): Impaired vision was estimated from the CO staining of V1 sections, and area was calculated. The area and shape of retinal lesion was also calculated from the retinal scan, and compared with that of V1. I: Average widths of ODCs within the LPZ were measured in CO staining sections. Dark CO columns were significantly larger than pale CO columns in both LPZ border and LPZ center, and pale CO columns in LPZ border were significantly smaller than those in LPZ centers in both V1. In right V1, dark CO columns near the LPZ border were significantly larger than those in LPZ centers (Unpaired Student t-test, ** P < 0.001).
Figure 7
Figure 7
Changes in CO expression in of V1 after a macular lesion and a diffuser lens for the right eye in case ID10-55. (a), (b): Mosaic images of tangential sections in mainly layer 4 that were stained for CO activity. (a) is left V1 and (b) is right V1. An enhanced CO staining method with Nickel was used for (a), therefore, the color of this case is different from other CO histochemistry images. The LPZ border is marked by solid black line. White windows indicate regions magnified in (c)-(g). Scale bar in (c) = 2 mm. (h): Retinal scan of the right eye by SD-OCT showing the lesion (arrow). I: The lesion projection zone was estimated from the CO staining of V1 sections, and its area was calculated. The area and shape of the retinal lesion was also calculated from the retinal scan, and compared with that of V1. (j): Average widths of ODCs within the LPZ were measured in CO staining sections of the right V1. Dark CO columns were significantly larger than pale CO columns in both the LPZ border zone and LPZ center. Pale CO columns near the LPZ border were significantly smaller than those in LPZ centers, and dark CO columns near the LPZ border were significantly larger than those in LPZ centers (Unpaired Student t-test, ** P < 0.001, * P < 0.01).
Figure 8
Figure 8
Changes in CO expression in V1 after lesions of the peripheral retina of the right eye in case ID10-49. (a), (b): Mosaic images of tangential sections mainly in layer 4 stained for CO activity. (a) is the left V1 and (b) is the right V1. A part of the right V1 was lost during procedure as indicated. White windows indicate the regions magnified in (d)-(g). Scale bar in (d) = 2 mm. (c): Retinal scan of the right eye by SD-OCT shows the lesion (arrow).
Figure 9
Figure 9
Changes in CO expression in V1 after lesions of the peripheral retina of the right eye in case ID10-57. There was no diffuser lens. (a), (b): Mosaic images of tangential sections in mainly layer 4 stained for CO activity. (a) is the left V1 and (b) is the right V1. White windows indicate the regions magnified in (d)-(g). Scale bar in (d) = 2 mm. (c): Retinal scan of the right eye by SD-OCT. Note that the existence of thinner dark and thicker light ODCs occurred without the presence of a diffuser lens.
Figure 10
Figure 10
Examples of ODCs revealed by different stains in three cases with a macular lesion of the right eye and partial rearing with a diffusion lens in the right eye. (a) and (b) (Case ID10-54): Mosaic images of tangential sections through layer 4 of the left V1 that were stained for CO activity (a) and VGLUT2-immunoreactivity (b). Both stains revealed almost identical ODC patterns. (e)-(g) (Case ID10-55): A sequence of adjacent tangential sections of the right V1 stained for GFAP mRNA in lower layer 3 (e) and layer 4 (g), and for CO in layer 4 (f). Note the greater GFAP expression in lower layer 3. Circles surround the same radial blood vessels across sections so that ODCs can be aligned. I (Case ID10-48): Adjacent tangential sections through layer 4 that have been processed for CO expression (h) or mRNA of c-FOS (i). Circles mark matching blood vessels, open arrows indicate pale ODCs within the LPZ for the lesioned eye, and solid black arrows indicate the thinner dark CO ODCs that are outside the LPZ. The mRNA expression of c-FOS appeared to be down-regulated in both CO-pale columns inside the LPZ and thin CO-dense columns outside the LPZ in response to the retinal lesions (CO-pale columns) and the diffuser lens for the right eye. Scale bars = 1 mm.

References

    1. Abe H, McManus JN, Ramalingam N, Li W, Marik SA, Borgloh SM, Gilbert CD. Adult cortical plasticity studied with chronically implanted electrode arrays. J Neurosci. 2015;35(6):2778–2790. - PMC - PubMed
    1. Adams DL, Economides JR, Horton JC. Contrasting effects of strabismic amblyopia on metabolic activity in superficial and deep layers of striate cortex. J Neurophysiol. 2015;113(9):3337–3344. - PMC - PubMed
    1. Adams DL, Economides JR, Sincich LC, Horton JC. Cortical metabolic activity matches the pattern of visual suppression in strabismus. J Neurosci. 2013;33(9):3752–3759. - PMC - PubMed
    1. Antonini A, Fagiolini M, Stryker MP. Anatomical correlates of functional plasticity in mouse visual cortex. J Neurosci. 1999;19(11):4388–4406. - PMC - PubMed
    1. Baekelandt V, Arckens L, Annaert W, Eysel UT, Orban GA, Vandesande F. Alterations in GAP-43 and synapsin immunoreactivity provide evidence for synaptic reorganization in adult cat dorsal lateral geniculate nucleus following retinal lesions. Eur J Neurosci. 1994;6(5):754–765. - PubMed

Publication types

MeSH terms