Review
. 2018 Dec;91(1092):20180441.
doi: 10.1259/bjr.20180441. Epub 2018 Jul 24.

Budd-Chiari syndrome: imaging review

Affiliations
Review

Budd-Chiari syndrome: imaging review

Varun Bansal et al. Br J Radiol. 2018 Dec.

Abstract

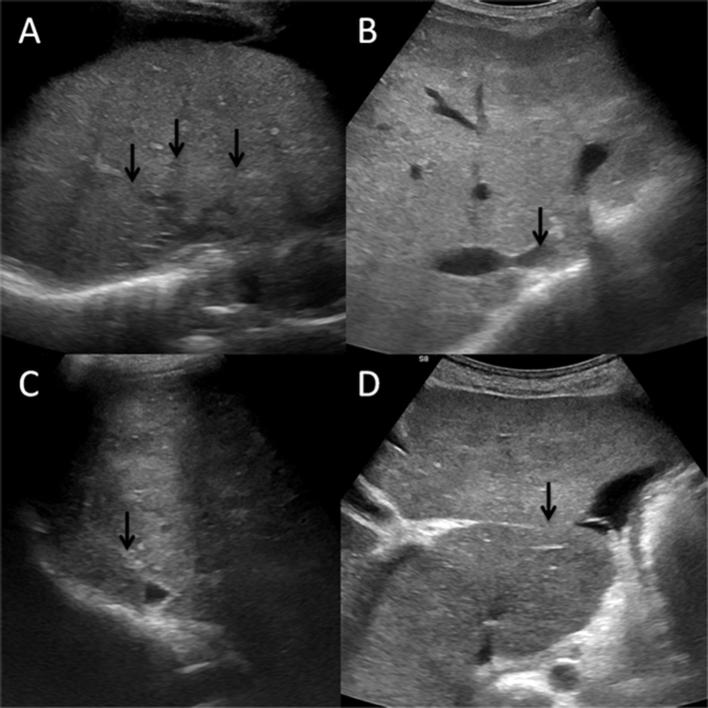
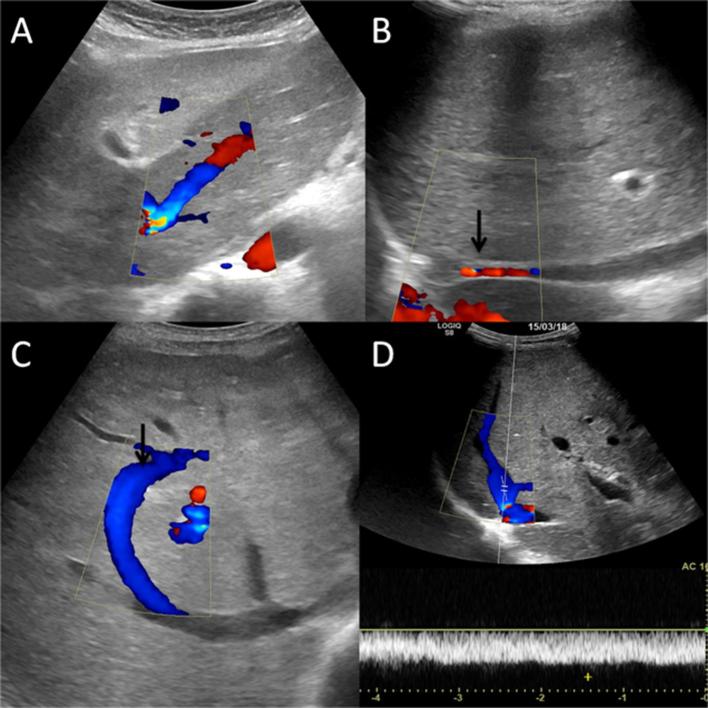
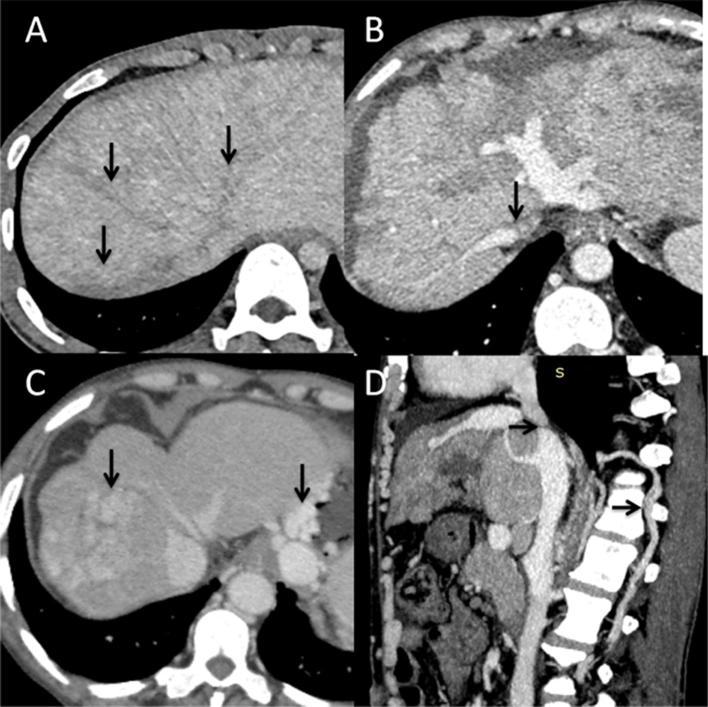
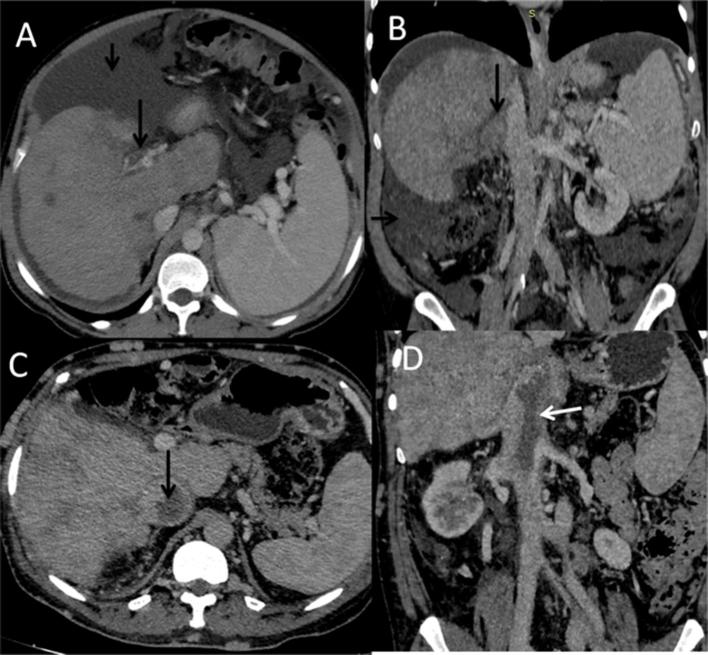
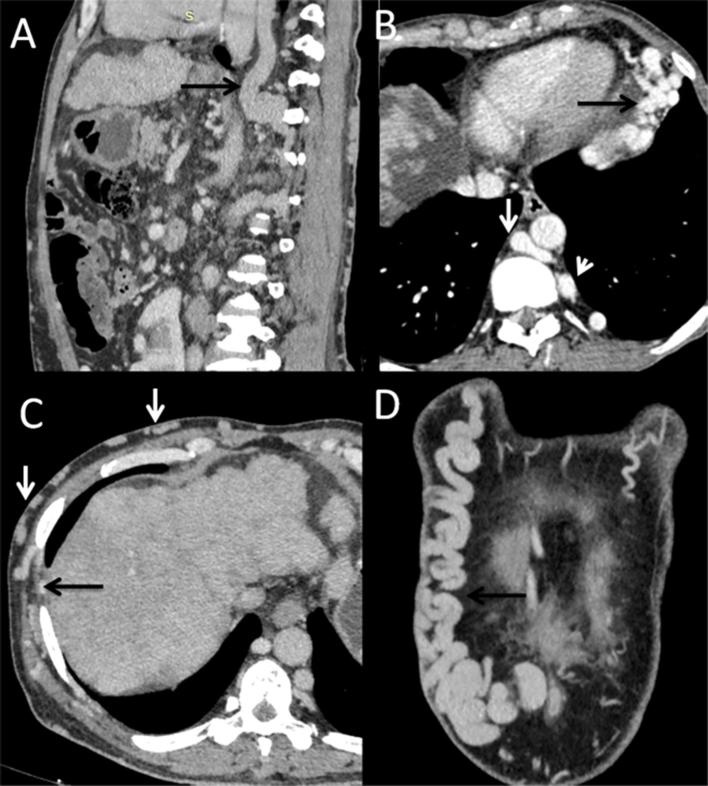
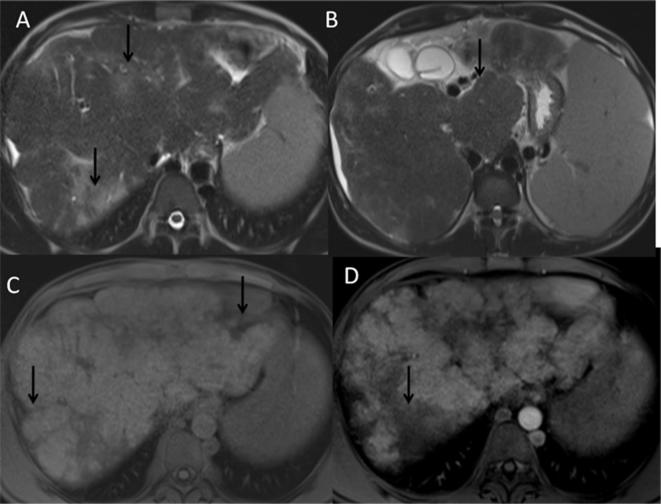
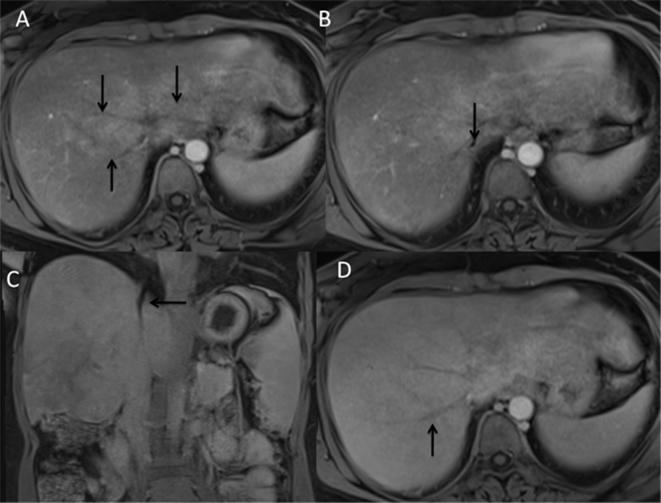
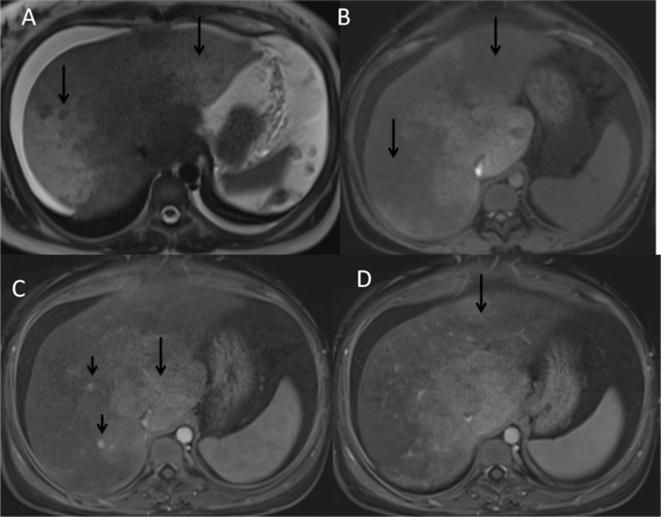
Budd-Chiari syndrome (BCS), also known as hepatic venous outflow tract obstruction includes a group of conditions characterized by obstruction to the outflow of blood from the liver secondary to involvement of one or more hepatic veins (HVs), inferior vena cava (IVC) or the right atrium. There are a number of conditions that lead to BCS-ranging from hypercoagulable states to malignancies. In up to 25% patients, no underlying disorder is identified. Diagnosis of BCS is based on a combination of clinical and imaging features. A major part of the literature in BCS has been devoted to interventions; however, a detailed description of various imaging manifestations of BCS is lacking. In this review, we highlight the importance of various imaging modalities in the diagnosis of BCS.


Figures

Figure 1.
Figure 1.
Ultrasound changes in BCS: Abnormal hepatic veins that are not seen along their entire course and show slightly echogenic lumen (arrows, A). Short segment stenosis of the right hepatic vein (arrow, B). Echogenic right hepatic vein (arrow, C). Enlarged caudate lobe (arrow, D). BCS, Budd-Chiari syndrome.
Figure 2.
Figure 2.
Doppler findings in BCS: Dilated caudate lobe vein is seen in a patient with chronic BCS (arrow, A). Doppler ultrasound in another patient with chronic BCS shows marked extrinsic compression of IVC (arrow, B). Doppler ultrasound image in the same patient shows intrahepatic comma-shaped veno-venous collateral between the hepatic veins (arrow, C). Monophasic flow in right hepatic vein that shows normal color flow (arrow, D). BCS, Budd-Chiari syndrome; IVC, inferior vena cava.
Figure 3.
Figure 3.
CT findings in BCS: Axial CT image in a patient with subacute BCS shows non-opacified hepatic veins (arrows, A). In another patient with chronic BCS, the abnormal confluence of hepatic veins with IVC is seen on axial CT image (arrow, B). Venovenous and perihepatic collaterals are seen on axial CT in a patient with chronic BCS (arrows, C). Sagittal CT image shows short segment stenosis of IVC with azygous-lumbovetebral collaterals (arrows, D). BCS, Budd-Chiari syndrome; IVC, inferior vena cava.
Figure 4.
Figure 4.
CT findings in BCS: (A) Axial CT image in a patient with subacute BCS shows thrombosis of main portal vein seen as filling defect (arrow, A). Coronal CT image in a patient with acute BCS shows filling defect in the middle HV (arrow, B). Ascites is also seen (short arrows, A and B). Axial and coronal CT images in a patient with thrombosis of IVC seen as filling defect causing expansion of the lumen (arrows, C and D). BCS, Budd-Chiari syndrome; HV, hepatic veins; IVC, inferior vena cava.
Figure 5.
Figure 5.
Collateral pathways in BCS: Coronal CT image in a patient with chronic BCS shows dilated azygous vein draining the lumbovertebral veins (arrow, A). In another patient with chronic BCS, pericardiophrenic venous collaterals is seen on axial CT image (arrow, B). Also seen are dilated azygous (short arrow, B) and hemiazygous veins (arrow head, B). Abdominal wall venous collaterals (short arrows, C) draining the hepatic capsular veins (arrow, C) and markedly dilated tortuous epigastric collaterals (arrow, D) are seen in a patient with chronic BCS. BCS, Budd-Chiari syndrome.
Figure 6.
Figure 6.
MR findings in BCS: Axial T2W in a patient with subacute BCS shows heterogeneous signal intensity of the liver (arrow, A). Axial T2W image in the same patient at a different level shows caudate lobe enlargement (arrow, B). Axial T1W image shows nodular liver outline (arrows, C). Post-gadolinium image in the arterial phase shows heterogeneous enhancement of liver (arrow, D). BCS, Budd-Chiari syndrome; T1W, T1 weighted; T2W, T2 weighted.
Figure 7.
Figure 7.
MR findings in BCS: Axial contrast enhanced MR image in a patient with chronic BCS shows non-opacified hepatic veins (arrows, A). Axial and coronal contrast-enhanced MR images show filling defect in IVC (arrows, B and C). Non-opacified hepatic veins are seen in another patient with chronic BCS (arrows, D). BCS, Budd-Chiari syndrome; IVC, inferior vena cava.
Figure 8.
Figure 8.
MR findings in BCS: Heterogeneous signal intensity of the liver is seen on axial T2W and T1W images in a patient with subacute BCS (arrow, A and B). Enhancement of the caudate lobe with non-enhancing periphery is seen in the arterial phase axial MR image in the same patient (arrow, B). Also note tiny hyper-enhancing nodules in right lobe (short arrows, C) suggestive of nodular regenerative hyperplasia. In the venous phase in the same patient, there is some enhancement of the liver periphery (arrows, D). BCS, Budd-Chiari syndrome; T1W, T1 weighted; T2W, T2 weighted.
Figure 9.
Figure 9.
Contrast-enhanced ultrasound: Normal hepatic veins are seen as enhancing structures (arrows, A). Stenosis is seen at the junction of the middle-left hepatic vein and IVC in a patient with subacute BCS (arrow, B). BCS, Budd-Chiari syndrome; IVC, inferior vena cava.
Figure 10.
Figure 10.
Inferior vena cava angioplasty and stenting: Venogram performed via transfemoral route shows lack of opacification of IVC. There is filling of multiple collaterals (arrows, A). Following balloon angioplasty, there is significant residual stenosis and stent is placed (arrows, B). Stent is seen in situ (arrows, C). Post-angioplasty and stenting venogram reveals normal opacification of the IVC (arrow, D). IVC, inferior vena cava.
Figure 11.
Figure 11.
TIPSS in a patient with subacute BCS: Axial CT image shows lack of opacification of the hepatic veins; IVC is normally opacified (arrow, A). Right portal vein is accessed via the right transjugular approach (arrow, B). A parenchymal tract is created (arrows, C). Venogram reveals the TIPSS tract (arrow, D). Post-procedure CT shows normal opacification of the TIPSS stent (arrow, E). BCS, Budd-Chiari syndrome; IVC, inferior vena cava; TIPSS, transjugular intrahepatic portosystemic shunts.
Figure 12.
Figure 12.
Post-treatment imaging: Normal opacification of the mesocaval shunt (arrow, A) is seen on coronal MR venography image. Middle hepatic vein stent (arrow, B) on ultrasound. It shows aliasing (arrow, C) and increased flow velocity on Doppler ultrasound evaluation suggestive of the stenosis. Non-opacified meso-caval shunt in another patient on axial post-contrast MR image (arrow, D).

Similar articles

Cited by

References

    1. Janssen HL, Garcia-Pagan JC, Elias E, Mentha G, Hadengue A, Valla DC, et al. . Budd-Chiari syndrome: a review by an expert panel. J Hepatol 2003; 38: 364–71. doi: 10.1016/S0168-8278(02)00434-8 - DOI - PubMed
    1. Grus T, Lambert L, Grusová G, Banerjee R, Burgetová A, Syndrome B-C. Budd-Chiari syndrome. Prague Med Rep 2017; 118: 69–80. doi: 10.14712/23362936.2017.6 - DOI - PubMed
    1. Goel RM, Johnston EL, Patel KV, Wong T. Budd-Chiari syndrome: investigation, treatment and outcomes. Postgrad Med J 2015; 91: 692–7. doi: 10.1136/postgradmedj-2015-133402 - DOI - PubMed
    1. Aydinli M, Bayraktar Y. Budd-Chiari syndrome: etiology, pathogenesis and diagnosis. World J Gastroenterol 2007; 13: 2693–6. doi: 10.3748/wjg.v13.i19.2693 - DOI - PMC - PubMed
    1. Martens P, Nevens F. Budd-Chiari syndrome. United European Gastroenterol J 2015; 3: 489–500. doi: 10.1177/2050640615582293 - DOI - PMC - PubMed