

HIV DNA levels and decay in a cohort of 111 long-term virally suppressed patients
- PMID: 30005008
- PMCID: PMC6136948
- DOI: 10.1097/QAD.0000000000001948
HIV DNA levels and decay in a cohort of 111 long-term virally suppressed patients
Abstract
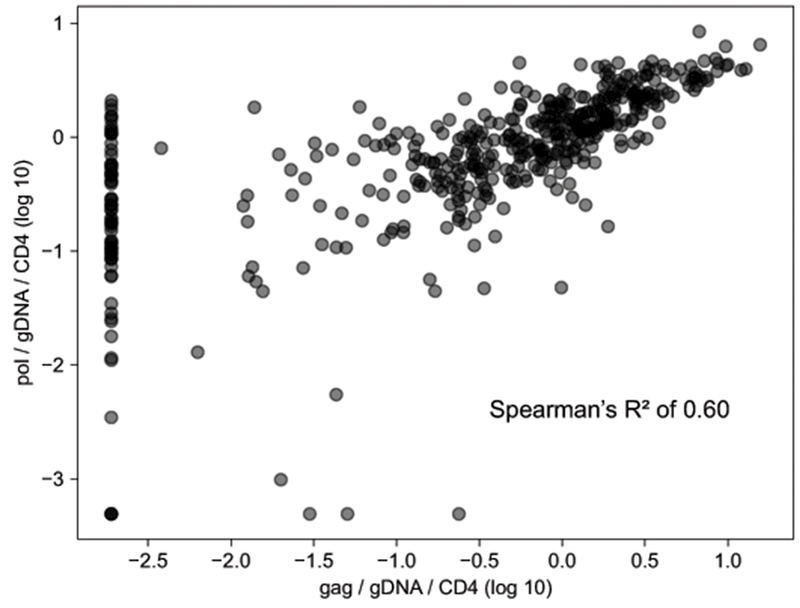
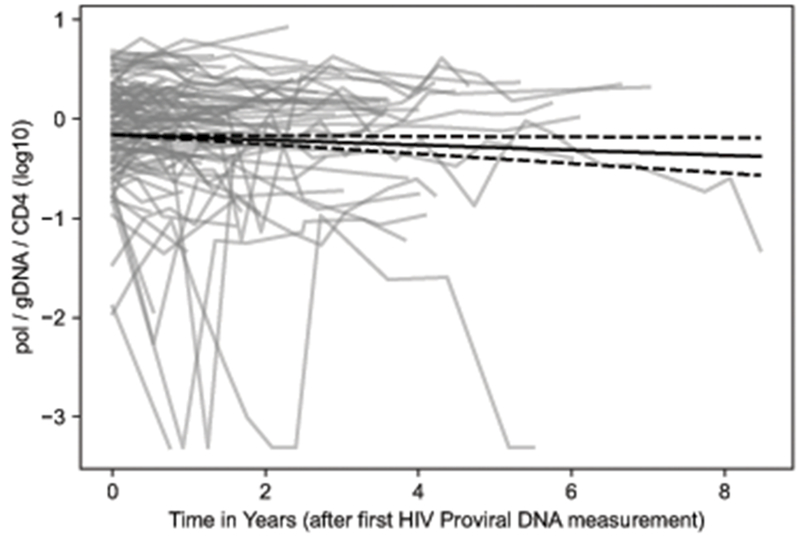
Background and method: We examined specimens from 111 HIV-infected participants virally suppressed on ART for a minimum of 5 years who had donated serial peripheral blood mononuclear cell (PBMC) specimens to the University of Washington/Fred Hutch Center for AIDS Research (CFAR) Specimen Repository. We determined the HIV proviral copy number per million PBMCs, corrected for CD4 cell count, in 477 specimens collected after a minimum of 5 years of follow-up and up to 15.5 years of clinical viral suppression. Generalized estimating equation regression was used to examine the association between the reservoir size and time, age at study entry, antiretroviral regimen, and risk factors for HIV acquisition.
Results and conclusion: We found that the inter-participant baseline HIV DNA level varied widely between 0.01 and 4.8 pol-copies per microgram genomic DNA and per CD4 cell number/micoliter; the HIV DNA level declined with time (half-life was estimated at 12 years, 95% confidence interval of 6.2-240 years); the HIV DNA level was lower for those who achieved viral suppression at a younger age; and the HIV DNA level was not affected by the specific antiretroviral regimen used to achieve and maintain suppression.
Conflict of interest statement
Conflicts of Interest:
The authors have no conflicts of interest to disclose.
Figures
Comment in
-
HIV DNA decay during antiretroviral therapy: lessons from a clinic-based cohort study.AIDS. 2018 Sep 24;32(15):2255-2257. doi: 10.1097/QAD.0000000000001949. AIDS. 2018. PMID: 30212405 Free PMC article. No abstract available.
References
-
- Finzi D et al. Latent infection of CD4+ T cells provides a mechanism for lifelong persistence of HIV-1, even in patients on effective combination therapy. Nat. Med 5, 512–517 (1999). - PubMed
-
- Ramratnam B et al. The decay of the latent reservoir of replication-competent HIV-1 is inversely correlated with the extent of residual viral replication during prolonged anti-retroviral therapy. Nat. Med 6, 82–85 (2000). - PubMed
-
- Siliciano JD et al. Long-term follow-up studies confirm the stability of the latent reservoir for HIV-1 in resting CD4+ T cells. Nat. Med 9, 727–728 (2003). - PubMed
Publication types
MeSH terms
Substances
Grants and funding
LinkOut - more resources
Full Text Sources
Other Literature Sources
Medical
Research Materials
