. 2018 Jul 13;14(7):e1006185.
doi: 10.1371/journal.pcbi.1006185. eCollection 2018 Jul.

miRAW: A deep learning-based approach to predict microRNA targets by analyzing whole microRNA transcripts

Affiliations

miRAW: A deep learning-based approach to predict microRNA targets by analyzing whole microRNA transcripts

Albert Pla et al. PLoS Comput Biol. .

Abstract

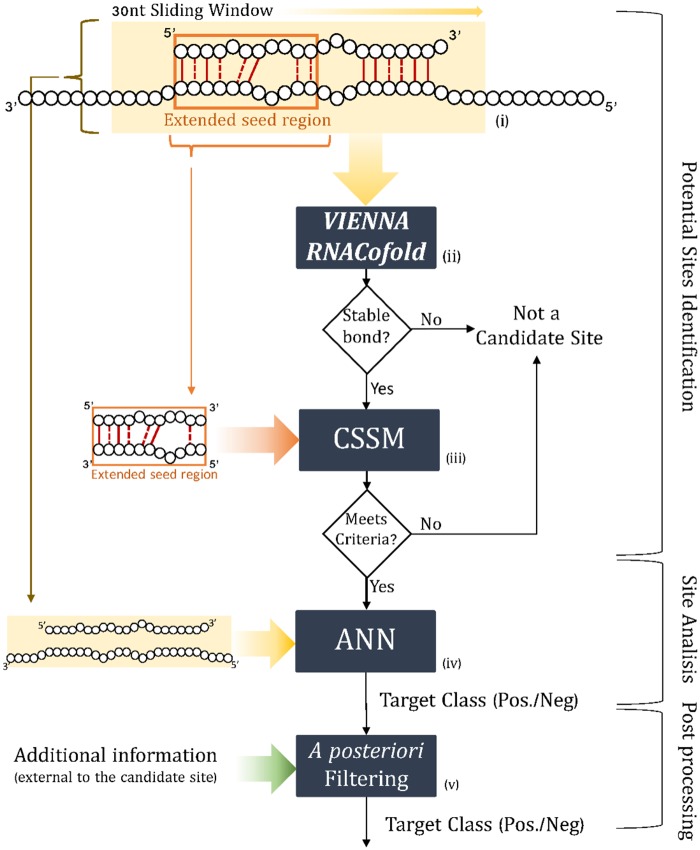
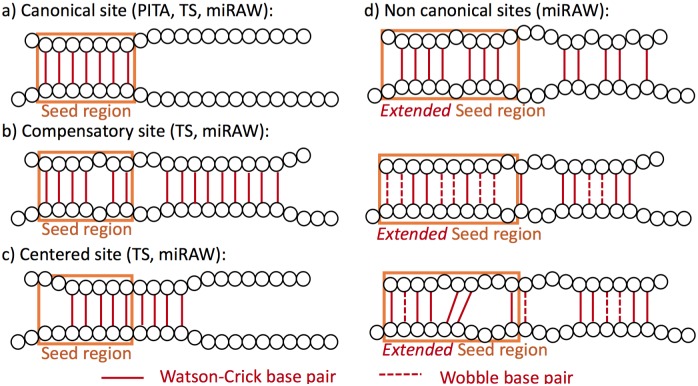
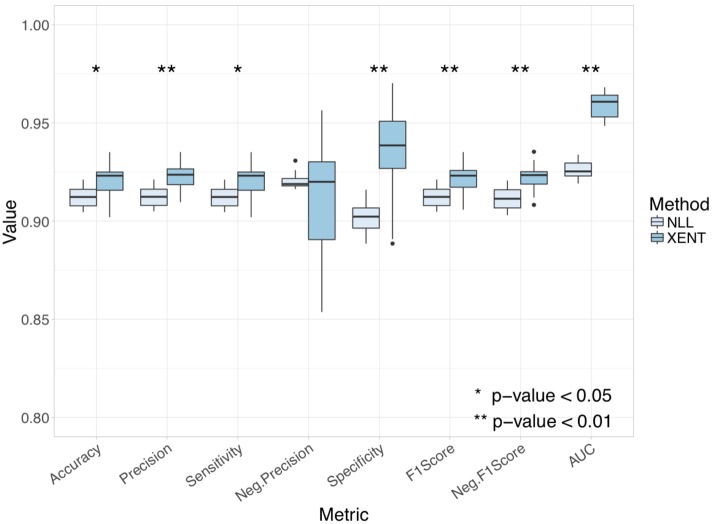
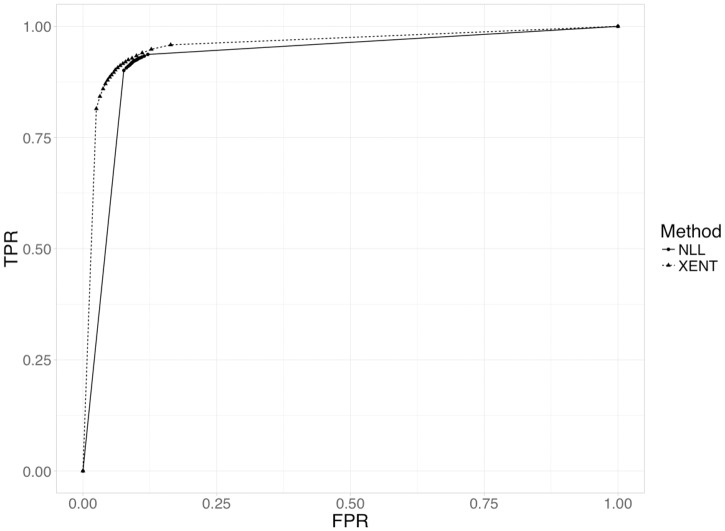
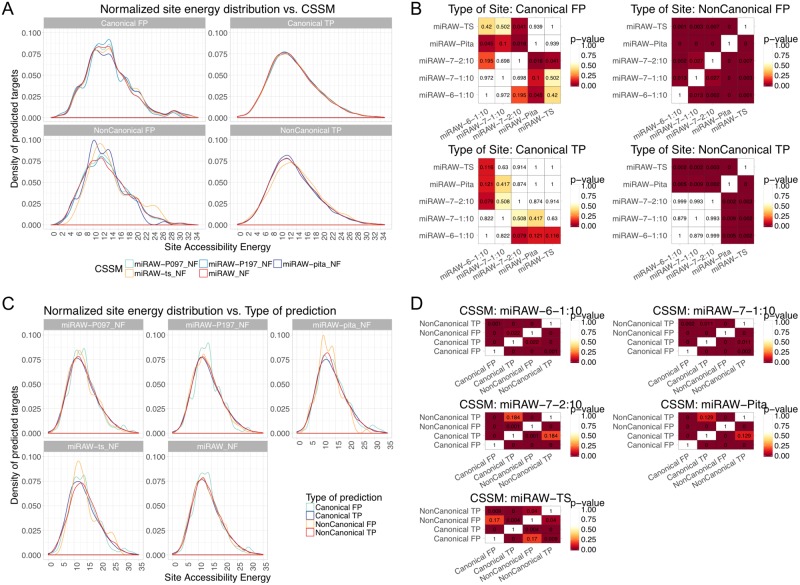
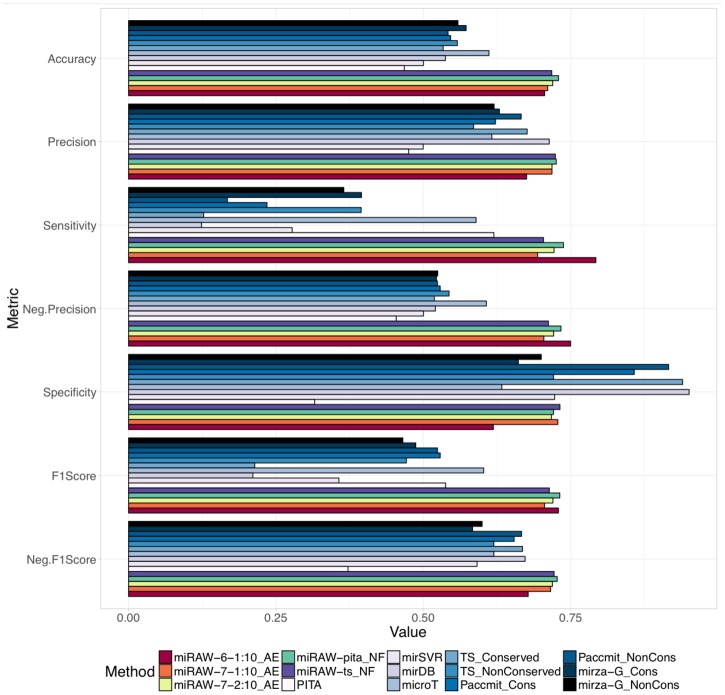
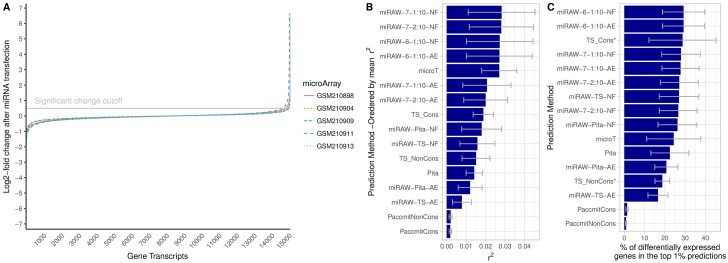
MicroRNAs (miRNAs) are small non-coding RNAs that regulate gene expression by binding to partially complementary regions within the 3'UTR of their target genes. Computational methods play an important role in target prediction and assume that the miRNA "seed region" (nt 2 to 8) is required for functional targeting, but typically only identify ∼80% of known bindings. Recent studies have highlighted a role for the entire miRNA, suggesting that a more flexible methodology is needed. We present a novel approach for miRNA target prediction based on Deep Learning (DL) which, rather than incorporating any knowledge (such as seed regions), investigates the entire miRNA and 3'TR mRNA nucleotides to learn a uninhibited set of feature descriptors related to the targeting process. We collected more than 150,000 experimentally validated homo sapiens miRNA:gene targets and cross referenced them with different CLIP-Seq, CLASH and iPAR-CLIP datasets to obtain ∼20,000 validated miRNA:gene exact target sites. Using this data, we implemented and trained a deep neural network-composed of autoencoders and a feed-forward network-able to automatically learn features describing miRNA-mRNA interactions and assess functionality. Predictions were then refined using information such as site location or site accessibility energy. In a comparison using independent datasets, our DL approach consistently outperformed existing prediction methods, recognizing the seed region as a common feature in the targeting process, but also identifying the role of pairings outside this region. Thermodynamic analysis also suggests that site accessibility plays a role in targeting but that it cannot be used as a sole indicator for functionality. Data and source code available at: https://bitbucket.org/account/user/bipous/projects/MIRAW.


Conflict of interest statement

The authors have declared that no competing interests exist.

Figures

Fig 1
Fig 1. Schematic of the process used by miRAW to evaluate a miRNA binding site.
(i) A 30nt sliding window (with 5nt step) is used to scan the 3’UTR of a gene; (ii) The Vienna RNACofold software package is used to estimate whether the microRNA and the 30nt transcript can form a stable bond; (iii) If a stable bond is predicted, miRAW checks if the extended seed region meets the criteria defined in the candidate site selection method (CSSM); (iv) If the criteria are met, the full mature microRNA transcript and 30nt corresponding to the candidate site are fed into miRAW’s neural network to generate a classification; (v) The prediction can be refined by a filtering step that applies additional information that is external to the miRNA:site duplex.
Fig 2
Fig 2. Examples of the types of miRNA binding sites considered by different candidate site selection methods (CSSMs).
(a) Potential canonical binding site accepted by the PITA, TargetScan (TS), and miRAW CSSMs. Here, the seed region contains a perfect 7mer. (b) Potential non-canonical compensatory binding site accepted by TS and miRAW CSSMs. The missing nucleotide pair in the seed region is compensated by the 9 consecutive pairs starting at position 10—centered pairing requires at least a 4mer at positions 10 to 14. (c) Potential non-canonical centered target site accepted by TS and miRAW CSSMs. The lack of perfect seed matching is compensated by additional consecutive pairs in nucleotides 9 to 12. (d) Potential non-canonical sites accepted only by the miRAW CSSMs. The extended seed region (10 nucleotides) and the inclusion of wobbles allows these scenarios to be considered as potential target sites.
Fig 3
Fig 3. Comparison of miRAW’s neural network performance with the positive and negative training datasets when using a negative log likelihood (NLL) loss function and a cross entropy loss function (XENT) with 10 fold cross validation.
XENT provides significantly better accuracy, precision, sensitivity, specificity, F1-scores and area under the curve (AUC) compared to NLL (* p-value < 0.05, ** p-value < 0.01).
Fig 4
Fig 4. Average ROC curves for cross validation of miRAW’s neural network using the positive and negative training datasets.
The dashed line corresponds to the aggregated ROC obtained with the XENT loss function (AUC = 0.96), the solid line corresponds to the NLL loss function (AUC = 0.93). The XENT loss function presents a smoother ROC curve with a higher area under the curve, indicating better performance.
Fig 5
Fig 5. Evaluation of miRAW using different CSSMs and in the presence (AE) and absence (NF) of ΔGopen filtering (threshold = -10Kcal/mol).
Results are evaluated in terms of accuracy, precision, sensitivity, negative precision, specificity, positive F1-score and negative F1-score. The best results in terms of accuracy and negative F1-Score were obtained when using Pita’s CSSM and when no filtering was applied. The highest positive F1-Score was obtained by miRAW-7-2:10. Canonical CSSMs (TS and Pita) obtain better results when no filter is applied, the application of ΔGopen filtering introduces false negatives resulting in low sensitivity and negative precision. Conversely, non-canonical CSSMs (miRAW-6-1:10, miRAW-7-1:10 and miRAW-7-2:10) present better results when filtering is applied as this reduces the number of false positives, thereby increasing precision and specificity; when no filtering was applied miRAW was biased towards the prediction of positive sites, which resulted in high sensitivity but low precision.
Fig 6
Fig 6. Composition of site types identified by the different CSSMs implemented in miRAW.
(a) Average number of miRNA binding sites (MBSs) identified by the different CSSMs in a miRNA:mRNA pair. Blue color refer to MBS following a canonical structure, green refer to non-canonical sites; darker colors correspond to positive sites predicted in experimentally verified functional miRNA:mRNA pairs (true positives), lighter colors refer to positive sites identified in non-functional pairs (false positives). (b) Proportion of canonical, non-canonical, true positive and false negative sites identified by each of the candidate site selection methods. Figures illustrate that miRAW-Pita and miRAW-TS CSSMs are strongly biased towards detection of canonical sites whereas miRAW specific CSSMs detect a higher proportion of non-canonical sites.
Fig 7
Fig 7. Example of a miRNA binding site that can accommodate a miRNA (hsa-miR-21) with different binding patterns and different site stabilities.
The left figure shows a canonical binding (perfect 7mer) with ΔGduplex = −10.30kcal/mol while the right figure shows a non-canonical binding (containing wobbles in the seed region) ΔGduplex = −11.70kcal/mol. While the left structure can be identified by both canonical and non-canonical CSSMs, a non-canonical CSSM will preferentially select the right hand structure as a potential MBS since it reports a more stable predicted binding energy.
Fig 8
Fig 8
(a)Number of MBSs identified by each CSSM in the presence (AE) and absence (NF) of ΔGopen filtering. Values > 40 are excluded from the plot for comparative purposes. Red (upper) numbers and green (lower) numbers show the mean and the median respectively of the number of MBSs identified by each CSSM. miRAW-Pita_AE and miRAW-TS_AE have the lowest number of MBSs while miRAW_6-1:10_AE has the highest. The number of sites discarded by accessibility energy filtering (AE) is higher in non-canonical oriented CSSMs than in canonical-oriented ones. (b) Relationship between the probability of miRAW obtaining a false positive prediction and the number of sites identified by each CSSM. The fact that miRAW classifies a miRNA:mRNA duplex as positive if a single miRNA:MBSs is predicted as positive by the neural network increases the chances of obtaining a false-positive prediction as the number of potential MBSs increases. As non-canonical oriented CSSMs tend to detect higher numbers of potential MBSs they are more sensitive to a false positive. The application of ΔGopen filtering reduces the number of potential MBSs and therefore reduces the probability of a false positive.
Fig 9
Fig 9. Performance of miRAW in relation to ΔGopen filtering threshold.
(a) Variation in accuracy with respect to ΔGopen filtering threshold. (b) Variation in positive F1-score with respect to ΔGopen filtering threshold. (c) Variation in negative F1-score with respect ΔGopen filter threshold. Graphs show that for non-canonical oriented CSSMs, the application of a ΔGopen improves accuracy and negative F1-score values as better scores are obtained when sites with higher ΔGopen values are removed. The peak in the accuracy curve and the fact that the positive F1-score reaches a plateau around ΔGopen = 10, indicates this is an optimal cutoff value. For the canonical-oriented CSSMs, accuracy and positive F1-score metrics reach a plateau around ΔGopen ≥ 23 whereas the negative F1-score curve slightly decreases from ΔGopen ≥ 18. However, the decrease is small compared to the changes in the positive F1-score chart, suggesting that ΔGopen filtering has limited relevance for these models.
Fig 10
Fig 10
Energy distributions of the site accessibility energy ΔGopen for target sites predicted by miRAW using different CSSMs (a) ΔGopen distributions grouped by the type of site identified by each CSSM (with extreme values removed for comparative purposes). Blue curves correspond to non-canonical CSSMs, red and yellow curves correspond to canonical CSSMs. In general, ΔGopen distributions are smoother for true positive sites (for both canonical and non-canonical CSSMs) than for false positive sites. (b) Pairwise comparison for statistical significance among CSSMs (Kolmogorov-Smirnov test (p < 0.05)). The most striking differences are between the ΔGopen distributions of non-canonical false positive sites, with differences identified between all CSSMs. For non-canonical true positive sites, statistical significance is only identified between canonical (miRAW-TS, miRAW-Pita) and the non-canonical (miRAW specific) CSSMs. For canonical sites, there are fewer significant differences; this can be explained by the fact that all the CSSMs identify similar MBSs. (c) Same energy distribution data in (a), but grouped by the CSSMs used for identifying the sites. The smoother distribution of the true positives is also apparent in these plots. (d) Pairwise comparisons of the different site types identified by each CSSM (TP/FP and canonical/non-canonical)—(Kolmogorov-Smirnov test (p < 0.05)).
Fig 11
Fig 11. Comparison of miRAW with different CSSMs and eight other commonly used target prediction tools (TargetScan C & NC, Diana microT-CDS v4, PITA v6, miRanda, Paccmit, mirzaG and mirDB).
Colouring for miRAW results are consistent with the color scheme in Fig 5; other prediction tools follow a light to dark blue color schema. Evaluation was determined in terms of accuracy, precision, sensitivity, negative precision, specificity and F1-score (an ideal predictor would obtain a score of 1 for each metric). All miRAW configurations outperformed other methods in terms of accuracy and F-scores, which are good representations of general measures of performance. mirDB and Target-Scan (highly conserved targets) obtained high specificity scores but a low negative precision as a consequence of their conservative approach, which classified almost all the miRNA:mRNA pairs as negative. After miRAW, microT was the method which presented better and more balanced results.
Fig 12
Fig 12. Correlation between target prediction and gene expression change after miRNA transfection to HeLa cells.
A) Gene expression fold-change distribution after miRNA transfection to HeLa cells. The distribution shows that only a small fraction of genes interacted with miRNAs hsa-miR-9-5p, hsa-miR-181a-5p, hsa-miR-148b-3p, hsa-miR-142-3p and hsa-miR-132-3p. B) Coefficient of determination (r2) between miRNA targets predicted by different algorithms predictions and mRNA fold changes observed in the dataset. Higher r2 values indicate a higher link between predictions and mRNA fold changes. *TargetScan was not evaluated for hsa-miR-148b-3p (GSE8501-GSM210911) due to lack of predictions for that miRNA. C) Percentage of the top predictions of each algorithm that corresponded to genes that presented changes in their gene expression (≥ log(2)).

References

    1. Brennecke J, Stark A, Russell RB, Cohen SM. Principles of microRNA–target recognition. PLoS biol. 2005;3(3):e85 10.1371/journal.pbio.0030085 - DOI - PMC - PubMed
    1. Grosswendt S, Filipchyk A, Manzano M, Klironomos F, Schilling M, Herzog M, et al. Unambiguous identification of miRNA: target site interactions by different types of ligation reactions. Molecular cell. 2014;54(6):1042–1054. 10.1016/j.molcel.2014.03.049 - DOI - PMC - PubMed
    1. Moore MJ, Scheel TK, Luna JM, Park CY, Fak JJ, Nishiuchi E, et al. miRNA-target chimeras reveal miRNA 3 [prime]-end pairing as a major determinant of Argonaute target specificity. Nature communications. 2015;6 10.1038/ncomms9864 - DOI - PMC - PubMed
    1. Seok H, Ham J, Jang ES, Chi SW. MicroRNA Target Recognition: Insights from Transcriptome-Wide Non-Canonical Interactions. Molecules and cells. 2016;39(5):375 10.14348/molcells.2016.0013 - DOI - PMC - PubMed
    1. Schirle NT, Sheu-Gruttadauria J, MacRae IJ. Structural basis for microRNA targeting. Science. 2014;346(6209):608–613. 10.1126/science.1258040 - DOI - PMC - PubMed

Publication types