. 2018 Jul 13;19(1):537.
doi: 10.1186/s12864-018-4896-2.

Refining a steroidogenic model: an analysis of RNA-seq datasets from insect prothoracic glands

Affiliations

Refining a steroidogenic model: an analysis of RNA-seq datasets from insect prothoracic glands

Panagiotis Moulos et al. BMC Genomics. .

Abstract

Background: The prothoracic gland (PG), the principal steroidogenic organ of insects, has been proposed as a model for steroid hormone biosynthesis and regulation.

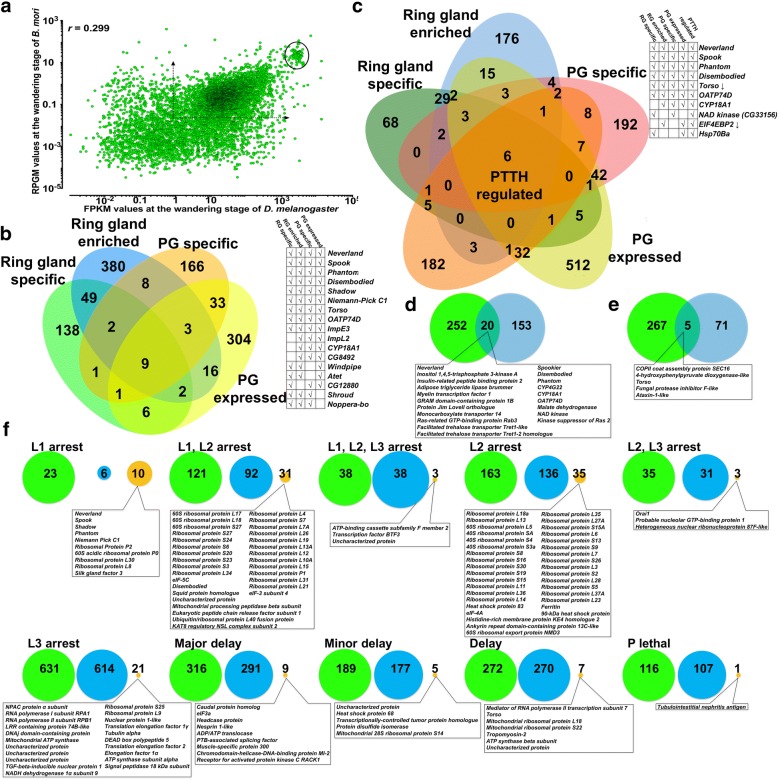
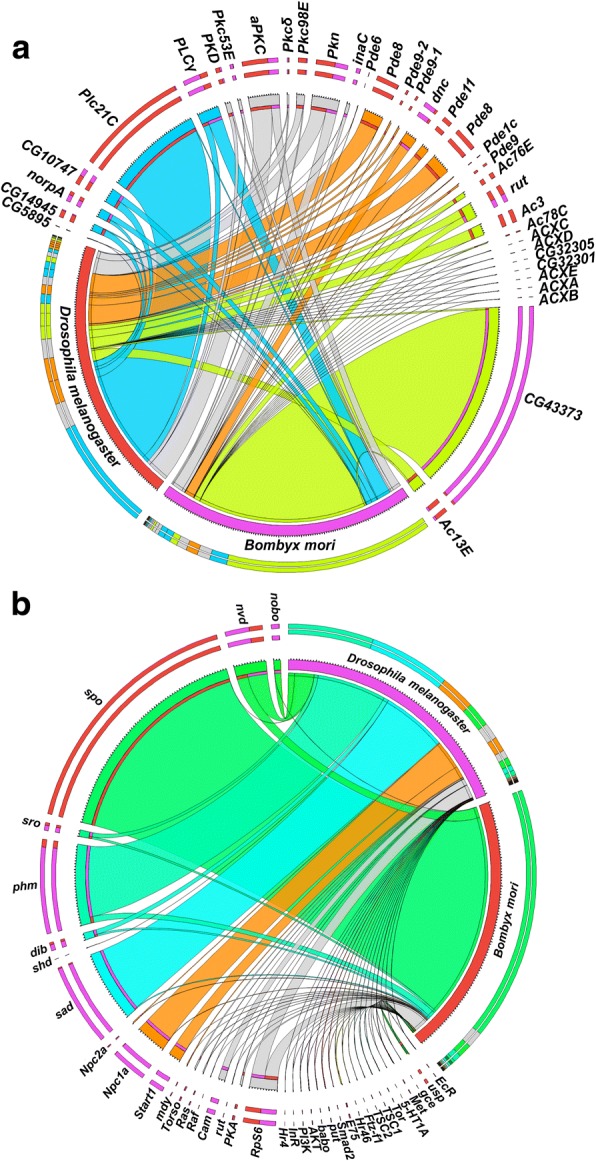
Results: To validate the robustness of the model, we present an analysis of accumulated transcriptomic data from PGs of two model species, Drosophila melanogaster and Bombyx mori. We identify that the common core components of the model in both species are encoded by nine genes. Five of these are Halloween genes whose expression differs substantially between the PGs of these species.

Conclusions: We conclude that the PGs can be a model for steroid hormone synthesis and regulation within the context of mitochondrial cholesterol transport and steroid biosynthesis but beyond these core mechanisms, gene expression in insect PGs is too diverse to fit in a context-specific model and should be analysed within a species-specific framework.

Keywords: Bombyx mori genome; Ecdysone; Halloween genes; Insect orthology; Prothoracic gland; Ring gland; Steroid hormone; Steroidogenesis.


Conflict of interest statement

Ethics approval and consent to participate

There are no specific guidelines and permits required for the use of silkworms in scientific experiments in Greece. The research abides by the Presidential Decree No 160/1991, which implements the EEC Directive 86/609/EEC, and provides the guidelines for protection of animals used for experimental and other scientific purposes, the Presidential Decree No 1197/1981 that allows experiments on animals for scientific purposes to be conducted by biologists and recommendations 2007/526 EEC.

Consent for publication

Not applicable.

Competing interests

Dr. Panagiotis Moulos is a co-founder of HybridStat Predictive Analytics G.P. and a member of its scientific advisory board.

Publisher’s Note

Springer Nature remains neutral with regard to jurisdictional claims in published maps and institutional affiliations.

Figures

Fig. 1
Fig. 1
Quantitative and qualitative parameters of gene expression in Bombyx mori prothoracic glands. a: Schematic workflow that identified genes differentially (Diff.) and/or highly expressed in the Bm PGs on V-0 and V-6 of the 5th instar. b: Correlation between the Bowtie2 and Cufflinks results output on V-0 of the 5th instar. For each gene, the RPGM (Reads Per Gene Model) derived from Bowtie2 were plotted against the FPKM (Fragments Per Kilobase of transcript per Million of mapped reads) derived from Cufflinks. Dashed arrows define the coordinates above which all genes are considered as expressed (see text for details). c: Correlation between the Bowtie2 and Cufflinks results output on V-6 of the 5th instar. For each gene, the RPGM (Reads Per Gene Model) derived from Bowtie2 were plotted against the FPKM (Fragments Per Kilobase of transcript per Million of mapped reads) derived from Cufflinks. Dashed arrows define the coordinates above which all genes are considered as expressed (see text for details). d: Determination of the critical RPGM and FPKM value above which all genes are considered as expressed on V-0 of the 5th instar. For each gene, the RPGM values derived from Bowtie2 versus the transcript levels (yellow circles), determined by qPCR, and FPKM values derived from Cufflinks versus the transcript levels (green circles), determined by qPCR, are plotted. Dashed lines indicate the coordinates above which all genes are considered as expressed. Circles indicate the gene with the least RPGM and FPKM value that was identified as expressed by qPCR (see text for details). e: Identification of the critical RPGM and FPKM value above which all genes are considered as expressed on V-6 of the 5th instar. For each gene, the RPGM values derived from Bowtie2 versus the transcript levels (yellow circles), determined by qPCR, and FPKM values derived from Cufflinks versus the transcript levels (green circles), determined by qPCR, are plotted. Dashed lines indicate the coordinates above which all genes are considered as expressed. Circles indicate the gene with the least RPGM and FPKM value that was identified as expressed by qPCR (see text for details). f: Venn diagram comparing genes considered as expressed in Bm PGs on V-0 or V-6 of the 5th instar. Identification of expressed genes was based on FPKM and RPGM values being higher than the minimum estimates from Fig. 1d and e. g: g:Cocoa [40] results showing statistically significant overrepresented (upper panel) and underrepresented (lower panel) GO terms assigned to genes expressed on V-0 or V-6 of the 5th instar. Yellow squares show biological processes and dark green squares show molecular functions. Arrows indicate the immediate hierarchical relationship of each term
Fig. 2
Fig. 2
Comparative analysis of gene expression by the prothoracic glands of Bombyx mori and Drosophila melanogaster. a: Correlation between genes expressed by the Bm PGs on V-6 of the 5th instar and genes expressed in the Dm RGs on the wandering stage as described [31]. For each gene that its orthologue was identified in each of the species, the RPGM (Reads Per Gene Model) derived from Bowtie2 for Bm were plotted against the FPKM (Fragments Per Kilobase of transcript per Million of mapped reads) derived from Cufflinks for Dm [31]. Dashed arrows define the values above which all genes are considered as expressed in either species [31]. The circled area indicates a cluster of highly expressed ribosomal proteins in both species (see Additional file 12: Table S11). b: Venn diagram comparing the Dm RG-specific [4] and the Dm RG-enriched genes [31] with the Bm PG-specific [29, 30] and the Bm-PG expressed genes (this study). The adjacent grid highlights the genes found in at least two of these four datasets. c: Venn diagram comparing the ring gland-specific [4], the Dm RG-enriched [31] genes with the PG-specific [29, 30], the PG expressed genes (this study) and the PTTH-regulated genes [4] of Bm. The adjacent grid highlights the genes found in at least three of these five datasets. d: Venn diagram comparing the PTTH-upregulated genes in Bm PGs [4] with the PG-specific genes [29, 30] (see Additional file 13: Table S12). e: Venn diagram comparing the PTTH-downregulated genes in Bm PGs [4] with the PG-specific genes [29, 30] (see Additional file 13: Table S12). f: Proportional representation of Bm and Dm orthologous genes whose Dm RG-specific silencing resulted in the indicated phenotype as described [32]. Green circles show the number of Dm genes whose RG-specific silencing exhibited the indicated phenotype [32], blue circles show the number of their Bm orthologues that were not highly expressed in PGs and the orange circles show the Bm orthologues that were highly expressed in PGs (see Additional file 3: Table S3, Additional file 15: Table S14 and Additional file 16: Table S15). The sum of blue and orange circles for each group is the number of Bm genes orthologous to the Dm genes shown in the green circles (see Additional file 9: Table S8). Circles are proportional to each other for each phenotype described in [32]
Fig. 3
Fig. 3
Bombyx mori adenylate cyclases and 3′, 5′ cyclic nucleotide phosphodiesterases. a: Expression profile heat maps of Bm ACs-encoding genes during the final larval instar and the first day of the pupal stage. Abbreviations: V-0 to V-8: Days of the 5th Instar; P-0: First day of the pupal stage. b: Posterior probability tree of Bm and Dm AC proteins. Bombyx mori soluble guanylate cyclase (BmGCY) was used as an outgroup. Asterisks indicate the ACs that are expressed in Dm RGs based on RNA-seq data [31]. Numbers indicate the posterior probability score (%). c: Expression profile heat maps of Bm PDE-encoding genes during the final larval instar and the first day of the pupal stage. Abbreviations: V-0 to V-8: Days of the 5th Instar; P-0: First day of the pupal stage. d: Posterior probability tree of Bm and Dm PDEs. Dm phosphodiesterase 9 (CG32648) was used as an outgroup. Asterisks indicate the phoshodiesterases that are expressed in Dm RGs based on RNA-seq data [31]. Numbers indicate the posterior probability score (%). e: Effects of IBMX and Ionomycin on cAMP levels of PGs during the final larval instar and the first day of the pupal stage. Results are expressed as Mean ± SEM, n = 4–5. f: Effects of forskolin on cAMP levels of PGs during the final larval instar and the first day of the pupal stage. Results are expressed as Mean ± SEM, n = 4–5. g: Graphical representation of the cAMP signalling dynamics in Bm PGs. Transcript levels of BmAC1L (green circles) and BmPDE4L (red circles) were normalised against the peak value of each as 100% (V-4 for BmAC1L and V-7 for BmPDE4L). Dotted line indicates the ratio of normalised BmAC1L values/normalised BmPDE4L values. Results are expressed as Mean ± SEM, n = 4–6
Fig. 4
Fig. 4
Bombyx mori protein kinases C and phosphoinositide phospholipases C (including phosphoinositide phospholipases C X domain containing proteins (PI-PLC X dcp)). a: Expression profile heat maps of Bm PKCs, PKN and PKD genes during the final larval instar and the first day of the pupal stage. Abbreviations: V-0 to V-8: Days of the 5th Instar; P-0: First day of the pupal stage. b: Posterior probability tree of Bm and Dm PKCs, PKN and PKD proteins. Dm PKD (CG7125) was used as an outgroup. Asterisks indicate the PKCs, PKN and PKD proteins that are expressed in Dm ring glands based on RNA-seq data [31]. Numbers indicate the posterior probability score (%). c: Expression profile heat maps of Bombyx mori PLCs and PI-PLC X dcp genes during the final larval instar and the first day of the pupal stage. Abbreviations: V-0 to V-8: Days of the 5th Instar; P-0: First day of the pupal stage. d: Posterior probability tree of Bm and Dm PLCs and PI-PLC X domain-containing proteins. Dm glycerophosphodiester phosphodiesterase domain-containing protein (CG18135) was used as an outgroup. Asterisks indicate the PLCs and PI-PLC X dcps that are expressed in Dm RGs based on RNA-seq data [31]. Numbers indicate the posterior probability score (%)
Fig. 5
Fig. 5
Expression profile heat maps of 82 CYP genes and 15 ecdysteroidogenesis-related genes during the final larval instar and the first day of the pupal stage. Abbreviations: V-0 to V-8: Days of the 5th Instar; P-0: First day of the pupal stage; Bm: Bombyx mori; EO: Ecdysone Oxidase; 3DE-3α-Red.: 3-DehydroEcdysone-3α-Reductase; AKR2E4: Aldo-Keto Reductase 2E4; BmE: Bombyx mori Ecdysone. Nomenclature of CYP genes is based on [70]
Fig. 6
Fig. 6
Comparison of expression dynamics of gene groups involved in ecdysteroidogenesis in Drosophila melanogaster and Bombyx mori. a: Circos plot comparing the expression of ACs, PDEs, PKCs and PLCs during the wandering stage of Dm [31] and V-6 of the 5th instar of Bm. Percentage values are related to FPKM values. See Additional file 17: Table S16 for details. b: Circos plot comparing the FPKM values of genes involved in Dm ecdysteroidogenesis, as presented in [31], with the RPGM values for the orthologous genes of Bm. Percentage values are related to FPKM (Dm) and RPGM (Bm) values as shown in [28, 31]. See Additional file 9: Table S8 for details

References

    1. Miller WL, Auchus RJ. The molecular biology, biochemistry, and physiology of human steroidogenesis and its disorders. Endocr Rev. 2011;32(1):81–151. doi: 10.1210/er.2010-0013. - DOI - PMC - PubMed
    1. Lafont R, Dauphin-Villemant C, Warren JT, Rees HH. Ecdysteroid chemistry and biochemistry. In: Reference Module in Life Sciences: Elsevier; 2017.
    1. Butcher RA. Small-molecule pheromones and hormones controlling nematode development. Nat Chem Biol. 2017;13(6):577–586. doi: 10.1038/nchembio.2356. - DOI - PMC - PubMed
    1. Ou Q, Zeng J, Yamanaka N, Brakken-Thal C, O’Connor MB, King-Jones K. The insect prothoracic gland as a model for steroid hormone biosynthesis and regulation. Cell Rep. 2016;16(1):247–262. doi: 10.1016/j.celrep.2016.05.053. - DOI - PMC - PubMed
    1. Lavrynenko O, Rodenfels J, Carvalho M, Dye NA, Lafont R, Eaton S, Shevchenko A. The ecdysteroidome of Drosophila: influence of diet and development. Development. 2015;142(21):3758–3768. doi: 10.1242/dev.124982. - DOI - PubMed

LinkOut - more resources