. 2018 Jul 17;49(1):120-133.e9.
doi: 10.1016/j.immuni.2018.06.007. Epub 2018 Jul 10.

LAG-3 Inhibitory Receptor Expression Identifies Immunosuppressive Natural Regulatory Plasma Cells

Affiliations

LAG-3 Inhibitory Receptor Expression Identifies Immunosuppressive Natural Regulatory Plasma Cells

Andreia C Lino et al. Immunity. .

Abstract

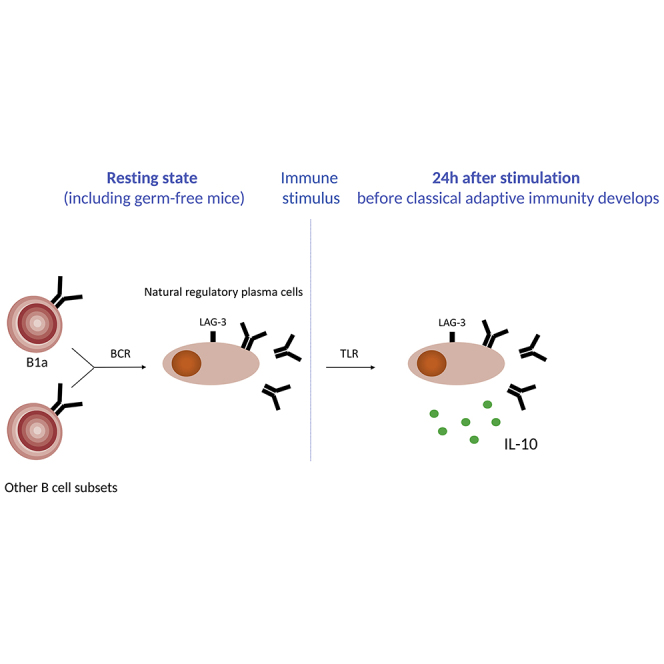
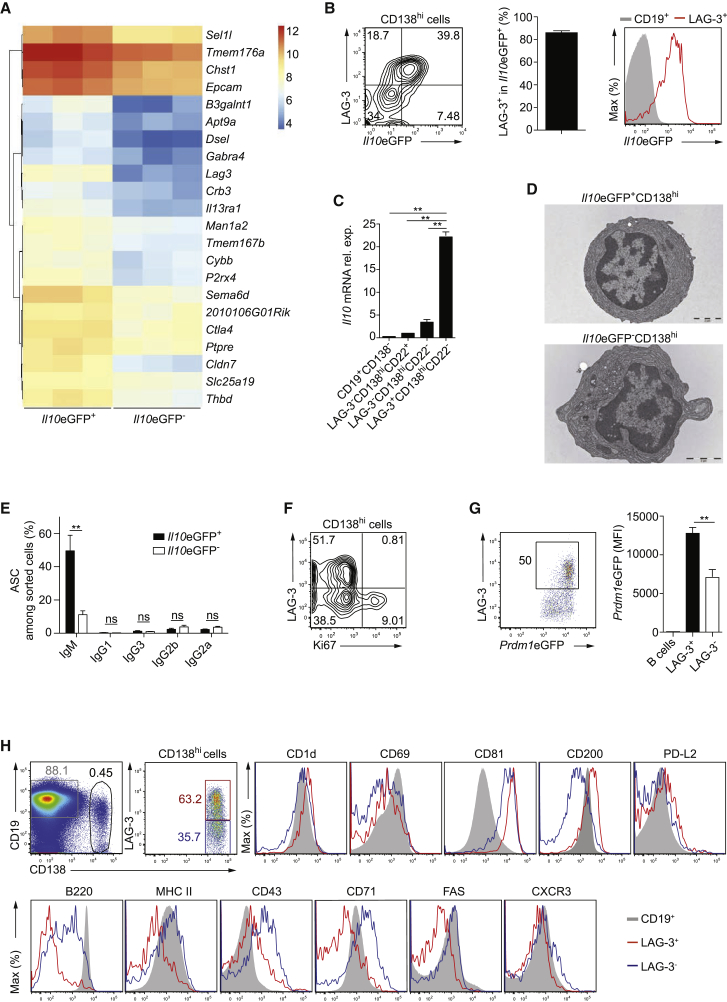
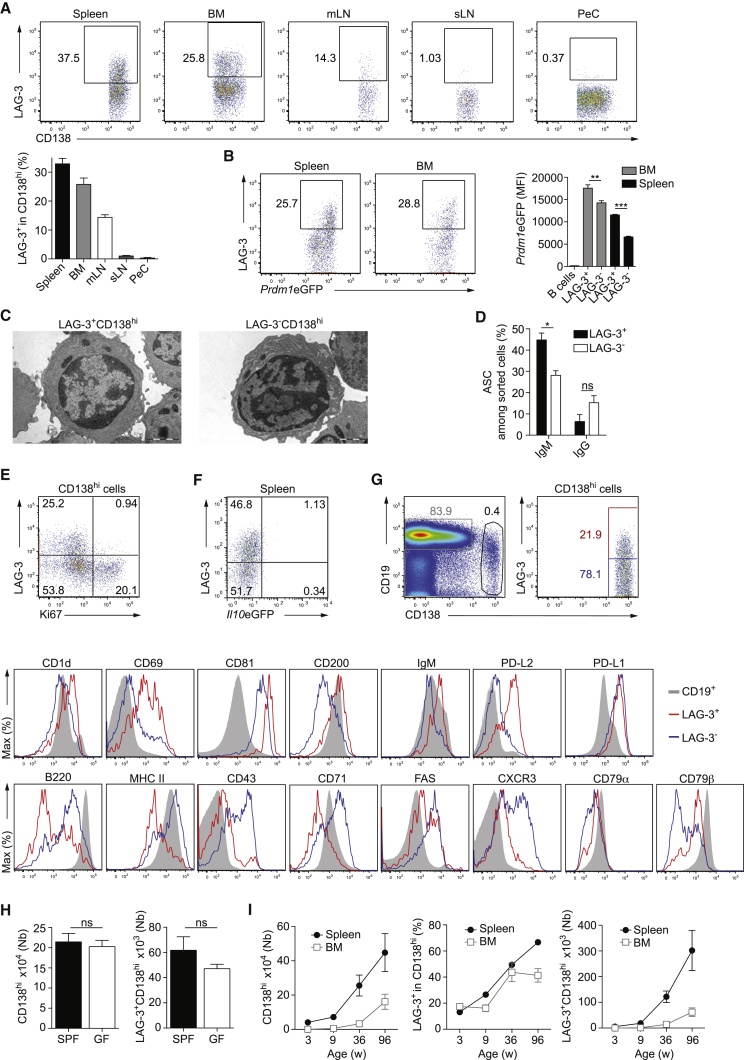
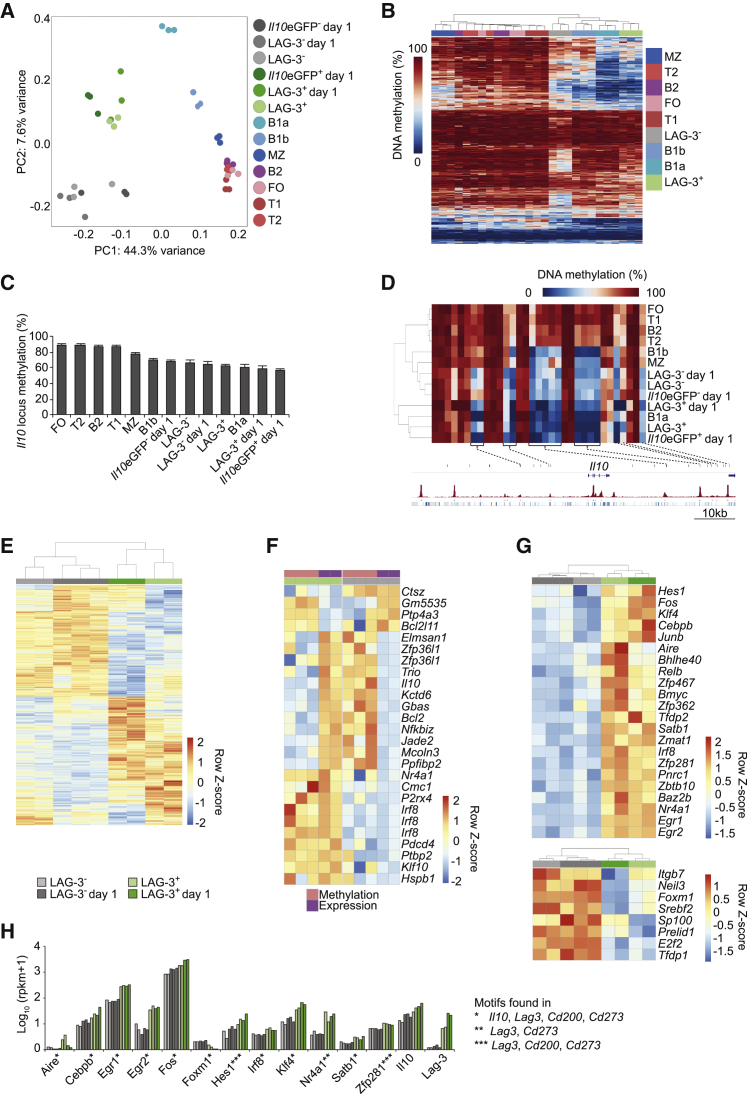
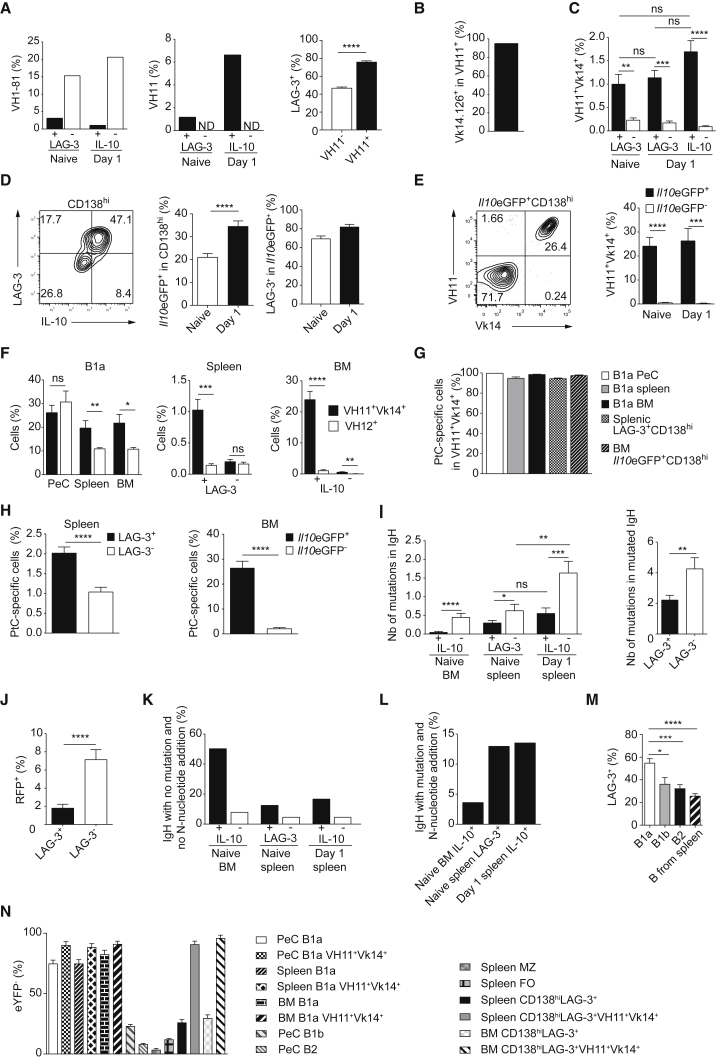
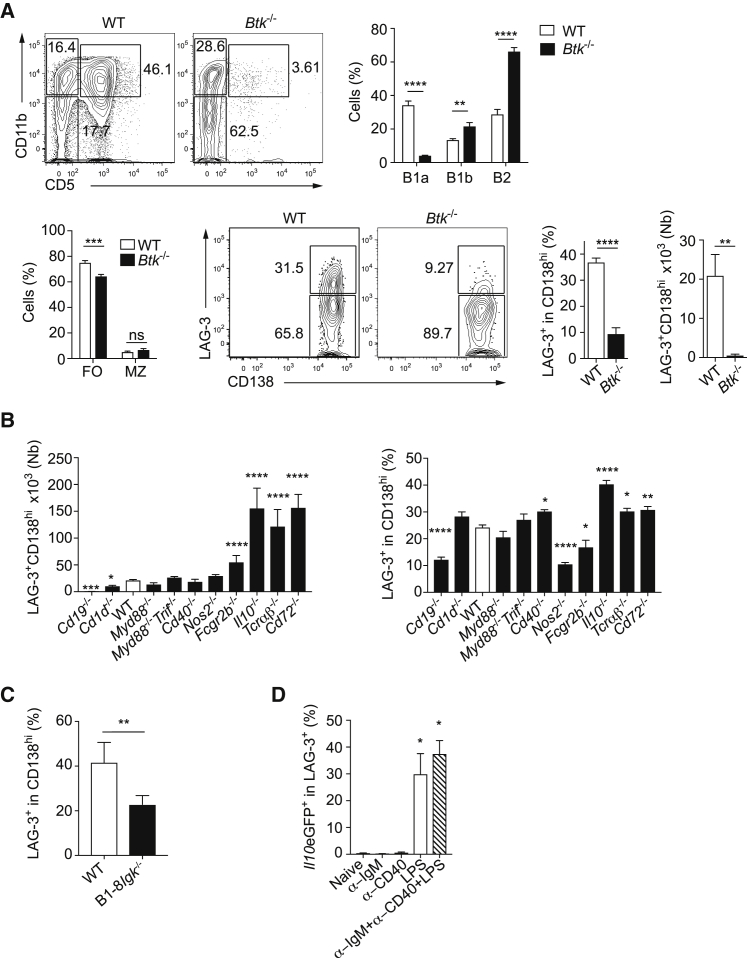
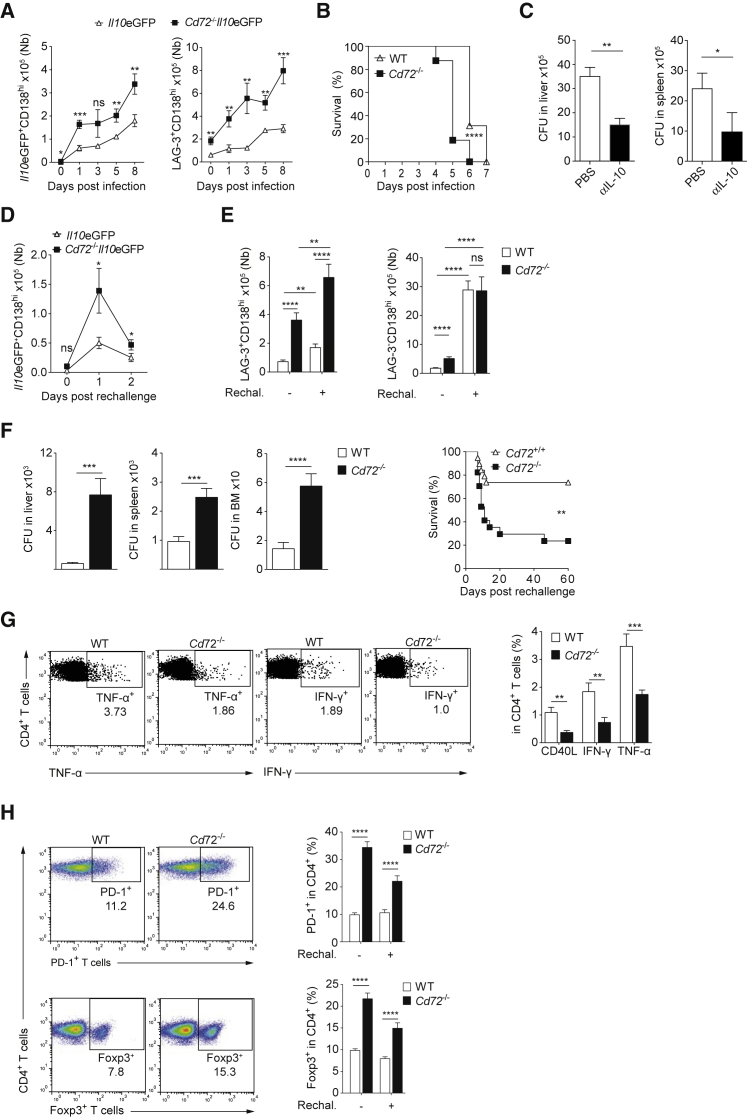
B lymphocytes can suppress immunity through interleukin (IL)-10 production in infectious, autoimmune, and malignant diseases. Here, we have identified a natural plasma cell subset that distinctively expresses the inhibitory receptor LAG-3 and mediates this function in vivo. These plasma cells also express the inhibitory receptors CD200, PD-L1, and PD-L2. They develop from various B cell subsets in a B cell receptor (BCR)-dependent manner independently of microbiota in naive mice. After challenge they upregulate IL-10 expression via a Toll-like receptor-driven mechanism within hours and without proliferating. This function is associated with a unique transcriptome and epigenome, including the lowest amount of DNA methylation at the Il10 locus compared to other B cell subsets. Their augmented accumulation in naive mutant mice with increased BCR signaling correlates with the inhibition of memory T cell formation and vaccine efficacy after challenge. These natural regulatory plasma cells may be of broad relevance for disease intervention.

Keywords: B cells; BCR; CD72; LAG-3; TLR; checkpoint receptor; immune regulation; infection; interleukin-10; natural regulatory plasma cell; plasma cells.


Figures

None
Graphical abstract
Figure 1
Figure 1
LAG-3 Identifies IL-10-Producing Plasma Cells in Infected Mice Mice were infected i.v. with Salmonella (SL7207, 107 CFU), and plasmocytes characterized in spleen on day 1 p.i. (A) mRNA amounts for receptors overexpressed in IL-10+ compared with IL-10 plasmocytes from Il10eGFP mice. Microarrays in triplicate. Expression amounts normalized using GCRMA are shown (Log2 transformed). Lag3 is expressed 9.4-fold higher in Il10eGFP+CD138hi than Il10eGFPCD138hi cells. (B) Flow cytometry plots showing IL-10 and LAG-3 expression in CD138hi cells (left); frequency of LAG-3+ in IL-10+CD138hi cells (middle); expression of IL-10 in B cells (CD19+CD138) and LAG-3+CD138hi cells (right). Representative of six experiments. (C) Il10 mRNA expression in isolated subsets from C57BL/6 mice. Pool of two experiments. (D) Transmission electron microscopy images of plasmocytes from Il10eGFP mice. Scale bar is 2 μM. (E) Frequencies of antibody-secreting cells (ASCs) in IL-10+CD138hi and IL-10CD138hi cells from Il10eGFP mice by ELISPOT. Pool of three experiments. (F) Flow cytometry plots of LAG-3 and Ki67 expression in CD138hi cells from C57BL/6 mice. Representative of four experiments. (G) Flow cytometry plot of LAG-3 and BLIMP-1 in BLIMP-1+CD138hi cells (left), and amounts of BLIMP-1 (MFI) in B cells and plasmocytes in Prdm1eGFP mice (n = 4) (right). Representative of two experiments. (H) Surface molecules expression on LAG-3+CD138hi (red), LAG-3CD138hi (blue), and CD19+CD138 B cells (gray) from C57BL/6 mice. Representative of two experiments. Data show mean ± SEM (nsp > 0.05, ∗∗p < 0.01). See also Figure S1.
Figure 2
Figure 2
LAG-3+CD138hi Plasma Cells Are Present in Naive Mice Analyses performed in spleen (except when indicated) of naive mice. (A) Flow cytometry plots of LAG-3 on CD138+/hi cells (top) and frequencies in spleen (n = 23), BM (n = 19), mLN (n = 10), subcutaneous LN (sLN) (n = 10), and PeC (n = 10) (bottom) of C57BL/6 mice. (B) Flow cytometry plots of LAG-3 and BLIMP-1 in BLIMP-1+CD138hi cells (left), and amounts of BLIMP-1 (MFI) in B cells and plasmocytes in Prdm1eGFP mice (n = 4) (right). Representative of three experiments. (C) Electron microscopy images of plasmocytes from C57BL/6 mice. Scale bar is 2 μM. (D) ASCs in plasmocytes from C57BL/6 mice by ELISPOT. Pool of two experiments. (E) Flow cytometry plot of LAG-3 and Ki67 in CD138hi cells from C57BL/6 mice. Representative of four experiments. (F) Flow cytometry plot of LAG-3 and IL-10 in CD138hi cells. Representative of six experiments. (G) Expression of indicated molecules on cells from C57BL/6 mice. Representative of 3–4 experiments. (H) Numbers of plasmocytes in SPF (n = 8) and GF (n = 8) C3H/HeOuJ mice. (I) Numbers and frequencies of plasmocytes in C57BL/6 mice of indicated ages (n = 6/age, pool of 2 experiments). Data show mean ± SEM (nsp > 0.05, p < 0.05, ∗∗p < 0.01; ∗∗∗p < 0.001). See also Figure S2.
Figure 3
Figure 3
LAG-3+CD138hi Cells Upregulate IL-10 Expression upon Infection Analyses performed in spleen p.i. (SL7207, 107 CFU) or with naive mice. (A) Kinetics of IL-10 expression in CD138hi cells (left), frequency of LAG-3+ in IL-10+CD138hi cells (middle), numbers of LAG-3+IL-10+CD138hi (LAG-3+) and LAG-3IL-10+CD138hi (LAG-3) cells (right) p.i. in Il10eGFP mice. Pool of two experiments (n = 6/time point). (B) Numbers of LAG-3+CD138hi cells in C57BL/6 mice. Pool of four experiments (n = 11/time point). (C) Isolated cells from naive C57BL/6 mice were stimulated in vitro for 18 hr, and IL-10 measured in supernatants. LAG-3+CD138hi and LAG-3CD138hi cells indicated as LAG-3+ and LAG-3, respectively. Pool of five experiments. (D) Numbers of CD138hi and LAG-3CD138hi cells (left), LAG-3+IL-10+CD138hi cells (middle), frequency of LAG-3+ (red line) or IL-10+ (green line) cells in CD138hi cells (right) p.i. in Il10eGFP mice. Pool of 4 experiments; at least 12 mice per group. (E) Numbers of IL-10+CD138hi and IL-10CD138hi cells at day 3 p.i. in B-Il10eGFP and B-Lag3−/−Il10eGFP chimeric mice. (F) Il10eGFP mice were vaccinated and challenged 90 days later (vaccinated), along with age-matched naive Il10eGFP mice (challenged). Frequencies of LAG-3+ in CD138hi cells (left), and of IL-10+ in CD138hi cells (right). Pool of two experiments; at least six mice per group. (G) Il10eGFP mice treated as in (F) and analyzed at day 1 and 2 post-re-challenge. Flow cytometry plots show LAG-3 and CD138 on IL-10+CD138hi cells (right, day 1) with quantifications (left). Pool of two experiments; at least six mice per group. (H) Il10eGFP mice were treated as in (F). Frequency of ASC in indicated plasmocytes on day 1 post-re-challenge by ELISPOT. Pool of two experiments; at least six mice per group. Data shown are mean ± SEM (nsp > 0.05, p < 0.05, ∗∗p < 0.01; ∗∗∗p < 0.001). See also Figure S3.
Figure 4
Figure 4
Molecular Characterization of LAG-3+CD138hi Cells (A) Unsupervised PCA of genome-wide DNA methylation data of cells from C57BL/6 mice. (B) Methylation of the CpG found in the 469 DMR distinguishing LAG-3+CD138hi cells and LAG-3CD138hi cells. (C) DNA methylation of Il10 locus (mean ± SEM). (D) Methylation for covered CpG in the Il10 locus. Coverage weighted average methylation of three replicates is represented. The positions of selected CpG are indicated by vertical black bars, with the Il10 gene depicted. ENCODE DNase I data are in red for splenic CD43 B cells. PhastCons Vert30 conservation scores are in blue. (E) mRNA expression for the 3,631 DEGs that distinguish LAG-3+CD138hi and LAG-3CD138hi cells on day 0 and 1 p.i. (see Figure S4F). (F) mRNA expression and local DNA methylation for genes both differentially expressed and methylated between LAG-3+CD138hi and LAG-3CD138hi cells from naive mice. (G) Transcription regulators expressed at higher (top) or lower (bottom) amounts on both day 0 and 1 p.i. in LAG-3+CD138hi compared to LAG-3CD138hi cells. (H) Expression of transcription regulators differentially expressed between LAG-3+CD138hi cells and LAG-3CD138hi cells (see G) with predicted binding motif in either the Il10, Lag3, Cd200, or Cd273 loci. Row z-scores for expression are based on log10(rpkm+1), and for DNA methylation on DNA methylation frequency (%). Samples were from naive mice (A, C, D, E, G, H) except where indicated. See also Figure S4.
Figure 5
Figure 5
BCR Repertoire of LAG-3+ and IL-10+ Plasmocytes (A) Frequency of Igh containing VH1-81 (left) or VH11 (middle) in spleen LAG-3+CD138hi (n = 253), LAG-3CD138hi (n = 150), Il10eGFP+CD138hi (n = 181), and Il10eGFPCD138hi (n = 121) cells on day 0 and day 1 p.i. (SL7207; 107 CFU). Frequency of LAG-3+ in VH11+CD138hi and VH11CD138hi spleen cells of naive mice (n = 12) (right). (B) Frequency of Vk14.126+ cells in VH11+ cells for spleen and BM cells described in Figure S5A. (C) Frequency of VH11+Vk14.126+ cells by flow cytometry. Pool of two experiments (6–7 mice/group/time point). (D) Flow cytometry plot of LAG-3 versus Il10eGFP in CD138hi BM cells at day 1, and quantifications. Pool of four experiments (n = 12–17/time point). (E) Flow cytometry plot and frequency of VH11+Vk14.126+ cells in IL-10+CD138hi cells in BM of Il10eGFP mice. Pool of two experiments (n = 6–7/time point). (F) Frequency of VH11+Vk14.126+ and VH12+ cells in B1a cells from indicated tissues (left), spleen LAG-3+ and LAG-3 (middle), and BM IL-10+ and IL-10 (right) plasmocytes from naive mice. Pool of two experiments (n = 7). (G) Frequency of PtC-reactive cells in VH11+Vk14.126+ cells for indicated cells from naive mice. Pool of two experiments (n = 7). (H) Frequency of PtC-reactive cells in indicated plasmocytes from naive mice. Pool of four experiments (n = 12). (I) Mutations in IgH sequences (naive BM Il10eGFP+CD138hi, n = 165; Il10eGFPCD138hi, n = 151; naive spleen LAG-3+CD138hi, n = 231; LAG-3CD138hi, n = 129; day 1 spleen Il10eGFP+CD138hi, n = 155; Il10eGFPCD138hi, n = 108) (left). Number of somatic mutations per sequence for mutated IgH (LAG-3+CD138hi cells, n = 31; LAG-3CD138hi cells, n = 19) (right). (J) Aicda-cre-ERT2-ROSA-STOP-RFP mice were treated with tamoxifen and analyzed 15 days after the last treatment. Frequency of RFP+ cells in LAG-3+CD138hi and LAG-3CD138hi spleen cells. Pool of five experiments (n = 14). (K) Frequency of IgH sequences (as in I) having no mutation and no N-nucleotide addition. (L) Frequency of IgH sequences (as in I) with mutation and N-nucleotide addition. (M) Frequency of LAG-3+ in spleen CD138hi cells 3 weeks after transfer of indicated cell fractions into Rag2−/− mice. Pool of three experiments (n = 6–7/group). (N) Frequency of eYFP cells in indicated cells of naive Cd21-cre-ROSA-STOP-eYFP mice. Pool of three experiments (n = 6). Groups were compared using two-tailed unpaired t test with Welch’s correction in case of inequal variances (C–I) or using Mann-Whitney test (M). Data are mean ± SEM (nsp > 0.05, p < 0.05, ∗∗p < 0.01; ∗∗∗p < 0.001, ∗∗∗∗p < 0.0001). See also Figure S5.
Figure 6
Figure 6
Molecules Implicated in the Homeostasis of LAG-3+CD138hi Cells (A) Flow cytometry plots and quantification of indicated cells in PeC (top) and spleen (bottom) of naive Btk−/− mice and littermate controls. Pool of two experiments (n = 6). (B) Numbers and frequencies of LAG-3+CD138hi cells in CD138hi plasmocytes in spleen of naive C57BL/6 (n = 40), Cd19−/− (n = 5), Il10−/− (n = 8), Tcrab−/− (n = 7), Cd72−/− (n = 10), Cd1d−/− (n = 6), Myd88−/− (n = 10), Myd88−/−Trif−/− (n = 12), Cd40−/− (n = 6), Nos2−/− (n = 10), and Fcgr2b−/− (n = 5) mice. (C) Frequencies of LAG-3+ in spleen CD138hi cells of B1-8iIgk−/− and WT mice. Pool of two experiments (n = 4–5). (D) Frequency of IL-10 in spleen LAG-3+CD138hi of Il10eGFP mice 24 hr after i.v. injection of indicated reagents. Pool of three experiments (n = 6). Data show mean ± SEM (nsp > 0.05, p < 0.05, ∗∗p < 0.01; ∗∗∗p < 0.001, ∗∗∗∗p < 0.0001). See also Figure S6.
Figure 7
Figure 7
CD72 Deficiency Enhances Susceptibility to Salmonella (A) Numbers of indicated spleen cells in Il10eGFP and Cd72−/−Il10eGFP mice p.i. (SL7207, 107 CFU). Pool of three experiments (n = 9–12/time point/group). (B) Survival of Cd72−/− (n = 16) and controls (n = 16) after infection (SL1344, 100 CFU). Pool of two experiments. (C) CFU on day 3 p.i. (SL7207, 107 CFU) of anti-IL10 plus anti-IL10R-treated and control Cd72−/− mice. Pool of two experiments (n = 6–10/group). (D) Mice were vaccinated (SL7207, 106 CFU) and re-challenged on day 90 (SL7207, 107 CFU). Numbers of cells in spleen after re-challenge. Pool of three experiments (n = 9/group/time point). (E) Mice were vaccinated (SL7207, 106 CFU), rechallenged on day 90 (SL7207, 106 CFU), and analyzed 5 days later with (+) or without (−) rechallenge. Pool of four experiments (n = 15–18/group/time point). (F) CFU on day 5 post-re-challenge for mice shown in (E) (left). Survival of Cd72−/− (n = 17) and littermate control (n = 19) mice vaccinated (SL7207, 106 CFU) and re-challenged 90 days later (SL1344, 100 CFU). Pool of two experiments (right). (G) Cd72−/− and WT mice were vaccinated (SL7207, 106 CFU), and BM analyzed on day 90. Flow cytometry plot (left) and quantifications (right) for CD40L, TNF-α, and IFN-γ expression in Salmonella-reactive memory CD4+ T cells. Pool of three experiments (n = 12). (H) Flow cytometry plots showing PD-1 and FOXP-3 in spleen CD4+ T cells of mice treated as in (E) and analyzed on day 0 and 5 post-rechallenge. Pool of three experiments (n = 12/group). Groups were compared using two-tailed unpaired t test (nsp > 0.05, p < 0.05, ∗∗p < 0.01; ∗∗∗p < 0.001, ∗∗∗∗p < 0.0001). Survival curves were compared using Wilcoxon test, ∗∗p < 0.01, ∗∗∗∗p < 0.0001. Data show mean ± SEM. See also Figure S7.

Comment in

  • Natural regulatory plasma cells.
    Flemming A. Flemming A. Nat Rev Immunol. 2018 Sep;18(9):540-541. doi: 10.1038/s41577-018-0057-8. Nat Rev Immunol. 2018. PMID: 30108318 No abstract available.

References

    1. Akalin A., Kormaksson M., Li S., Garrett-Bakelman F.E., Figueroa M.E., Melnick A., Mason C.E. methylKit: a comprehensive R package for the analysis of genome-wide DNA methylation profiles. Genome Biol. 2012;13:R87. - PMC - PubMed
    1. Baker D.J., Childs B.G., Durik M., Wijers M.E., Sieben C.J., Zhong J., Saltness R.A., Jeganathan K.B., Verzosa G.C., Pezeshki A. Naturally occurring p16(Ink4a)-positive cells shorten healthy lifespan. Nature. 2016;530:184–189. - PMC - PubMed
    1. Blair P.A., Chavez-Rueda K.A., Evans J.G., Shlomchik M.J., Eddaoudi A., Isenberg D.A., Ehrenstein M.R., Mauri C. Selective targeting of B cells with agonistic anti-CD40 is an efficacious strategy for the generation of induced regulatory T2-like B cells and for the suppression of lupus in MRL/lpr mice. J. Immunol. 2009;182:3492–3502. - PMC - PubMed
    1. Butler N.S., Moebius J., Pewe L.L., Traore B., Doumbo O.K., Tygrett L.T., Waldschmidt T.J., Crompton P.D., Harty J.T. Therapeutic blockade of PD-L1 and LAG-3 rapidly clears established blood-stage Plasmodium infection. Nat. Immunol. 2011;13:188–195. - PMC - PubMed
    1. Chen X., Müller G.A., Quaas M., Fischer M., Han N., Stutchbury B., Sharrocks A.D., Engeland K. The forkhead transcription factor FOXM1 controls cell cycle-dependent gene expression through an atypical chromatin binding mechanism. Mol. Cell. Biol. 2013;33:227–236. - PMC - PubMed

Publication types

MeSH terms