. 2018 Nov;69(5):1123-1135.
doi: 10.1016/j.jhep.2018.06.027. Epub 2018 Jul 11.

Identification of a xenobiotic as a potential environmental trigger in primary biliary cholangitis

Affiliations

Identification of a xenobiotic as a potential environmental trigger in primary biliary cholangitis

Philip M Probert et al. J Hepatol. 2018 Nov.

Abstract

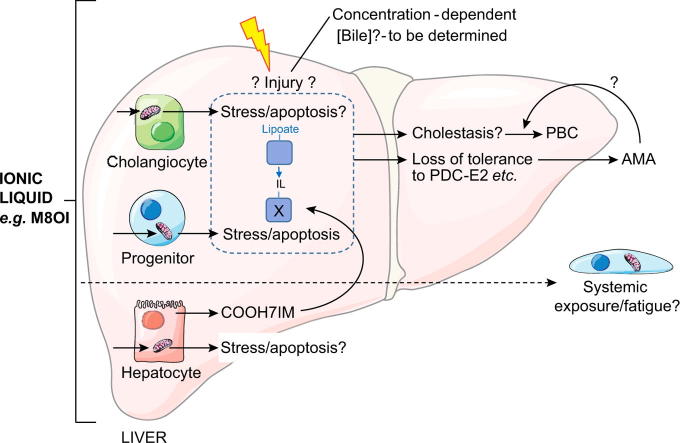
Background & aims: Primary biliary cholangitis (PBC) is an autoimmune-associated chronic liver disease triggered by environmental factors, such as exposure to xenobiotics, which leads to a loss of tolerance to the lipoic acid-conjugated regions of the mitochondrial pyruvate dehydrogenase complex, typically to the E2 component. We aimed to identify xenobiotics that might be involved in the environmental triggering of PBC.

Methods: Urban landfill and control soil samples from a region with high PBC incidence were screened for xenobiotic activities using analytical, cell-based xenobiotic receptor activation assays and toxicity screens.

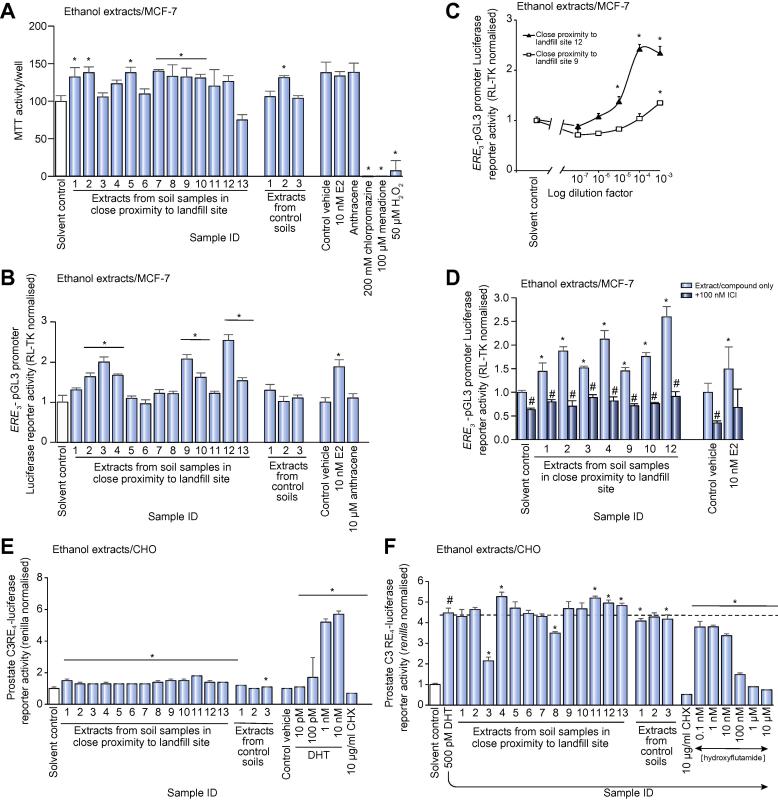
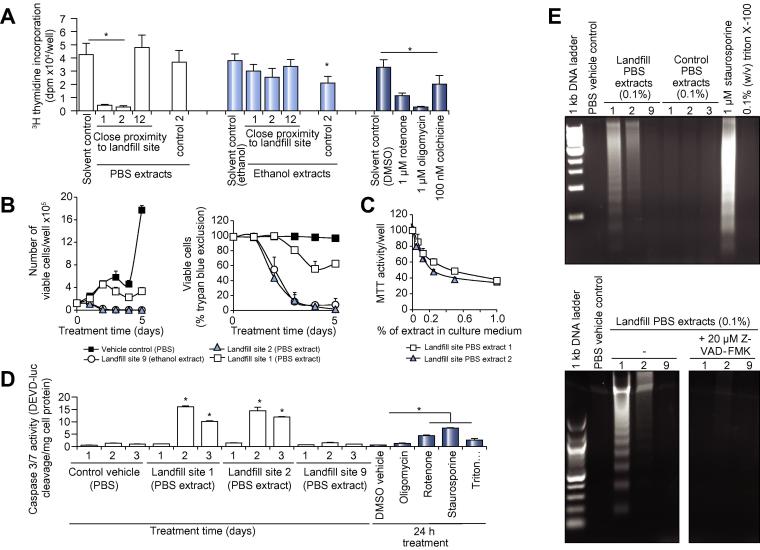
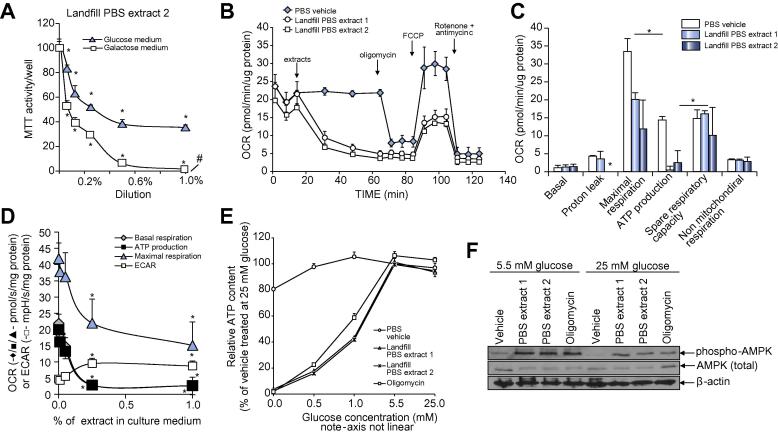
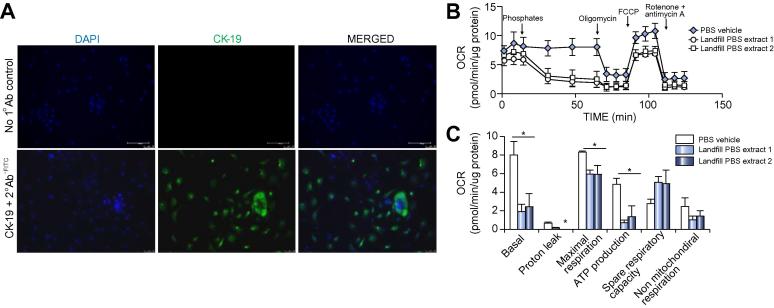
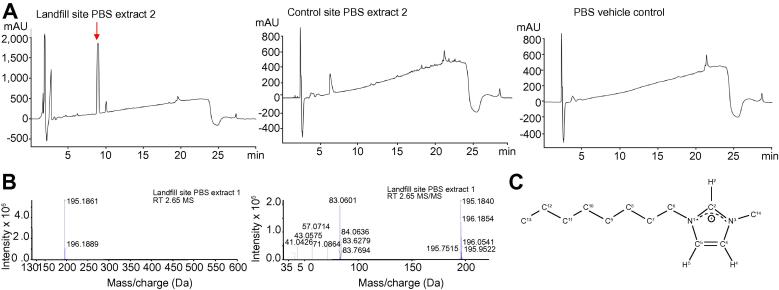
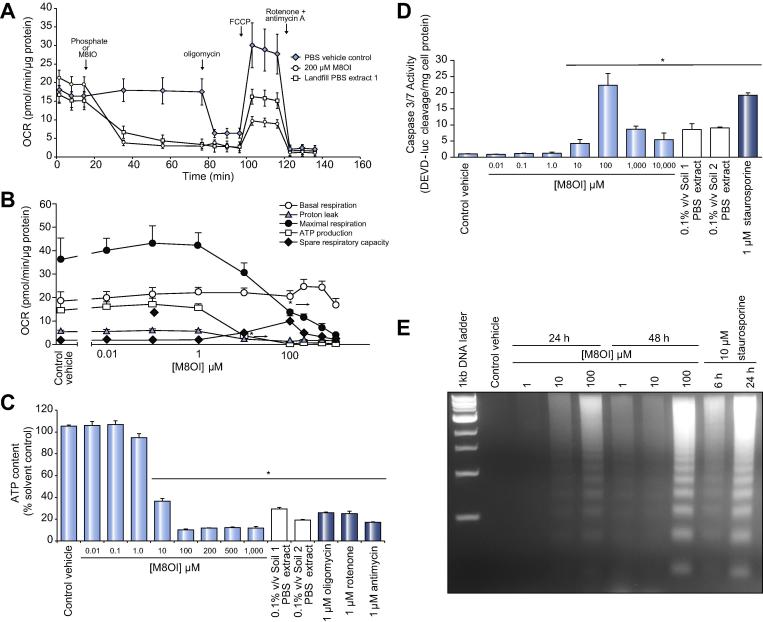
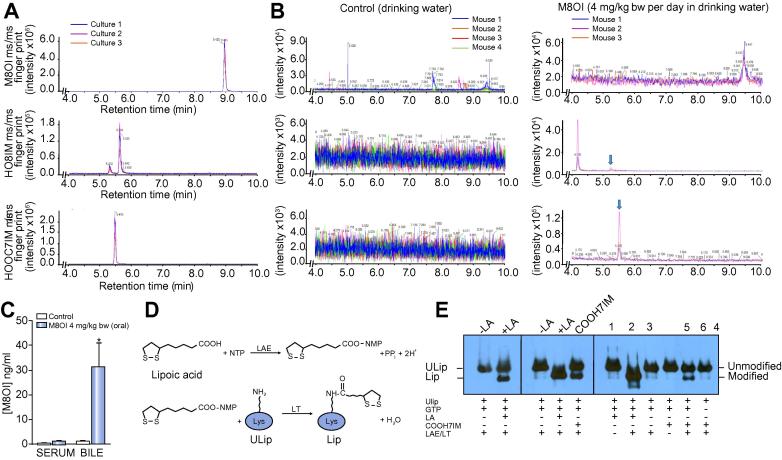
Results: A variety of potential xenobiotic classes were ubiquitously present, as identified by their interaction with xenobiotic receptors - aryl hydrocarbon receptor, androgen receptor and peroxisome proliferator activated receptor alpha - in cell-based screens. In contrast, xenoestrogens were present at higher levels in soil extracts from around an urban landfill. Furthermore, two landfill sampling sites contained a chemical(s) that inhibited mitochondrial oxidative phosphorylation and induced the apoptosis of a hepatic progenitor cell. The mitochondrial effect was also demonstrated in human liver cholangiocytes from three separate donors. The chemical was identified as the ionic liquid [3-methyl-1-octyl-1H-imidazol-3-ium]+ (M8OI) and the toxic effects were recapitulated using authentic pure chemical. A carboxylate-containing human hepatocyte metabolite of M8OI, bearing structural similarity to lipoic acid, was also enzymatically incorporated into the E2 component of the pyruvate dehydrogenase complex via the exogenous lipoylation pathway in vitro.

Conclusions: These results identify, for the first time, a xenobiotic in the environment that may be related to and/or be a component of an environmental trigger for PBC. Therefore, further study in experimental animal models is warranted, to determine the risk of exposure to these ionic liquids.

Lay summary: Primary biliary cholangitis is a liver disease in which most patients have antibodies to mitochondrial proteins containing lipoic acid binding site(s). This paper identified a man-made chemical present in soils around a waste site. It was then shown that this chemical was metabolized into a product with structural similarity to lipoic acid, which was capable of replacing lipoic acid in mitochondrial proteins.

Keywords: AHR; AR42J-B13; B-13; Biliary disease; C8mim; Cholangiocyte; ERα; Ionic solvent; Liver progenitor; Mitochondria; PPARα.


Figures

None
Graphical abstract
Fig. 1
Fig. 1
Soil samples in close proximity to a landfill site contain biologically active levels of ERα activating chemicals. (A) Determination of MTT reduction in MCF-7 cells following 24 h incubation with 0.1% v/v ethanol extracts. Results are expressed as the mean and SD of three separate determinations and are expressed as a percentage of 0.1% (v/v) ethanol vehicle. (B) Human ERα activation (ERE3-pGL3 promoter-Luc). MCF-7 cells were transfected with reporter constructs and 24 h later, treated with 0.1% v/v of the ethanol extracts. After 24 h exposure, reporter gene activities were determined as outlined in the methods section with data, the mean and SD of three separate transfections. (C) Dose-response effect for human ERα activation (ERE3-pGL3 promoter-Luc) in MCF-7 cells treated with the indicated dilution of landfill waste site soil ethanol extract, expressed as fold ethanol vehicle control. Data are the mean and SD of three separate determinations. (D) Human ERα activation (ERE3-pGL3 promoter-Luc). MCF-7 cells were transfected with reporter constructs and 18 h later, pre-treated where indicated with the ERα antagonist ICI182780) or solvent vehicle control. After 6 h, cells were then treated with 0.1% (v/v) of the indicated ethanol extracts. After 24 h exposure, reporter gene activities were determined as outlined in the methods section with data, the mean and SD of three separate transfections. *Significantly different from solvent control (for soil extracts) or control vehicle for known chemicals (p < 0.05) using ANOVA/Bonferroni-Holm comparison between groups or #equivalent extract in the absence of ICI (p < 0.05) using Student’s t test (two tailed). (E) Human AR activation (prostate C3 RE4-luciferase) activation by ethanol extracts. Reporter gene activities were determined as outlined in the methods section with data, the mean and SD of at least three separate transfections. *Significantly different from solvent control (for soil extracts) or control vehicle for known chemicals (p < 0.05) using ANOVA/Bonferroni-Holm comparison between groups. (F) Human AR activation (prostate C3 RE4-luciferase) antagonism by ethanol extracts after activation 500 pM DHT. Reporter gene activities were determined as outlined in the methods section with data the mean and SD of at least three separate transfections. Significantly different from #solvent control or *500 pM DHT (p < 0.05) using ANOVA/Bonferroni-Holm comparison between groups. AR, androgren receptor; DHT, dihydrotestosterone; ER, estrogen receptor.
Fig. 2
Fig. 2
Landfill sampling site 1 and 2 PBS extracts inhibit proliferation and induce the apoptosis of the hepatic progenitor B-13 cell. (A) 3H-thymidine uptake in B-13 cells. B-13 cells were pre-treated with the indicated compounds or 1% (v/v) soil extracts for 6 h prior to addition of 3H-thymidine. Following an overnight exposure, 3H-thymidine incorporation was determined. Results are the mean and SD of six separate determinations from the same experiment typical of at least three separate experiments. *Significantly different from respective solvent control (p < 0.05) using ANOVA/Bonferroni-Holm comparison between groups. (B) B-13 cells were treated with the indicated environmental samples at a final concentration of 1% (v/v) for 24 h prior to a medium change. Total number (left panel) and percentage viable cells (right panel) were then determined based on ability to exclude trypan blue. Data are the mean and SD of three separate treatments for the same experiment typical of at least three separate experiments. (C) Dose-response effect of PBS extracts on MTT reduction activity in B-13 cells determined after 24 h exposure. Data are the mean and SD of three separate experiments. *Significantly different from 0%/PBS solvent control (p < 0.05) using ANOVA/Bonferroni-Holm comparison between groups. (D) Caspase 3/7 activity in B-13 cells treated as indicated with environmental samples at 1% (v/v) for 1–3 days or with 1 µM oligomycin, 1 µM rotenone or 1 µM staurosporine for 24 h. Following treatment, an ApoTox-glo triplex assay was used to determine caspase 3/7 activity. Results are expressed relative to the relevant vehicle treated cells and are the mean and SD of three separate determinations from the same experiment typical of at least three separate experiments. *Significantly different from solvent control (PBS) at the equivalent time point or DMSO vehicle control for known chemicals (p < 0.05) using ANOVA/Bonferroni-Holm comparison between groups. (E) B-13 cells were treated with 1% (v/v) extracts for two days prior to genomic DNA isolation and analysis for nucleosomal ladder formation (left panel). B-13 cells were co-treated with the caspase inhibitor Z-VAD-FMK at the time of exposure to PBS extracts as indicated (right panel), nucleosomal ladders are from the same gel imaged and processed identically. PBS, phosphate buffered saline.
Fig. 3
Fig. 3
Landfill site PBS extracts inhibit mitochondrial oxidative phosphorylation in B-13 cells. (A) B-13 cells cultured in normal media (containing 5.5 mM glucose) or in media with the glucose substituted for 5.5 mM galactose for at least two weeks prior to exposure to the indicated landfill PBS extract 2 dilution for 24 h, followed by MTT reduction activity determination. Data are expressed relative to vehicle treated cells and are the mean and SD of three separate treatments from the same experiment typical of at least three separate experiments. Similar results were obtained with landfill PBS extract 1. *Significantly different from 0%/PBS solvent control (p < 0.05) using ANOVA/Bonferroni-Holm comparison between groups. (B) Time course of OCR in B-13 cells treated with the indicated landfill extract. OCR was determined using a Seahorse XF analyzer with the injections of 1% (v/v) PBS extracts, 1 µM oligomycin, 1 µM FCCP, 0.5 µM and 0.5 µM rotenone and antimycin A, respectively, as indicated. Readings were normalized to protein concentration and are the mean and SD of at least four readings from the same experiment, typical of at least three separate experiments. (C) Effect of 1% PBS extracts on the B-13 mitochondrial functions based on seahorse time-course data. Data are the mean and SD of at least four readings from the same experiment, typical of at least three separate experiments. *Significantly different from PBS solvent control (p < 0.05) using ANOVA/Bonferroni-Holm comparison between groups. (D) Dose-response effects of PBS extracts on B-13 mitochondrial function and ECAR. Data are the mean and SD of at least four readings from the same experiment, typical of at least three separate experiments. *Significantly different from 0%/PBS solvent control (p < 0.05) using ANOVA/Bonferroni-Holm comparison between groups. (E) B-13 cells were treated with environmental samples at 1% (v/v) or 1 µM oligomycin for 2 h at the indicated glucose concentration prior to determination of ATP content. Data are expressed relative to vehicle treated cells at 5.5 mM glucose and are the mean and SD of three experiments, typical of at least three separate experiments. (F) B-13 cells were treated with the indicated environmental samples at 1% (v/v) or 1 µM oligomycin in culture medium containing the indicated concentration of glucose for 24 h prior to Western blot analyses for phosphor-AMPK (AMPK phosphorylated at residue Thr172), total AMPK and β-actin. ECAR, extracellular acidification rate; OCR, oxygen consumption rate; PBS, phosphate buffered saline.
Fig. 4
Fig. 4
Landfill site PBS extracts inhibit mitochondrial oxidative phosphorylation in primary human cholangiocytes. (A) immunocytochemistry for the cholangiocyte marker CK-19. DAPI was used to identify cell nuclei. (B) Time-course plot of OCR in primary cultures of human cholangiocytes treated with the indicated landfill extract. OCR was determined using a Seahorse XF analyzer with the injections of 1% (v/v) PBS extracts, 1 µM oligomycin, 1.5 µM FCCP, 0.5 µM and 0.5 µM rotenone and antimycin A, respectively, as indicated. Readings were normalized to protein concentration and are the mean and SD of at least four separate determinations with cells from the same donor, typical of results from cells isolated from three donors. (C) effect of 1% PBS extracts on the human cholangiocyte mitochondrial functions based on seahorse time-course data. Data are the mean and SD of at least four readings from the same experiment, typical of results from three donors. *Significantly different from PBS solvent control (p < 0.05) using ANOVA/Bonferroni-Holm comparison between groups. CK-19, cytokeratin 19; OCR, oxygen consumption rate; PBS, phosphate buffered saline. (This figure appears in colour on the web.)
Fig. 5
Fig. 5
The chemical primarily responsible for the toxic effects associated with landfill PBS extracts 1 and 2 is M8OI. (A) HPLC chromatograms of PBS extracts from the indicated sites with the peak associated with toxicity indicated (by arrow, top panel), toxicity data not included. These data are from pooled fractions collected by preparative HPLC at the retention time associated with toxicity in landfill site PBS extract 2, and therefore partially-purified from soil PBS extracts on the basis of partition into the aqueous PBS phase and preparative HPLC. Control PBS extract 2 (middle panel) is provided as a chromatogram from a PBS extract not displaying any toxic effects in B-13 cells and was typical of other non-toxic PBS extracts from both control and landfill sites. (B) Mass spectrometry (upper panel) and tandem mass spectrometry (lower panel) for peak in panel A associated with toxicity in B-13 cells. (C) Predicted structure of peak in panel A associated with toxicity in B-13 cells, based additionally on NMR data (see Fig. S7A,B). HPLC, high performance liquid chromatography; NMR, nuclear magnetic resonance; PBS, phosphate buffered saline. (This figure appears in colour on the web.)
Fig. 6
Fig. 6
M8OI recapitulates the mitochondrial effects and induces apoptosis in B-13 cells. (A) Time course of OCR in B-13 cells treated with the indicated landfill extract. OCR was determined using a Seahorse XF analyzer with the injections of 1% (v/v) PBS extracts, 1 µM oligomycin, 1 µM FCCP, 0.5 µM and 0.5 µM rotenone and antimycin A respectively as indicated. Readings were normalized to protein concentration and are the mean and SD of at least four readings from the same experiment, typical of at least three separate experiments. (B) Dose-response effects of M8OI on mitochondrial parameters in B-13 cells, *Significantly different OCR from control vehicle at this concentration of M8OI and higher (p < 0.05) using ANOVA/Bonferroni-Holm comparison between groups. (C) Effect of authentic M80I (chloride salt), PBS extracts or other indicated mitochondrial toxins on ATP content in B-13 cells after 2 h exposure. Data are the mean and SD of three separate treatments for the same experiment typical of at least three separate experiments. *Significantly different from PBS control vehicle (p < 0.05) using ANOVA/Bonferroni-Holm comparison between groups. (D) Effect of authentic M80I (chloride salt), PBS extracts or staurosporine on caspase 3/7 activities in B-13 cells after exposure for 2 days. Data are the mean and SD of three separate treatments for the same experiment typical of at least three separate experiments. *Significantly different from PBS control vehicle (p < 0.05) using ANOVA/Bonferroni-Holm comparison between groups. (E) B-13 cells were treated with the indicated concentration of M8OI or staurosporine for the indicated periods prior to genomic DNA isolation and analysis for nucleosomal ladder formation. OCR, oxygen consumption rate; PBS, phosphate buffered saline.
Fig. 7
Fig. 7
M8OI is metabolized to COOH7IM in human hepatocytes and mice and is enzymatically incorporated into an unlipoylated fragment of PDC-E2 in vitro. (A) Liquid chromatography-high resolution tandem mass spectrometry, using a TripleTOF 5600 high-resolution quadrupole time-of-flight mass spectrometer (Sciex), analyses of three separate human hepatocyte cultures incubated with M8OI for 24 h prior to detection of M8OI, HO8IM and COOH7IM. (B) Detection of M8OI in mouse sera orally exposed to control (left panels) or M8OI (right panels) in their drinking water as outlined in the methods section. Position of HO8IM and COOH7IM peaks is indicated by arrows. (C) Mean and standard deviation concentration of M8OI in mouse sera and gall bladder bile in control (three mice) and M8OI exposed mice (five mice). *Significantly different from control bile (p < 0.05) using the Student’s t test (two tailed). (D) Illustration of two-step procedure for incorporation of LA into a ULip. (E) Western blot for the detection of ULip and Lip after addition of LA or COOH7IM, with additions as indicated. LA, lipoic acid; LAE, lipoate activating enzyme; LT, lipoyl-AMP(GMP):N-lysine lipoyl transferase; ULip, unlipoylated fragment of PDC-E2; Lip, lipoylated fragment of PDC-E2. (This figure appears in colour on the web.)

References

    1. Williams R., Aspinall R., Bellis M., Camps-Walsh G., Cramp M., Dhawan A. Addressing liver disease in the UK: a blueprint for attaining excellence in health care and reducing premature mortality from lifestyle issues of excess consumption of alcohol, obesity, and viral hepatitis. Lancet. 2014;384:1953–1997. - PubMed
    1. http://www.bsg.org.uk/clinical/commissioning-report/management-of-patien....
    1. Dyson J.K., Hirschfield G.M., Adams D.H., Beuers U., Mann D.A., Lindor K.D. Novel therapeutic targets in primary biliary cirrhosis. Nat Rev Gastroenterol. Hepatol. 2015;12:147–158. - PubMed
    1. Donaldson P.T., Baragiotta A., Heneghan M.A., Floreani A., Venturi C., Underhill J.A. HLA class II alleles, genotypes, haplotypes and amino acids in primary biliary cirrhosis: a large-scale study. Hepatology. 2006;44:667–674. - PubMed
    1. Mells G.F., Floyd J.A., Morley K.I., Cordell H.J., Franklin C.S., Shin S.Y. Dawwas MF; UK PBC Consortium.; Wellcome Trust Case Control Consortium 3, Jones DE, Peltonen L, Alexander GJ, Sandford RN, Anderson CA. Genome-wide association study identifies 12 new susceptibility loci for primary biliary cirrhosis. Nat Genet. 2011;43:329–332. - PMC - PubMed

MeSH terms