. 2018 Sep 7;293(36):13874-13888.
doi: 10.1074/jbc.RA118.003443. Epub 2018 Jul 13.

Interaction of the α7-nicotinic subunit with its human-specific duplicated dupα7 isoform in mammalian cells: Relevance in human inflammatory responses

Affiliations

Interaction of the α7-nicotinic subunit with its human-specific duplicated dupα7 isoform in mammalian cells: Relevance in human inflammatory responses

María C Maldifassi et al. J Biol Chem. .

Abstract

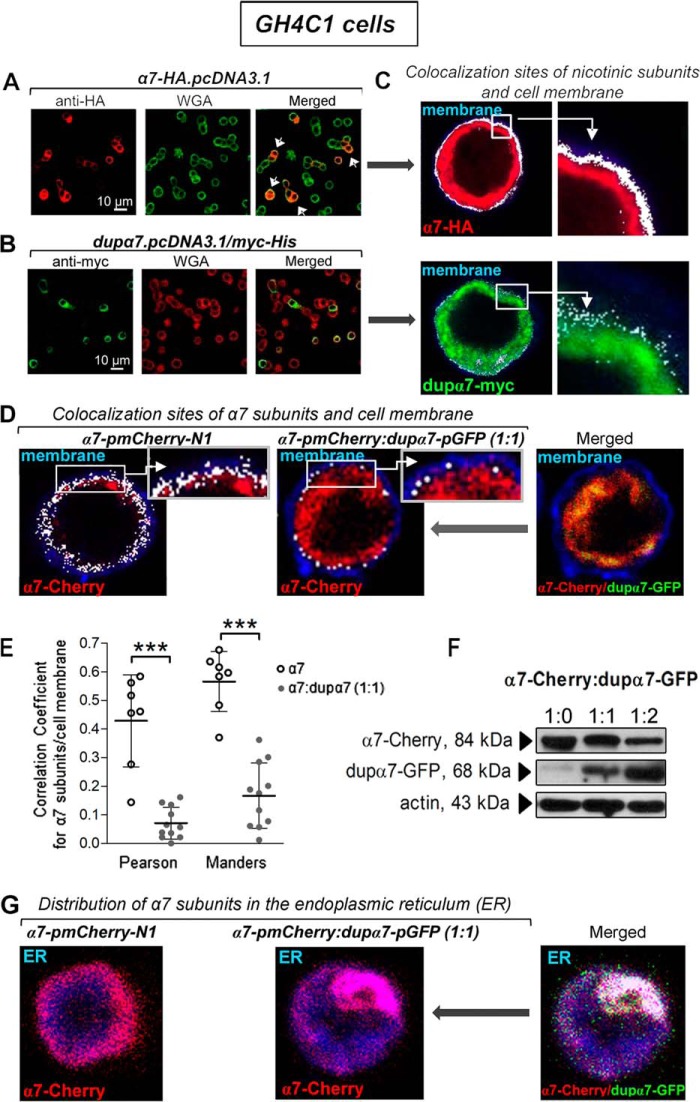
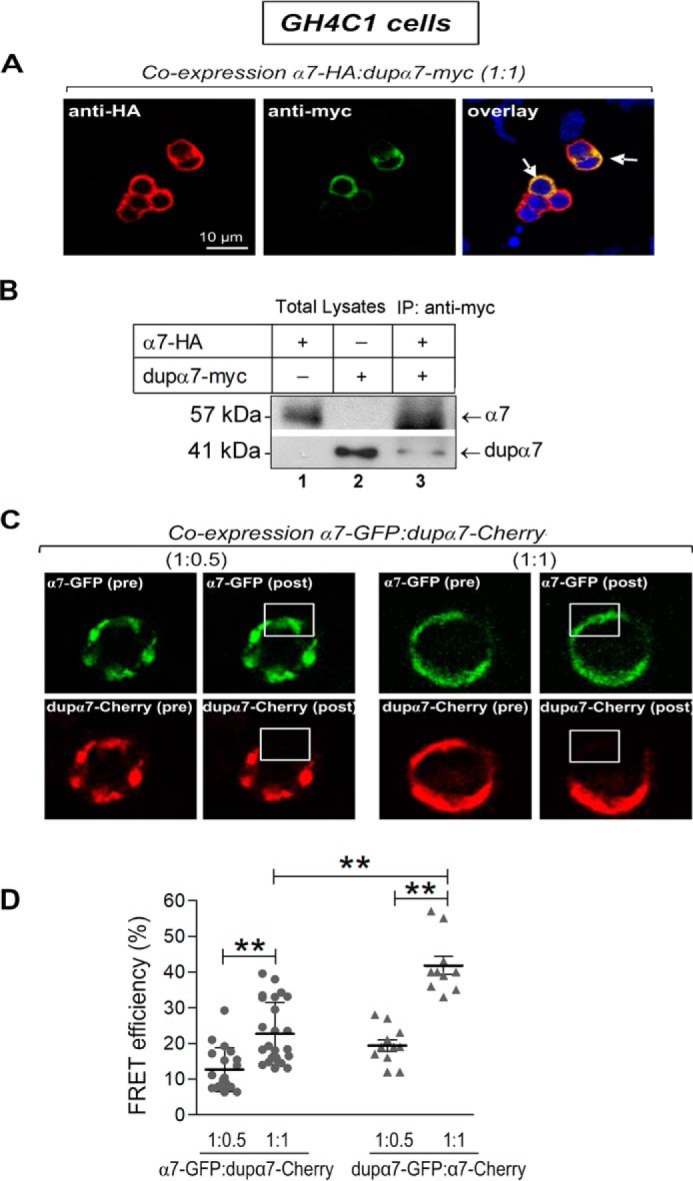
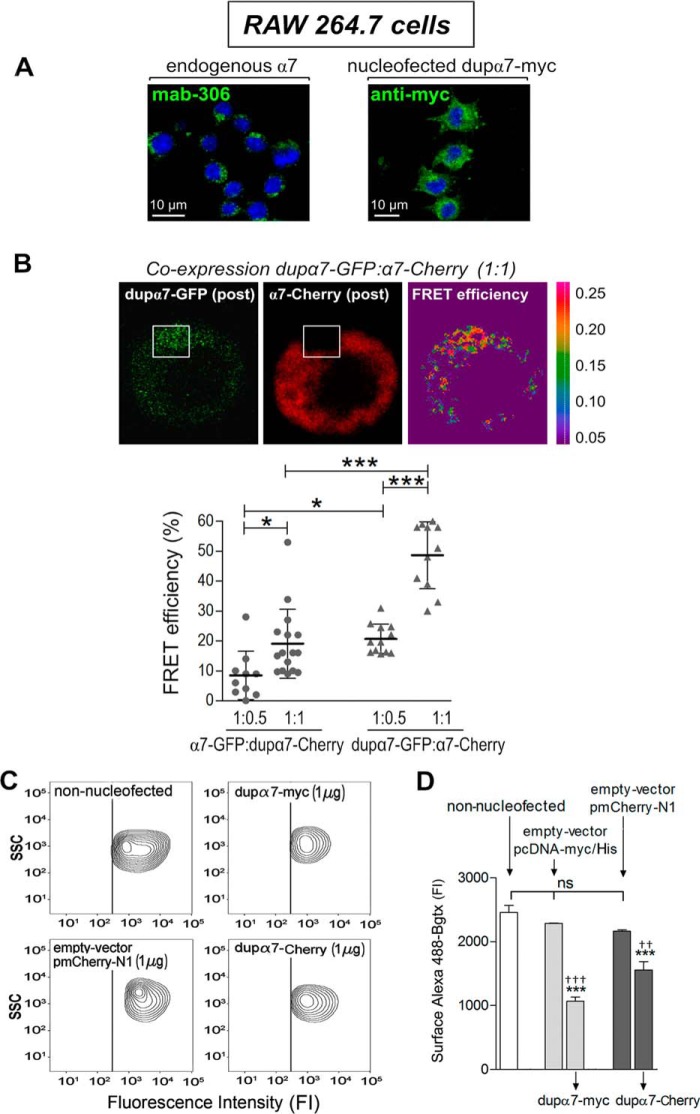
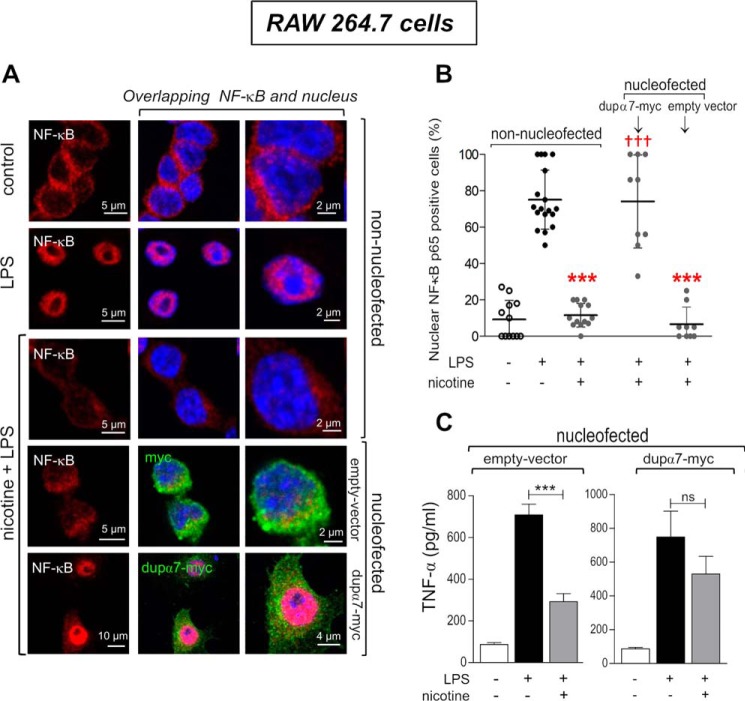
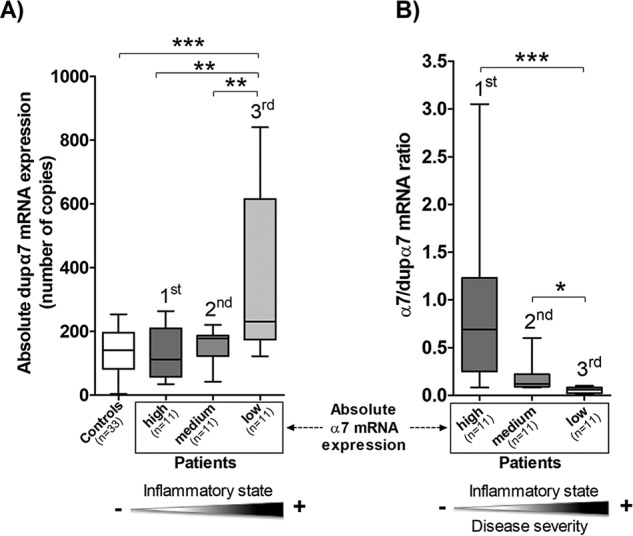
The α7 nicotinic receptor subunit and its partially duplicated human-specific dupα7 isoform are coexpressed in neuronal and non-neuronal cells. In these cells, α7 subunits form homopentameric α7 nicotinic acetylcholine receptors (α7-nAChRs) implicated in numerous pathologies. In immune cells, α7-nAChRs are essential for vagal control of inflammatory response in sepsis. Recent studies show that the dupα7 subunit is a dominant-negative regulator of α7-nAChR activity in Xenopus oocytes. However, its biological significance in mammalian cells, particularly immune cells, remains unexplored, as the duplicated form is indistinguishable from the original subunit in standard tests. Here, using immunocytochemistry, confocal microscopy, coimmunoprecipitation, FRET, flow cytometry, and ELISA, we addressed this challenge in GH4C1 rat pituitary cells and RAW264.7 murine macrophages transfected with epitope- and fluorescent protein-tagged α7 or dupα7. We used quantitative RT-PCR of dupα7 gene expression levels in peripheral blood mononuclear cells (PBMCs) from patients with sepsis to analyze its relationship with PBMC α7 mRNA levels and with serum concentrations of inflammatory markers. We found that a physical interaction between dupα7 and α7 subunits in both cell lines generates heteromeric nAChRs that remain mainly trapped in the endoplasmic reticulum. The dupα7 sequestration of α7 subunits reduced membrane expression of functional α7-nAChRs, attenuating their anti-inflammatory capacity in lipopolysaccharide-stimulated macrophages. Moreover, the PBMC's dupα7 levels correlated inversely with their α7 levels and directly with the magnitude of the patients' inflammatory state. These results indicate that dupα7 probably reduces human vagal anti-inflammatory responses and suggest its involvement in other α7-nAChR-mediated pathophysiological processes.

Keywords: GH4C1 cells; RAW264.7 macrophages; dupα7 nicotinic subunit; human sepsis; inflammation; macrophage; nicotinic acetylcholine receptors (nAChR); protein assembly; sepsis; α-nicotinic subunit.


Conflict of interest statement

The authors declare that they have no conflicts of interest with the contents of this article

Figures

Figure 1.
Figure 1.
Cellular distribution of α7 and dupα7 subunits expressed separately or in combination in GH4C1 cells. A and B, left panels show confocal images representative of cells expressing either α7-HA (red) or dupα7-Myc (green) subunits after the respective epitopes were immunostained. The center panels show the plasma membrane of the same cells (green and red, respectively) labeled with Alexa Fluor 633–WGA. The panels on right (merged) show the cells with successful expression of α7 subunits (indicated by white arrows) reaching the cell membrane (yellow/orange), in contrast to the expression of dupα7-Myc subunits mostly located in the cytosol. C, image of double-positive structures (white dots) of the coinciding labeling region of α7 or dupα7 subunits and the plasma membrane generated by using the Leica software “colocalization function” in the above cells. D, same software was employed to qualitatively analyze the colocalization sites (white dots) of α7-Cherry subunits and plasma membrane (blue) in two WGA-stained cells transfected with the α7-pmCherry construct, alone or in combination with the dupα7-GFP construct; higher magnifications of colocalization sites in boxed areas (insets) are shown. E, evaluation of the dupα7 effect on α7 expression in the cytosolic membrane of cells transfected as described in D using the Pearson's correlation and Manders' overlap coefficients to quantitatively analyze the colocalization of α7-Cherry subunits and Alexa Fluor 633–WGA-stained membranes. The scatter plots show the distribution of the values found in single cells from three different cultures and the mean ± S.D. for each group. ***, p < 0.001 compared with cells transfected only with the α7-pmCherry–N1 construct by using the Student's t test. F, representative immunoblots from the same cell culture of the protein extracts from cells expressing α7-Cherry, combined or not with dupα7-GFP, at the indicated proportions. Specific bands corresponding to α7-Cherry or dupα7-GFP subunits were detected with the appropriate primary (anti-Cherry and anti-GFP) and secondary (HRP)-conjugated antibodies. G, confocal image of the homogeneous distribution of α7-Cherry subunits throughout the ER (blue) in a cell transfected with the indicated construct (left panel). The coexpression of dupα7-GFP together with α7-Cherry in a different cell causes the entrapment of α7 subunits in the form of aggregates in a localized region of the ER, probably hindering the migration to the cell membrane of these subunits conveniently assembled into homomeric α7-nAChRs (center and right images). Images like those obtained in these two cells were also found in other cells from two different cell cultures.
Figure 2.
Figure 2.
Association of α7 with dupα7 subunits identified by immunostaining, coimmunoprecipitation, and FRET in GH4C1 cells transfected with several pairs of α7 and dupα7 constructs. A, confocal images representative of cells transfected with the pair of constructs α7-HA.pcDNA3.1/dupα7.pcDNA3.1/Myc-His. Expression of α7-HA (red) or dupα7-Myc (green) subunits was detected after the respective epitopes were immunostained; colocalization of both subunits is clearly recognizable (yellow) in those cells in which joint expression has occurred (white arrows). B, two representative blots from the same cell culture probed with anti-HA or anti-Myc antibodies. Lanes 1 and 2 correspond to nonimmunoprecipitated cell lysates (Total Lysates) from cells transfected separately with α7-HA.pcDNA3.1 or dupα7.pcDNA3.1/Myc-His, respectively. Lane 3 corresponds to the cell lysate from cells doubly transfected with the above pair of constructs and subjected to IP of the dupα7-Myc subunits with the Myc antibody. C, representative FRET experiment in two cells cotransfected with the pair α7-pGFP/dupα7-pmCherry at the indicated ratios; confocal images were acquired before (pre) or after (post) photobleaching of the acceptor (dupα7-Cherry) in the framed area. The increase in the emission at 488 nm of the donor (α7-GFP (post)) in both cells is worth noting. D, scatter plots representing the FRET efficiency values, expressed as a percentage of maximal efficiency, determined in the region of interest for acceptor photobleaching in single cells from three independent experiments. These cells were transfected with the pairs of constructs α7-pGFP/dupα7-pmCherry or dupα7-pGFP/α7-pmCherry at 1:0.5 or 1:1 ratios. The horizontal bars show the mean ± S.D. for the group; **, p < 0.01 after comparing the indicated groups.
Figure 3.
Figure 3.
Physical interaction of dupα7 with α7 subunits reduces endogenous expression of functional α7-nAChRs in the plasma membrane of RAW264.7 cells. A, confocal images of the cells revealing the native expression of α7 subunits (left panel) or the successful and abundant expression of foreign dupα7-Myc subunits (right panel) after cell nucleofection with the dupα7.pcDNA3.1/Myc-His construct. The subunits α7 (green) and dupα7-Myc (green) were immunostained, respectively, with either Mab306 or the anti-Myc antibody, followed by the Alexa Fluor 488-conjugated secondary antibody in both cases. Nuclei (blue) appear stained with DAPI. B, upper panels: representative confocal images of FRET in a cell doubly-nucleofected with the pair dupα7-pGFP/α7-pmCherry at a 1:1 ratio; images reveal the increase in the emission at 488 nm of the donor (dupα7-GFP (post)) after photobleaching of the acceptor (α7-Cherry (post)) in the framed area. Right, false-color image showing higher FRET efficiency (red) in the selected area. Lower panel: scatter graph reflecting the FRET efficiency values, expressed as percentage of maximal efficiency, determined in the region of interest for acceptor photobleaching in single cells from three independent cell cultures. The cells were transfected with the pairs of constructs α7-pGFP/dupα7-pmCherry or dupα7-pGFP/α7-pmCherry at 1:0.5 or 1:1 ratios. The horizontal bars show the mean ± S.D. for the group; *, p < 0.05, and ***, p < 0.001, after comparing the indicated groups. C and D, flow cytometry analysis of native expression of functional α7-nAChRs labeled with Alexa Fluor 488–Bgtx in cells nucleofected with the dupα7.pcDNA3.1/Myc-His or pmCherry-tagged dupα7 constructs or with their corresponding empty vectors; non-nucleofected cells were used as a reference. C, representative contour plots showing SCC and cell-surface expression of α7-nAChRs in non-nucleofected cells or in cells nucleofected with the indicated constructs (positive for dupα7-Myc, dupα7-Cherry, or Cherry). D, histogram representing pooled results of the fluorescence intensity corresponding to the Alexa Fluor 488–Bgtx bound to the α7-nAChRs on the cell surface of each cell population. The bars represent means ± S.E. from three independent cell cultures. ***, p < 0.001 compared with non-nucleofected cells; †††, p < 0.001, and ††, p < 0.01 compared with cells nucleofected with the corresponding empty vector. ns is nonsignificant.
Figure 4.
Figure 4.
Loss of the anti-inflammatory effect of nicotine in LPS-stimulated RAW264.7 macrophages due to dupα7 overexpression. The anti-inflammatory activity of nicotine acting on α7-nAChRs of macrophages exposed to LPS was analyzed by measuring the drug effect on nuclear translocation of NF-κB or TNFα production assayed by immunostaining/confocal microscopy or ELISA, respectively. A, representative confocal images of the cellular distribution of NF-κB (red) after staining with primary anti-NF-κB–p65 antibody and Alexa Fluor 555-conjugated secondary antibody in non-nucleofected cells or in cells nucleofected with dupα7.pcDNA3.1/Myc-His or with the corresponding empty vector. Successful expression of the dupα7-Myc subunit or empty vector in nucleofected cells was ensured by staining of the Myc epitope (green) with the primary anti-Myc antibody and the Alexa Fluor 488-conjugated secondary antibody. DAPI was used for nuclear staining (blue). In non-nucleofected cells, NF-κB was distributed throughout the cytosol in the absence of stimulation and was translocated to the nucleus in response to LPS (100 ng/ml; 1 h). Incubation of cells with nicotine prevents the NF-κB activation induced by endotoxin. This anti-inflammatory effect of nicotine was preserved in cells nucleofected with the empty vector while it is markedly reduced in cells overexpressing dupα7 subunits. B, percentage of cells with respect to total cells visualized in individual microscope fields from three independent experiments in which the NF-κB–p65 translocation to the nucleus has occurred (positive cells) in response to each experimental condition described above. The horizontal bars show the mean ± S.D. for the group; ***, p < 0.001 compared with non-nucleofected cells exposed to LPS. †††, p < 0.001 compared with non-nucleofected cells exposed to LPS and nicotine. C, histogram representing the effect of nicotine on TNFα production induced by LPS (100 ng/ml; 4 h) in cells nucleofected with dupα7.pcDNA3.1/Myc-His or with the empty vector. Once again, the anti-inflammatory effect of nicotine in cells nucleofected with the empty vector practically disappears after dupα7 overexpression. The bars show the mean ± S.E. from three independent experiments. ***, p < 0.001 after comparing the indicated bars. ns is nonsignificant.
Figure 5.
Figure 5.
Expression analysis of dupα7 and α7 subunit genes in PBMCs from patients with sepsis. Absolute expression values for each gene transcript (number of mRNA copies) in PBMCs from 33 patients with sepsis and 33 healthy individuals (Controls) were determined by qPCR on the basis of a standard six-point curve as described under “Experimental procedures.” Each value, obtained in triplicate, represents an average of three separate determinations. A, expression of dupα7 mRNA in the control group and in patients distributed into tertiles (11 patients/tertile) according to their absolute α7 mRNA expression level (1st tertile, high; 2nd tertile, medium; 3rd tertile, low levels). B, α7/dupα7 ratio calculated on the basis of the number of copies of both transcripts. Data are represented as box-and-whisker plots; the line within each box shows the median expression of dupα7 or α7/dupα7 ratio, upper and lower edges of the box represent the 75th and 25th percentiles, respectively, and the ends of the whisker the maximum and minimum value of the series. The ANOVA test followed by the Bonferroni post hoc test (A) or the Kruskal-Wallis test followed by the Dunn post hoc test (B) was used for data analysis. *, p < 0.05; **, p < 0.01; and ***, p < 0.001 after comparing the indicated boxes. The shaded triangles at the bottom panel reflect the existence of significant correlations between dupα7 mRNA levels or α7/dupα7 ratio and the inflammatory state or disease severity of the patients.

References

    1. Albuquerque E. X., Pereira E. F., Alkondon M., and Rogers S. W. (2009) Mammalian nicotinic acetylcholine receptors: from structure to function. Physiol. Rev. 89, 73–120 10.1152/physrev.00015.2008 - DOI - PMC - PubMed
    1. Fasoli F., and Gotti C. (2015) Structure of neuronal nicotinic receptors. Curr. Top. Behav. Neurosci. 23, 1–17 10.1007/978-3-319-13665-3_1 - DOI - PubMed
    1. Unwin N. (2005) Refined structure of the nicotinic acetylcholine receptor at 4A resolution. J. Mol. Biol. 346, 967–989 10.1016/j.jmb.2004.12.031 - DOI - PubMed
    1. Dajas-Bailador F., and Wonnacott S. (2004) Nicotinic acetylcholine receptors and the regulation of neuronal signalling. Trends Pharmacol. Sci. 25, 317–324 10.1016/j.tips.2004.04.006 - DOI - PubMed
    1. Dineley K. T., Pandya A. A., and Yakel J. L. (2015) Nicotinic ACh receptors as therapeutic targets in CNS disorders. Trends Pharmacol. Sci. 36, 96–108 10.1016/j.tips.2014.12.002 - DOI - PMC - PubMed

Publication types

MeSH terms

Substances