Comparative Study
. 2018 Aug 15;38(33):7255-7269.
doi: 10.1523/JNEUROSCI.0388-18.2018. Epub 2018 Jul 13.

Large-Scale, High-Resolution Comparison of the Core Visual Object Recognition Behavior of Humans, Monkeys, and State-of-the-Art Deep Artificial Neural Networks

Affiliations
Comparative Study

Large-Scale, High-Resolution Comparison of the Core Visual Object Recognition Behavior of Humans, Monkeys, and State-of-the-Art Deep Artificial Neural Networks

Rishi Rajalingham et al. J Neurosci. .

Abstract

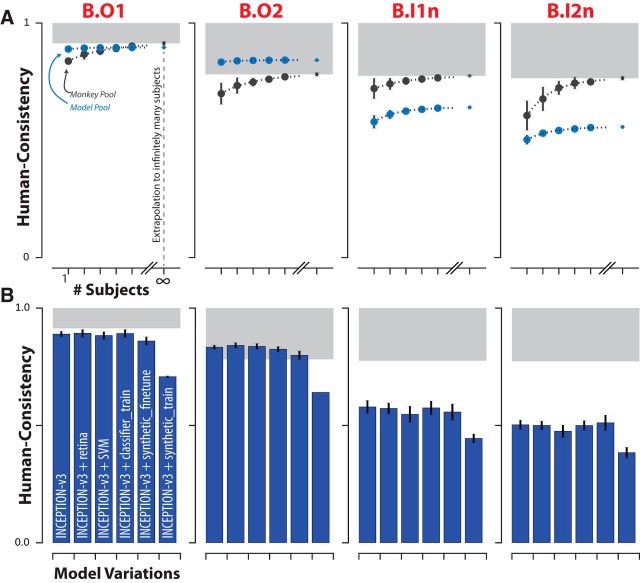
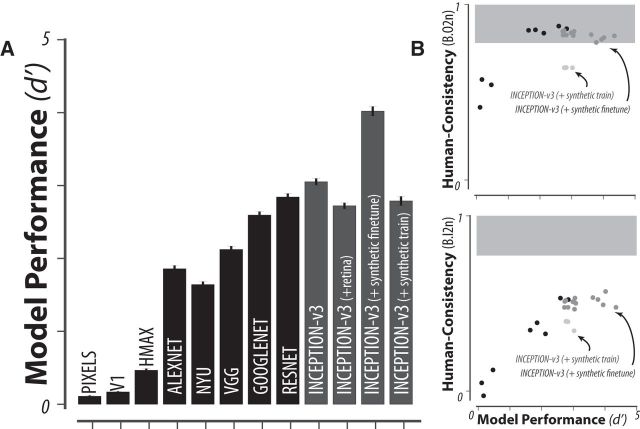
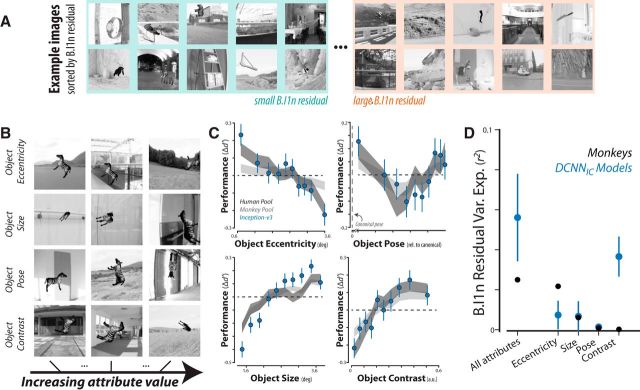
Primates, including humans, can typically recognize objects in visual images at a glance despite naturally occurring identity-preserving image transformations (e.g., changes in viewpoint). A primary neuroscience goal is to uncover neuron-level mechanistic models that quantitatively explain this behavior by predicting primate performance for each and every image. Here, we applied this stringent behavioral prediction test to the leading mechanistic models of primate vision (specifically, deep, convolutional, artificial neural networks; ANNs) by directly comparing their behavioral signatures against those of humans and rhesus macaque monkeys. Using high-throughput data collection systems for human and monkey psychophysics, we collected more than one million behavioral trials from 1472 anonymous humans and five male macaque monkeys for 2400 images over 276 binary object discrimination tasks. Consistent with previous work, we observed that state-of-the-art deep, feedforward convolutional ANNs trained for visual categorization (termed DCNNIC models) accurately predicted primate patterns of object-level confusion. However, when we examined behavioral performance for individual images within each object discrimination task, we found that all tested DCNNIC models were significantly nonpredictive of primate performance and that this prediction failure was not accounted for by simple image attributes nor rescued by simple model modifications. These results show that current DCNNIC models cannot account for the image-level behavioral patterns of primates and that new ANN models are needed to more precisely capture the neural mechanisms underlying primate object vision. To this end, large-scale, high-resolution primate behavioral benchmarks such as those obtained here could serve as direct guides for discovering such models.SIGNIFICANCE STATEMENT Recently, specific feedforward deep convolutional artificial neural networks (ANNs) models have dramatically advanced our quantitative understanding of the neural mechanisms underlying primate core object recognition. In this work, we tested the limits of those ANNs by systematically comparing the behavioral responses of these models with the behavioral responses of humans and monkeys at the resolution of individual images. Using these high-resolution metrics, we found that all tested ANN models significantly diverged from primate behavior. Going forward, these high-resolution, large-scale primate behavioral benchmarks could serve as direct guides for discovering better ANN models of the primate visual system.

Keywords: deep neural network; human; monkey; object recognition; vision.


Figures

Figure 1.
Figure 1.
Images and behavioral task. A, Two (of 100) example images for each of the 24 basic-level objects. To enforce true invariant object recognition behavior, we generated naturalistic synthetic images, each with one foreground object, by rendering a 3D model of each object with randomly chosen viewing parameters and placing that foreground object view onto a randomly chosen, natural image background. B, Time course of example behavioral trial (zebra vs dog) for human psychophysics. Each trial initiated with a central fixation point for 500 ms, followed by 100 ms presentation of a square test image (spanning 6–8° of visual angle). After extinction of the test image, two choice images were shown to the left and right. Human participants were allowed to freely view the response images for up to 1000 ms and responded by clicking on one of the choice images; no feedback was given. To neutralize top-down feature attention, all 276 binary object discrimination tasks were randomly interleaved on a trial-by-trial basis. The monkey task paradigm was nearly identical to the human paradigm with the exception that trials were initiated by touching a fixation circle horizontally centered on the bottom third of the screen and successful trials were rewarded with juice, whereas incorrect choices resulted in timeouts of 1–2.5 s. C, Large-scale and high-throughput psychophysics in humans (top left), monkeys (top right), and models (bottom). Human behavior was measured using the online Amazon MTurk platform, which enabled the rapid collection of ∼1 million behavioral trials from 1472 human subjects. Monkey behavior was measured using a novel custom home cage behavioral system (MonkeyTurk), which leveraged a web-based behavioral task running on a tablet to test many monkey subjects simultaneously in their home environment. Deep convolutional neural network models were tested on the same images and tasks as those presented to humans and monkeys by extracting features from the penultimate layer of each visual system model and training back-end multiclass logistic regression classifiers. All behavioral predictions of each visual system model were for images that were not seen in any phase of model training.
Figure 2.
Figure 2.
Object-level comparison to human behavior. A, One-versus-all object-level (B.O1) signatures for the pooled human (n = 1472 human subjects), pooled monkey (n = 5 monkey subjects), and several DCNNIC models. Each B.O1 signature is shown as a 24-dimensional vector using a color scale; each colored bin corresponds to the system's discriminability of one object against all others that were tested. The color scales span each signature's full performance range and warm colors indicate lower discriminability. B, Direct comparison of the B.O1 signatures of a pixel visual system model (top) and a DCNNIC visual system model (Inception-v3; bottom) against that of the human B.O1 signature. C, Human consistency of B.O1 signatures for each of the tested model visual systems. The black and gray dots correspond to a held-out pool of five human subjects and a pool of five macaque monkey subjects, respectively. The shaded area corresponds to the “primate zone,” a range of consistencies delimited by the estimated human consistency of a pool of infinitely many monkeys (see Fig. 4A). D, One-versus-other object-level (B.O2) signatures for pooled human, pooled monkey, and several DCNNIC models. Each B.O2 signature is shown as a 24 × 24 symmetric matrices using a color scale, where each bin (i,j) corresponds to the system's discriminability of objects i and j. As in A, color scales span each signature's full performance range and warm colors indicate lower discriminability. E, Human consistency of B.O2 signatures for each of the tested model visual systems. Format is identical to that in C.
Figure 3.
Figure 3.
Image-level comparison to human behavior. A, Schematic for computing B.I1n. First, the one-versus-all image-level signature (B.I1) is shown as a 240-dimensional vector (24 objects, 10 images/object) using a color scale, where each colored bin corresponds to the system's discriminability of one image against all distractor objects. From this pattern, the normalized one-versus-all image-level signature (B.I1n) is estimated by subtracting the mean performance value over all images of the same object. This normalization procedure isolates behavioral variance that is specifically image driven but not simply predicted by the object. B, Normalized one-versus-all object-level (B.I1n) signatures for the pooled human, pooled monkey, and several DCNNIC models. Each B.I1n signature is shown as a 240-dimensional vector using a color scale formatted as in A. C, Human consistency of B.I1n signatures for each of the tested model visual systems. Format is identical to that in Figure 2C. D, Normalized one-versus-other image-level (B.I2n) signatures for pooled human, pooled monkey, and several DCNNIC models. Each B.I2n signature is shown as a 240 × 24 matrix using a color scale, where each bin (i,j) corresponds to the system's discriminability of image i against distractor object j. Colors scales in A,B and D span each signature's full performance range and warm colors indicate lower discriminability. E, Human consistency of B.I2n signatures for each of the tested model visual systems. Format is identical to that in Figure 2C.
Figure 4.
Figure 4.
Effect of subject pool size and DCNN model modifications on consistency with human behavior. A, For each of the four behavioral metrics, the human consistency distributions of monkey (blue markers) and model (black markers) pools are shown as a function of the number of subjects in the pool (mean ± SD, over subjects). Human consistency increases with growing number of subjects for all visual systems across all behavioral metrics. The dashed lines correspond to fitted exponential functions and the parameter estimate (mean ± SE) of the asymptotic value, corresponding to the estimated human consistency of a pool of infinitely many subjects, is shown at the right most point on each abscissa. B, Model modifications that aim to rescue the DCNNIC models. We tested several simple modifications (see Materials and Methods) to the most human consistent DCNNIC visual system model (Inception-v3). Each panel shows the resulting human consistency per modified model (mean ± SD. over different model instances, varying in random filter initializations) for each of the four behavioral metrics.
Figure 5.
Figure 5.
Model performance. A, Model performance on synthetic images (average B.O2 across 276 tasks) for each of the tested models fixing the number of training images and classifier. Black bars correspond to different model architectures, with fixed optimization, whereas gray bars correspond to different modifications of a fixed model architecture (Inception-v3). B, Correlation between model performance and human consistency with respect to object-level (B.O2) and image-level (B.I2n) behavioral metrics. Each point corresponds to a single instance of a trained DCNN model.
Figure 6.
Figure 6.
Analysis of unexplained human behavioral variance. A, Residual similarity between all pairs of human visual system models. The color of bin (i,j) indicates the proportion of explainable variance that is shared between the residual signatures of visual systems i and j. For ease of interpretation, we ordered visual system models based on their architecture and optimization procedure and partitioned this matrix into four distinct regions. B, Summary of residual similarity. For each of the four regions in Figure 5A, the similarity to the residuals of Inception-v3 (region 2 in A) is shown (mean ± SD, within each region) for all images (black dots) and for images that humans found to be particularly difficult (gray dots, selected based on held-out human data).
Figure 7.
Figure 7.
Dependence of primate and DCNN model behavior on image attributes. A, Example images showing that models and primates agree on (left) and diverge on (right) with respect to B.I1n residuals. B, Example images with increasing attribute value for each of the four predefined image attributes (see Materials and Methods). C, Dependence of performance (B.I1n) as a function of four image attributes for humans, monkeys, and a DCNNIC model (Inception-v3). D, Proportion of explainable variance of the residual signatures of monkeys (black) and DCNNIC models (blue) that is accounted for by each of the predefined image attributes. Error bars correspond to SD over trial resampling for monkeys and over different models for DCNNIC models.

References

    1. Battleday RM, Peterson JC, Griffiths TL (2017) Modeling human categorization of natural images using deep feature representations. arXiv preprint arXiv:171104855. Advance online publication. Retrieved Nov 13, 2017. Available at https://arxiv.org/abs/1711.04855.
    1. Cadena SA, Denfield GH, Walker EY, Gatys LA, Tolias AS, Bethge M, Ecker AS (2017) Deep convolutional models improve predictions of macaque V1 responses to natural images. bioRxiv:201764 10.1101/201764 - DOI - PMC - PubMed
    1. Cadieu CF, Hong H, Yamins DL, Pinto N, Ardila D, Solomon EA, Majaj NJ, DiCarlo JJ (2014) Deep neural networks rival the representation of primate IT cortex for core visual object recognition. PLoS Comput Biol 10:e1003963. 10.1371/journal.pcbi.1003963 - DOI - PMC - PubMed
    1. Cichy RM, Khosla A, Pantazis D, Torralba A, Oliva A (2016) Comparison of deep neural networks to spatio-temporal cortical dynamics of human visual object recognition reveals hierarchical correspondence. Sci Rep 6:27755. 10.1038/srep27755 - DOI - PMC - PubMed
    1. Cichy RM, Khosla A, Pantazis D, Oliva A (2017) Dynamics of scene representations in the human brain revealed by magnetoencephalography and deep neural networks. Neuroimage 153:346–358. 10.1016/j.neuroimage.2016.03.063 - DOI - PMC - PubMed

Publication types