

A high-throughput method to identify trans-activation domains within transcription factor sequences
- PMID: 30006452
- PMCID: PMC6092621
- DOI: 10.15252/embj.201798896
A high-throughput method to identify trans-activation domains within transcription factor sequences
Abstract
Even though transcription factors (TFs) are central players of gene regulation and have been extensively studied, their regulatory trans-activation domains (tADs) often remain unknown and a systematic functional characterization of tADs is lacking. Here, we present a novel high-throughput approach tAD-seq to functionally test thousands of candidate tADs from different TFs in parallel. The tADs we identify by pooled screening validate in individual luciferase assays, whereas neutral regions do not. Interestingly, the tADs are found at arbitrary positions within the TF sequences and can contain amino acid (e.g., glutamine) repeat regions or overlap structured domains, including helix-loop-helix domains that are typically annotated as DNA-binding. We also identified tADs in the non-native reading frames, confirming that random sequences can function as tADs, albeit weakly. The identification of tADs as short protein sequences sufficient for transcription activation will enable the systematic study of TF function, which-particularly for TFs of different transcription activating functionalities-is still poorly understood.
Keywords: glutamine‐rich regions; high‐throughput functional screen; transcription; transcription factor; trans‐activation domain.
© 2018 The Authors. Published under the terms of the CC BY 4.0 license.
Figures
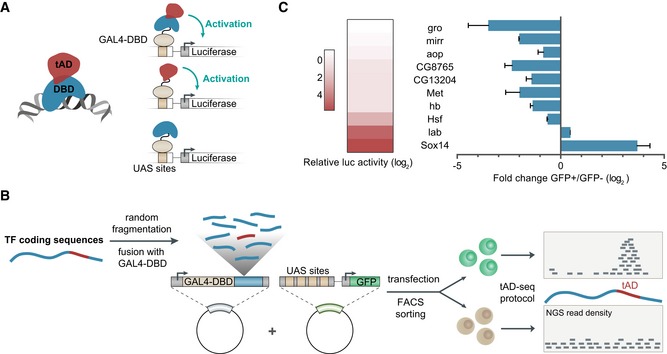
TFs are typically modular with two distinct functionalities—they bind to specific DNA sequences via their DNA‐binding domains (DBDs, blue), and trans‐activate transcription via trans‐activation domains (tADs, red). tADs but not DBDs are sufficient to activate transcription when recruited to the promoter of a reporter gene (e.g., luciferase) via a heterologous DBD, here the Gal4‐DBD.
Detailed schematic overview of the tAD‐seq workflow, including Gal4‐DBD‐candidate library cloning (tAD‐seq library), co‐transfection of library and 4xUAS‐GFP reporter plasmids, separation of GFP+ (tAD enriched) and GFP− cells by FACS, and NGS‐based tAD identification by quantification of Gal4‐DBD‐candidate transcripts in GFP+ vs. GFP− cells.
TF‐mRNA enrichment in GFP+ vs. GFP− cells reflects the TFs activating and repressing functionalities. Left: heat map depicting transcription activating and repressing functions (shades of red, see color legend) of the ten indicated TFs tested individually by recruitment to 4xUAS‐luciferase reporters (data from Stampfel et al, 2015). Right: bar plot indicating relative distribution of TF transcripts between GFP+ and GFP− cells as measured by RT–qPCR (n = 3, error bars: s.d.) after transfecting a pool of ten TFs into S2 cells and separation of GFP+ and GFP− cells by FACS.
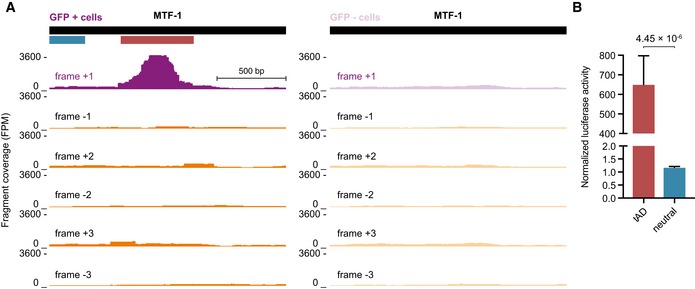
UCSC Genome Browser (GB) screenshots (dedicated genome containing only TF CDSs and flanking plasmid backbone sequence, see Materials and Methods) displaying candidate fragment coverage for GFP+ cells (left) and GFP− cells (right) in a reading frame‐specific manner (+1 frame, purple and non‐native frames, orange). The black bar on top indicates the full‐length CDS of MTF‐1. The colored bars below indicate the regions individually tested in luciferase assays (red = tAD; blue = neutral control region). High coverage is only observed in the native (+1) frame at the position of the known tAD.
Relative luciferase activity of sequences that overlap the MTF‐1 tAD (red) or a neutral region (blue, see also A). Shown are the normalized luciferase activities for tAD candidates and neutral fragments (Gal4‐DBD‐candidate) normalized to a negative control (Gal4‐DBD‐GFP; n = 4, error bars: s.d., P‐value: two‐sided Student's t‐test vs. neutral region; FPM fragments per million).
- A–G
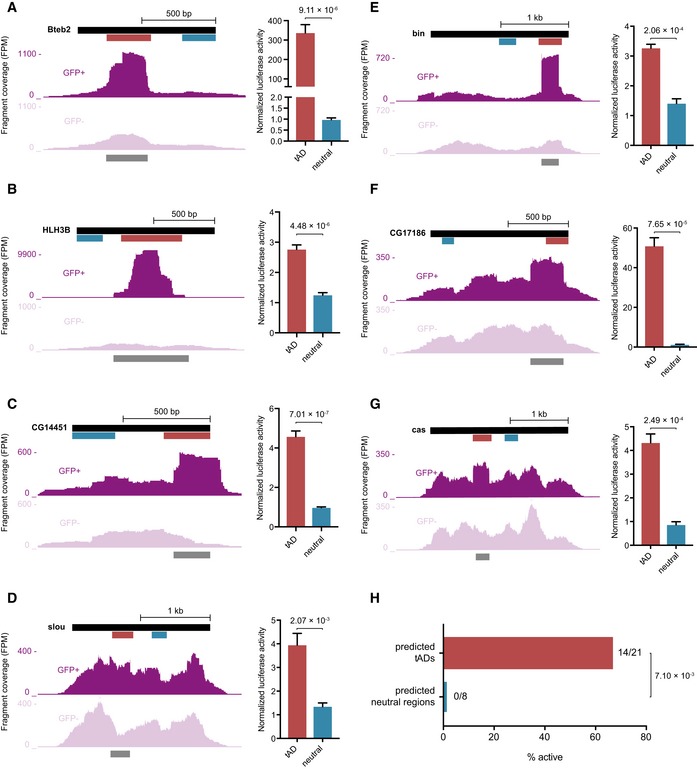
Candidate fragment coverage (+1 frame) from GFP+ (top) and GFP− (bottom) cells for Bteb2 (A), HLH3B (B), CG14451 (C), slou (D), bin (E), CG17186 (F), and cas (G). The dark gray bar at the bottom indicates the called tAD region and the red and blue bars the positions of the tAD candidate and the neutral control region, respectively, tested in luciferase assays. Normalized luciferase activities (normalized to GFP control) of tAD candidate and neutral control are shown on the right (n = 4 for Bteb2, HLH3B, and CG14451; n = 3 for slou, bin, CG17186, and cas; error bars: s.d., P‐value: two‐sided Student's t‐test vs. neutral region).
- H
Summary of individual tAD activity tests by luciferase assays for candidate tADs and neutral regions predicted by tAD‐seq (see Table EV3). Fourteen out of 21 predicted tADs (red) are active (enrichment > twofold above GFP; P < 0.05; two‐sided Student's t‐test vs. GFP control) vs. zero of eight predicted neutral regions (difference between candidate tADs and neutral regions: hypergeometric P‐value with a pseudo‐count of 1 for neutral regions).
- A
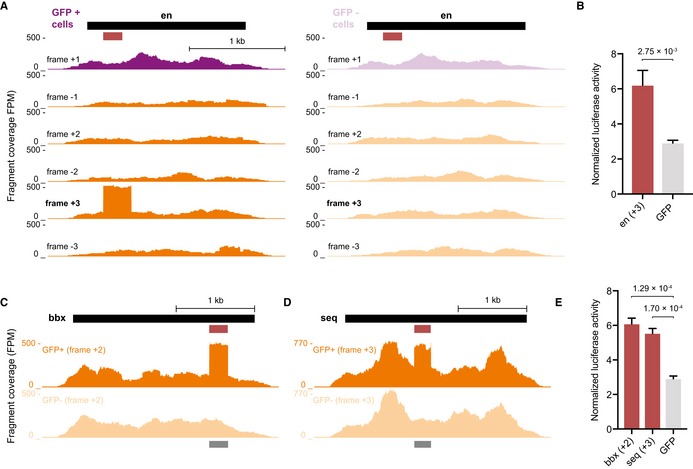
UCSC GB screenshots displaying candidate fragment coverage from GFP+ cells (left) and GFP− cells (right) for the repressive TF engrailed (en; black bar: full‐length CDS; purple: +1 frame; orange: non‐native frames). The red bar indicates the region individually tested in luciferase assays. High coverage is only observed in frame +3.
- B
Normalized luciferase activities (firefly/Renilla) of tAD candidate and GFP control are shown (n = 3, error bars: s.d., P‐value: two‐sided Student's t‐test vs. GFP control).
- C, D
Candidate fragment coverage from GFP+ and GFP− cells (orange) and the tAD calls (dark gray bar at bottom) are shown for bbx in frame +2 and seq in frame +3, respectively.
- E
Normalized luciferase activities (firefly/Renilla) of bbx and seq “out‐of‐frame” tAD candidates and GFP control (n = 3, error bars: s.d., P‐value: two‐sided Student's t‐test vs. GFP).
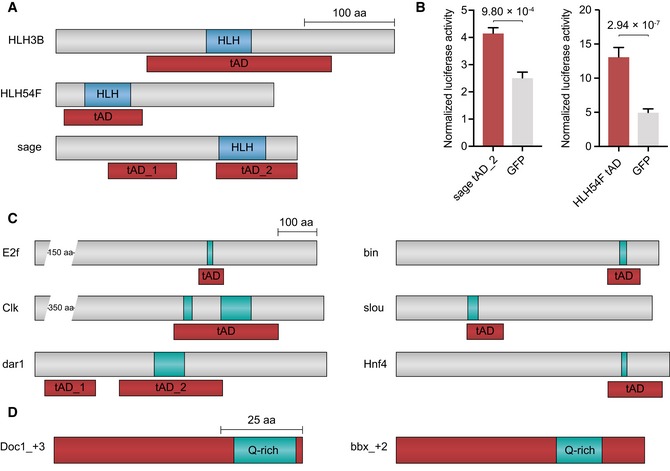
The tADs of HLH3B, HLH54F, and sage overlap with basic helix–loop–helix (HLH) domains. Shown are annotated schematic views of the full‐length TF CDSs (gray bars). tADs are shown in red, and the HLH domains in blue.
Normalized luciferase activities (firefly/Renilla) of the sage tAD_2 and HLH54F tAD candidates compared to the respective GFP control (n = 3 and n = 4, respectively, error bars: s.d., P‐value: two‐sided Student's t‐test vs. GFP control; for HLH3B, see Fig 3B).
The tADs of E2f, Clk, dar1, bin, slou, and Hnf4 contain glutamine‐rich (Q‐rich) regions. Schematic view as in (A), and Q‐rich regions in turquoise.
Out‐of‐frame tADs of Doc1 (frame +3) and bbx (frame +2) contain Q‐rich regions. Displayed are the Q‐rich regions (turquoise) within the tADs (red).
- A, B
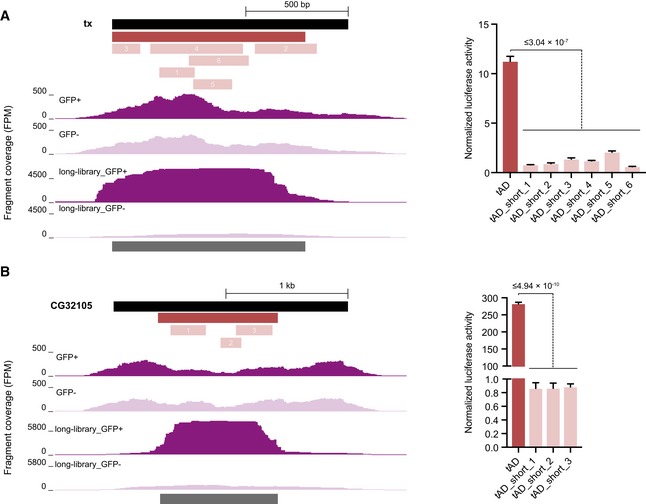
UCSC GB screenshots displaying candidate fragment coverage for taxi (tx; frame +1) (A) or CG32105 (B) of short (top)‐ and long (bottom)‐fragment candidate libraries from GFP+ cells (dark) and GFP− cells (light). The black bar on top indicates the full‐length CDS, the dark gray bars below the coverage tracks the tADs called in the long‐fragment tAD‐seq screen (no tAD was found in the short‐fragment screen). The red bar and the light red bars indicate tAD candidates tested in luciferase assays, the normalized luciferase activities (normalized to GFP control) of long and short tAD candidates are shown on the right (n = 3 long tAD candidate; n = 4 short tAD candidates, error bars: s.d., P‐value: two‐sided Student's t‐test vs. short tAD candidates, reported is the highest P‐value).
- A–C
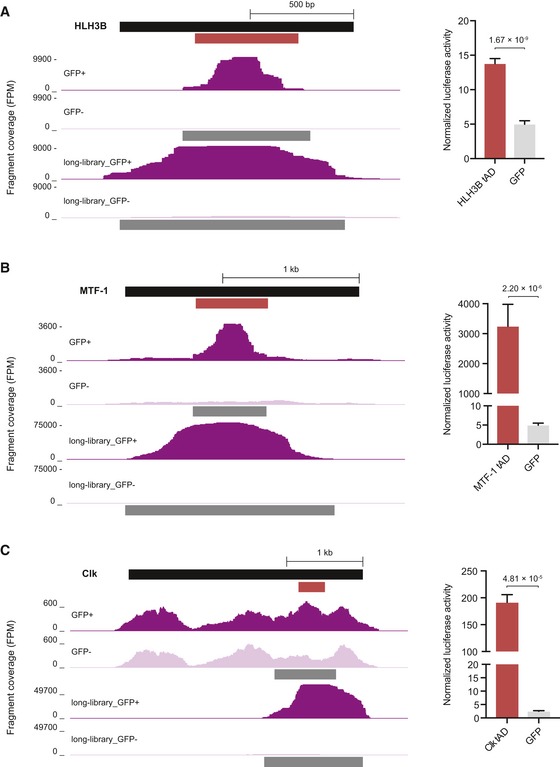
Candidate fragment coverage and tAD calls (dark gray bars below coverage tracks) for HLH3B (frame +1) (A), MTF‐1 (B) or Clk (C) of short (top)‐ and long (bottom)‐fragment candidate libraries from GFP+ cells (dark) and GFP− cells (light) are shown left. Normalized luciferase activities (firefly/Renilla) of the tAD candidates and the respective GFP control are shown (n = 4 for HLH3B and MTF‐1; n = 3 for Clk, error bars: s.d., P‐value: two‐sided Student's t‐test vs. GFP control) are shown right; for HLH3B, see Fig 3B). Short‐fragment coverage tracks and luciferase measurements for HLH3B and MTF‐1 are repeated from Figs 3B and 2, respectively, for comparison.
- A–D
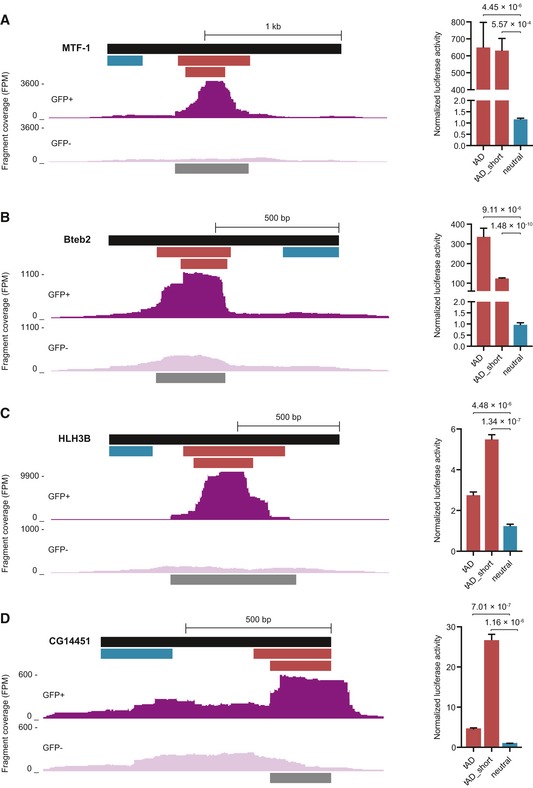
Short‐fragment library and candidate fragment coverage for the native (+1) frames for GFP+ and GFP− cells (dark and light purple tracks), called tADs (dark gray bars), and two luciferase assay tested tAD candidates (red) and neutral (blue) fragments are shown. Normalized luciferase activities (normalized to GFP control) for tAD candidates and neutral regions (n = 4, error bars: s.d., P‐value: two‐sided Student's t‐test vs. neutral region; n = 3 CG14451‐tAD_short). Data for coverage tracks and luciferase assays of tAD candidates (labeled: tAD) and neutral regions repeated from Figs 2 and 3 for comparison.
References
-
- Allada R, White NE, So WV, Hall JC, Rosbash M (1998) A mutant Drosophila homolog of mammalian Clock disrupts circadian rhythms and transcription of period and timeless. Cell 93: 791–804 - PubMed
-
- Arnold CD, Gerlach D, Stelzer C, Boryń ŁM, Rath M, Stark A (2013) Genome‐wide quantitative enhancer activity maps identified by STARR‐seq. Science 339: 1074–1077 - PubMed
-
- Atanesyan L, Günther V, Dichtl B, Georgiev O, Schaffner W (2012) Polyglutamine tracts as modulators of transcriptional activation from yeast to mammals. Biol Chem 393: 63–70 - PubMed
Publication types
MeSH terms
Substances
Grants and funding
LinkOut - more resources
Full Text Sources
Other Literature Sources
Molecular Biology Databases
Research Materials
Miscellaneous
