. 2018 Jul 13;3(25):eaao2556.
doi: 10.1126/sciimmunol.aao2556.

MR1 displays the microbial metabolome driving selective MR1-restricted T cell receptor usage

Affiliations

MR1 displays the microbial metabolome driving selective MR1-restricted T cell receptor usage

Melanie J Harriff et al. Sci Immunol. .

Abstract

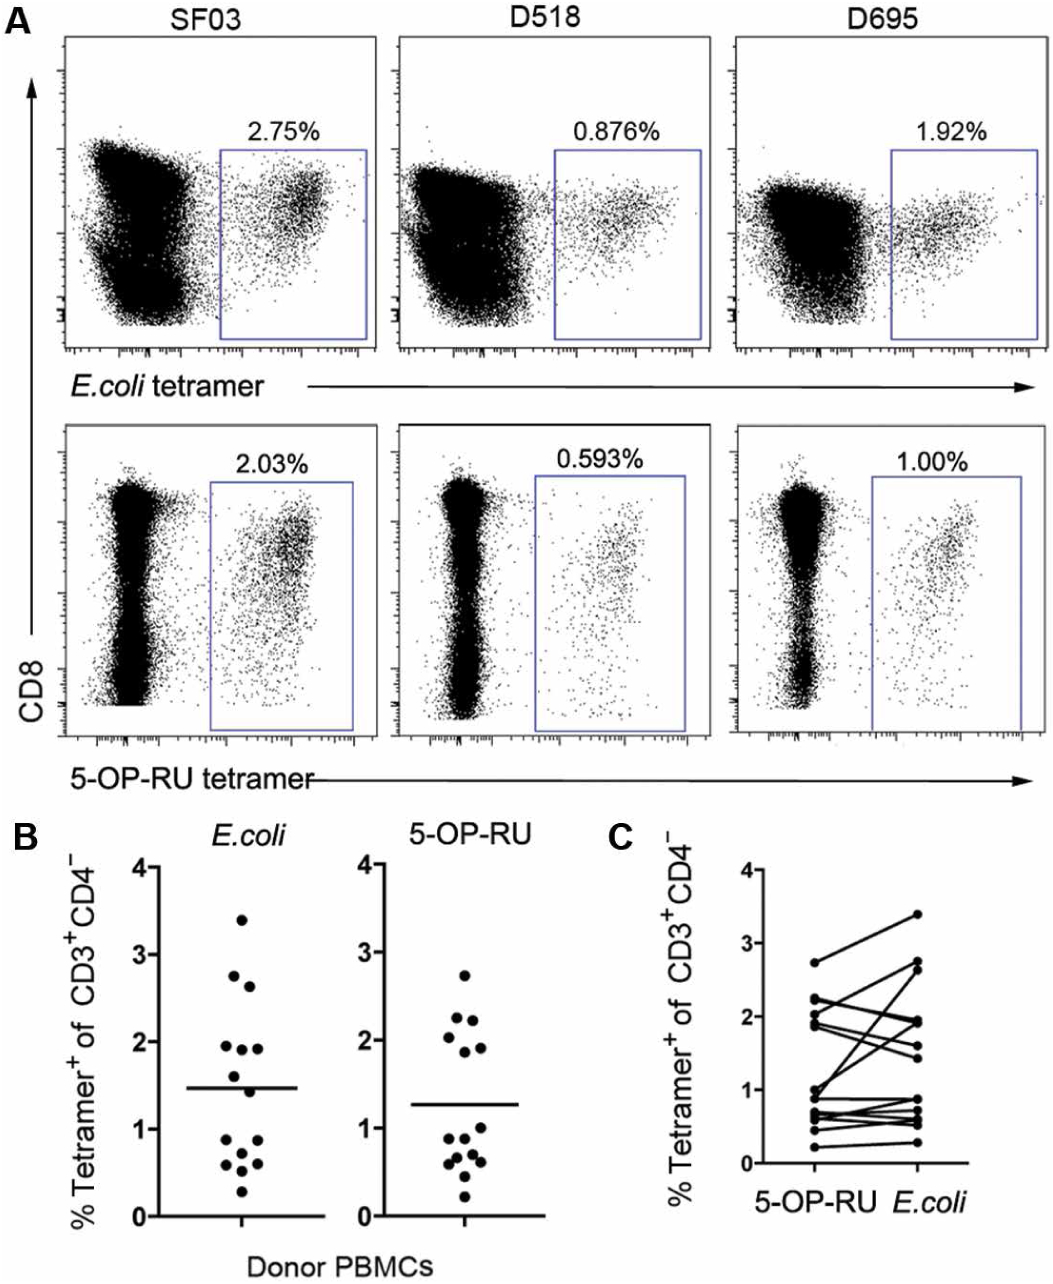
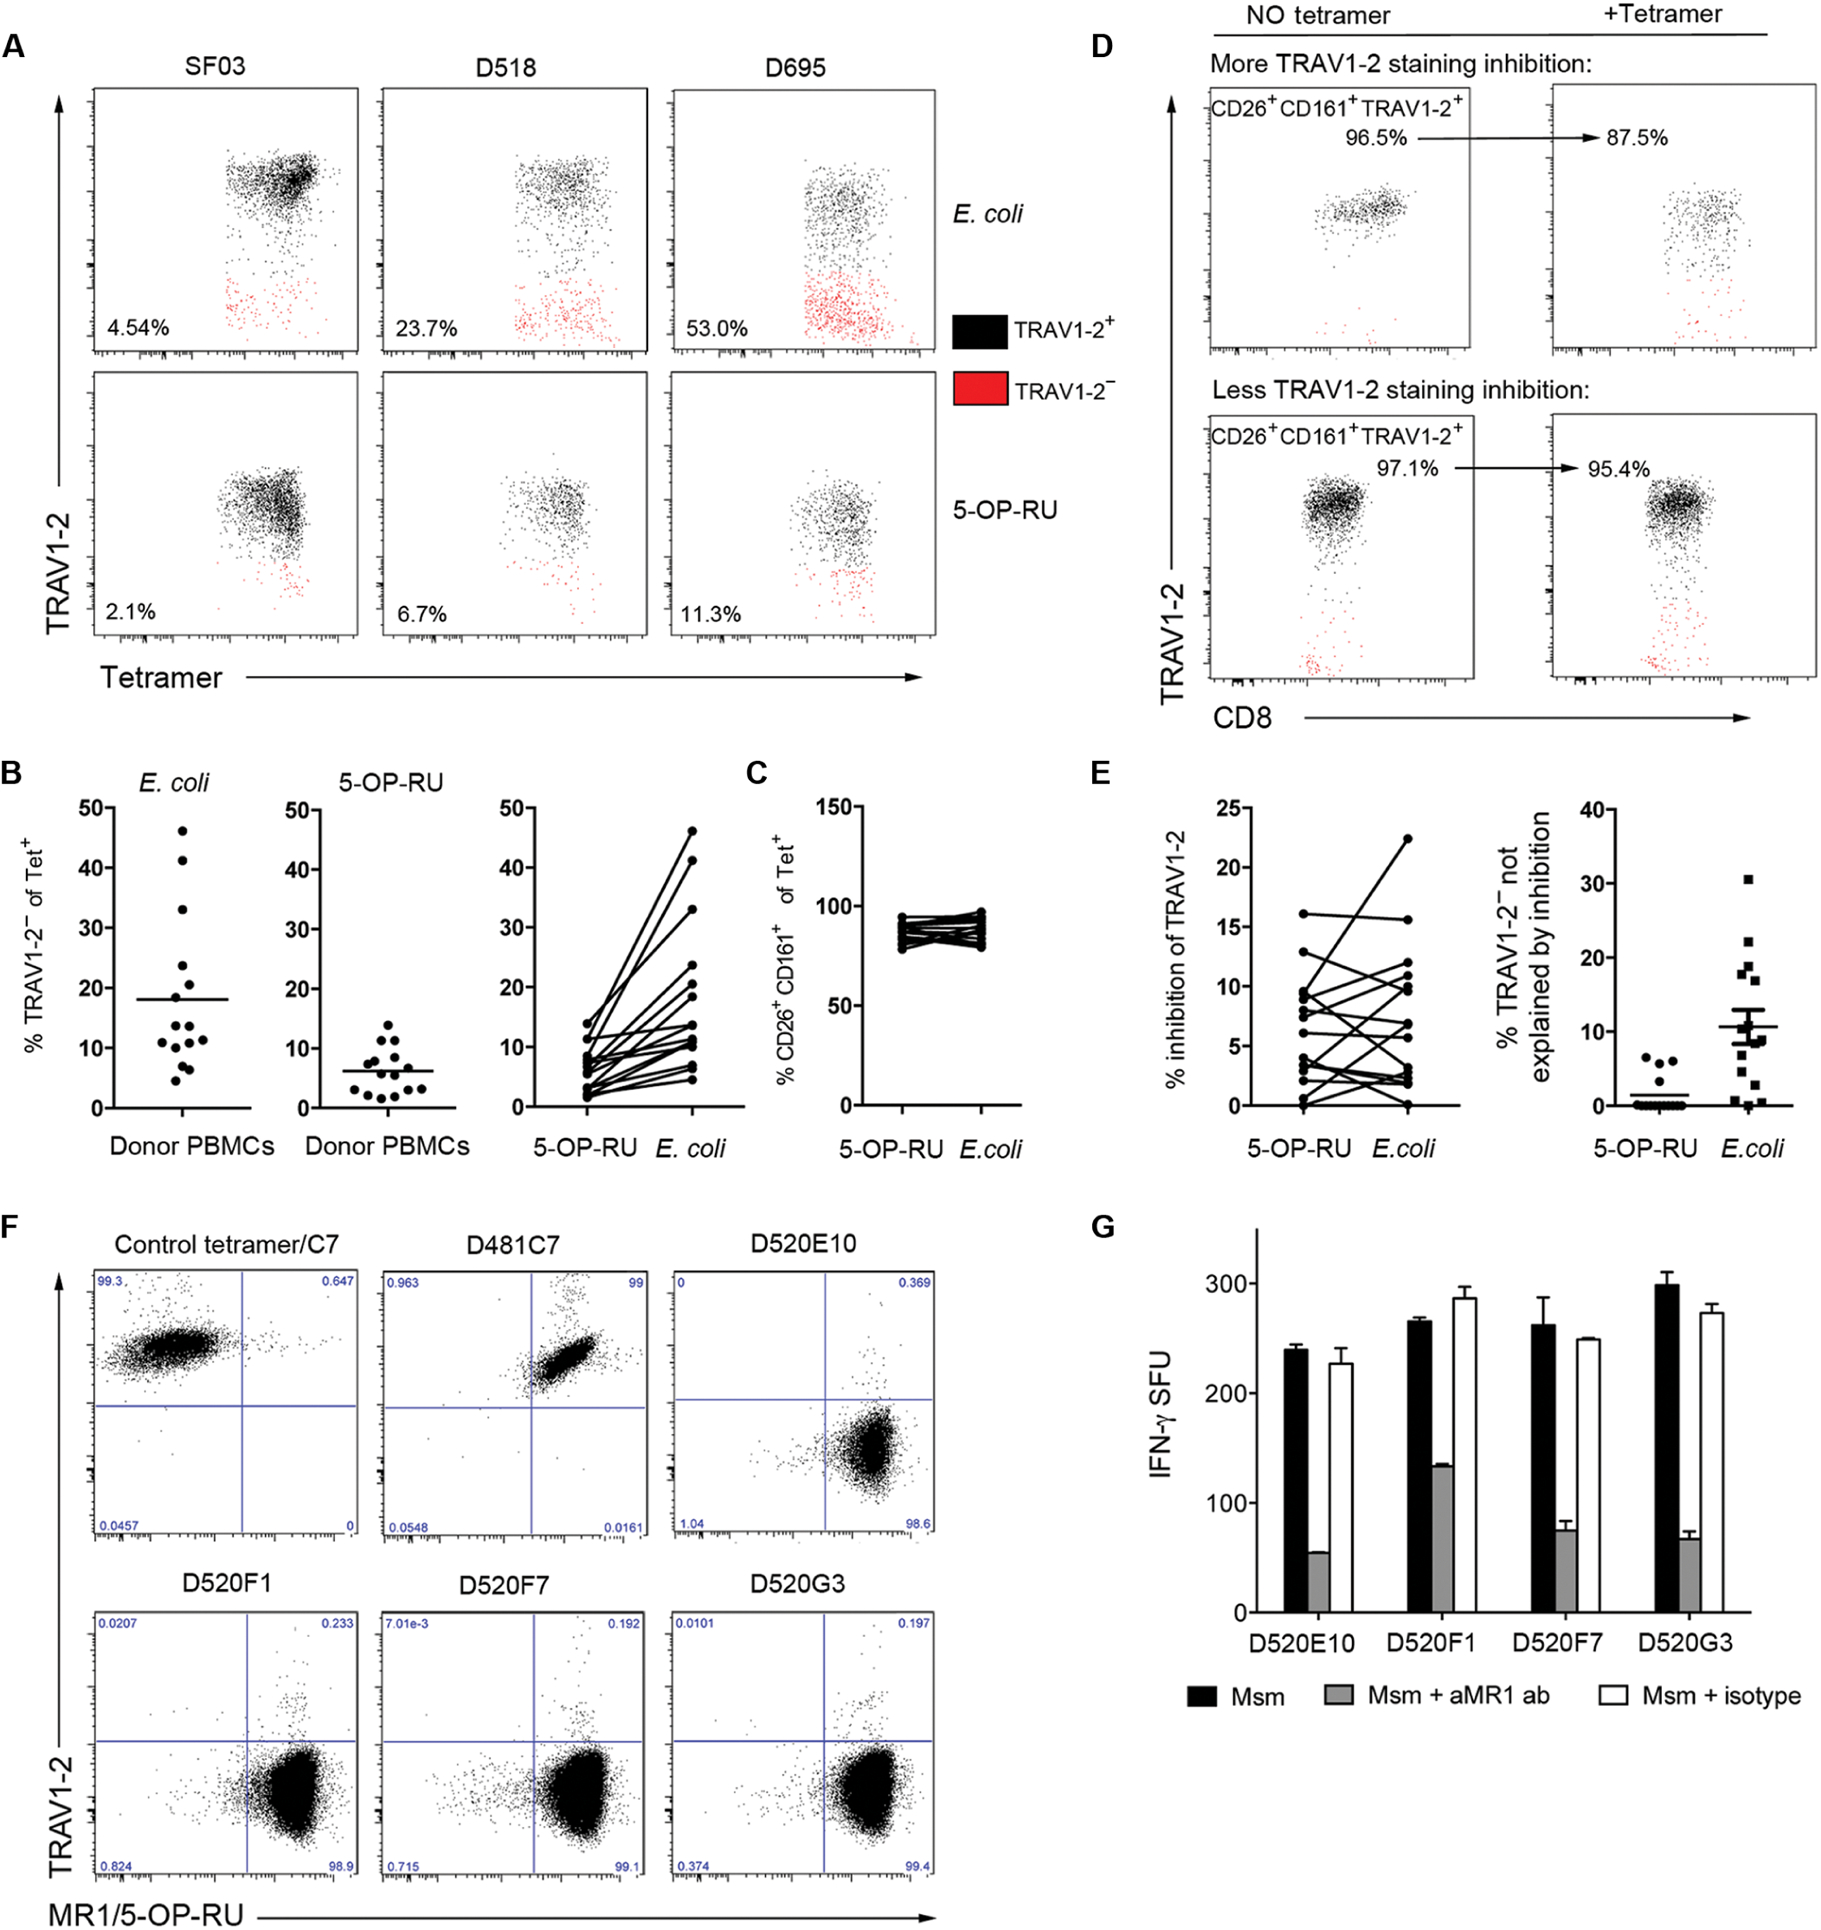
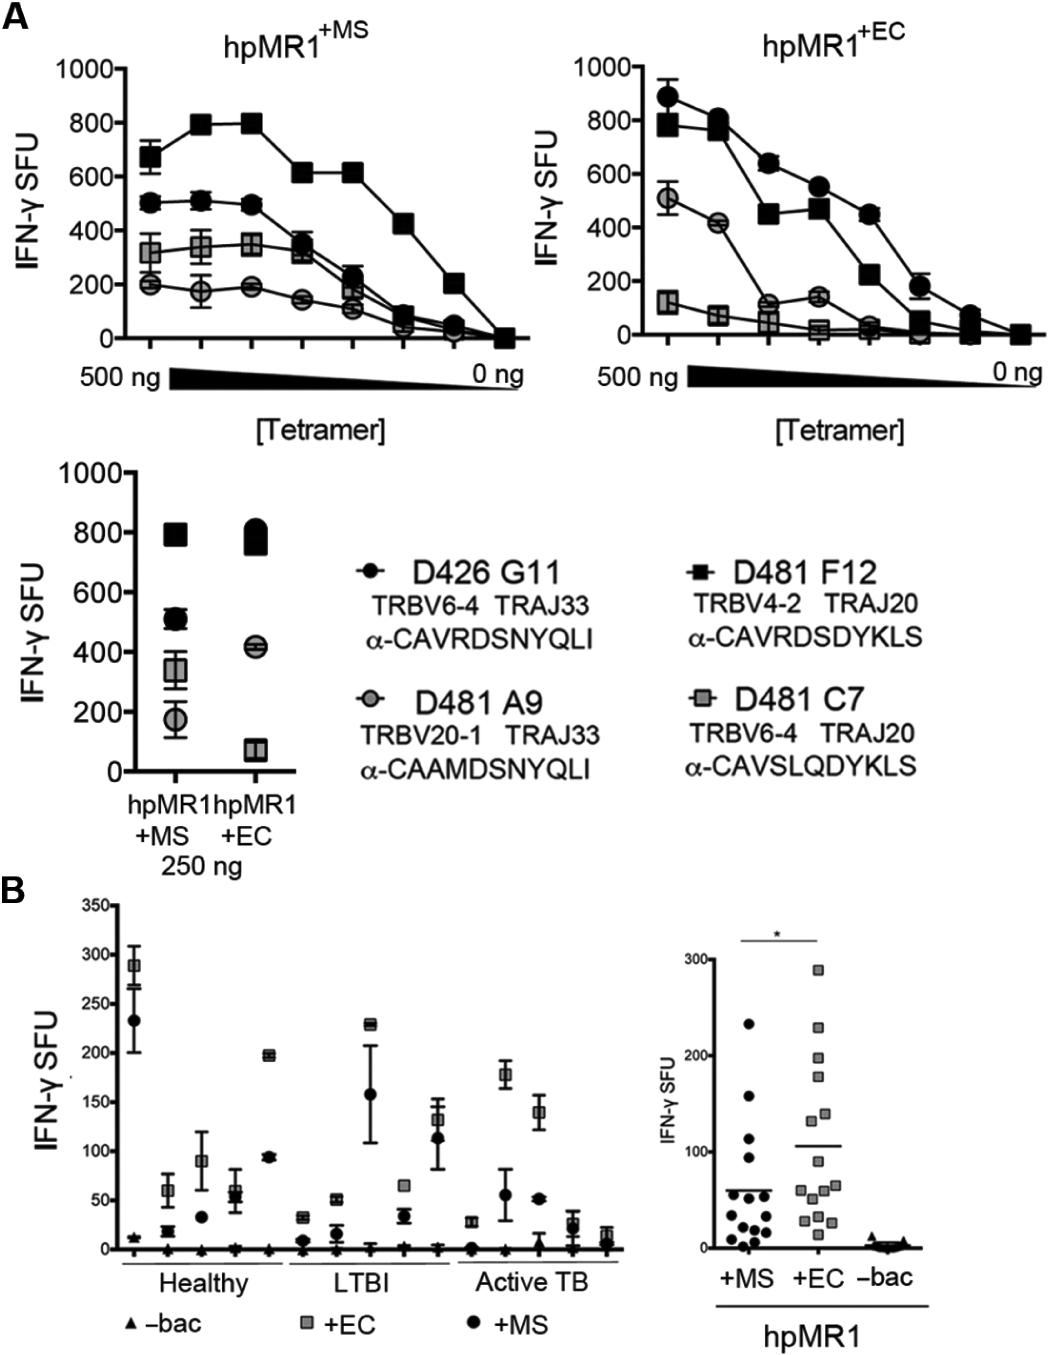
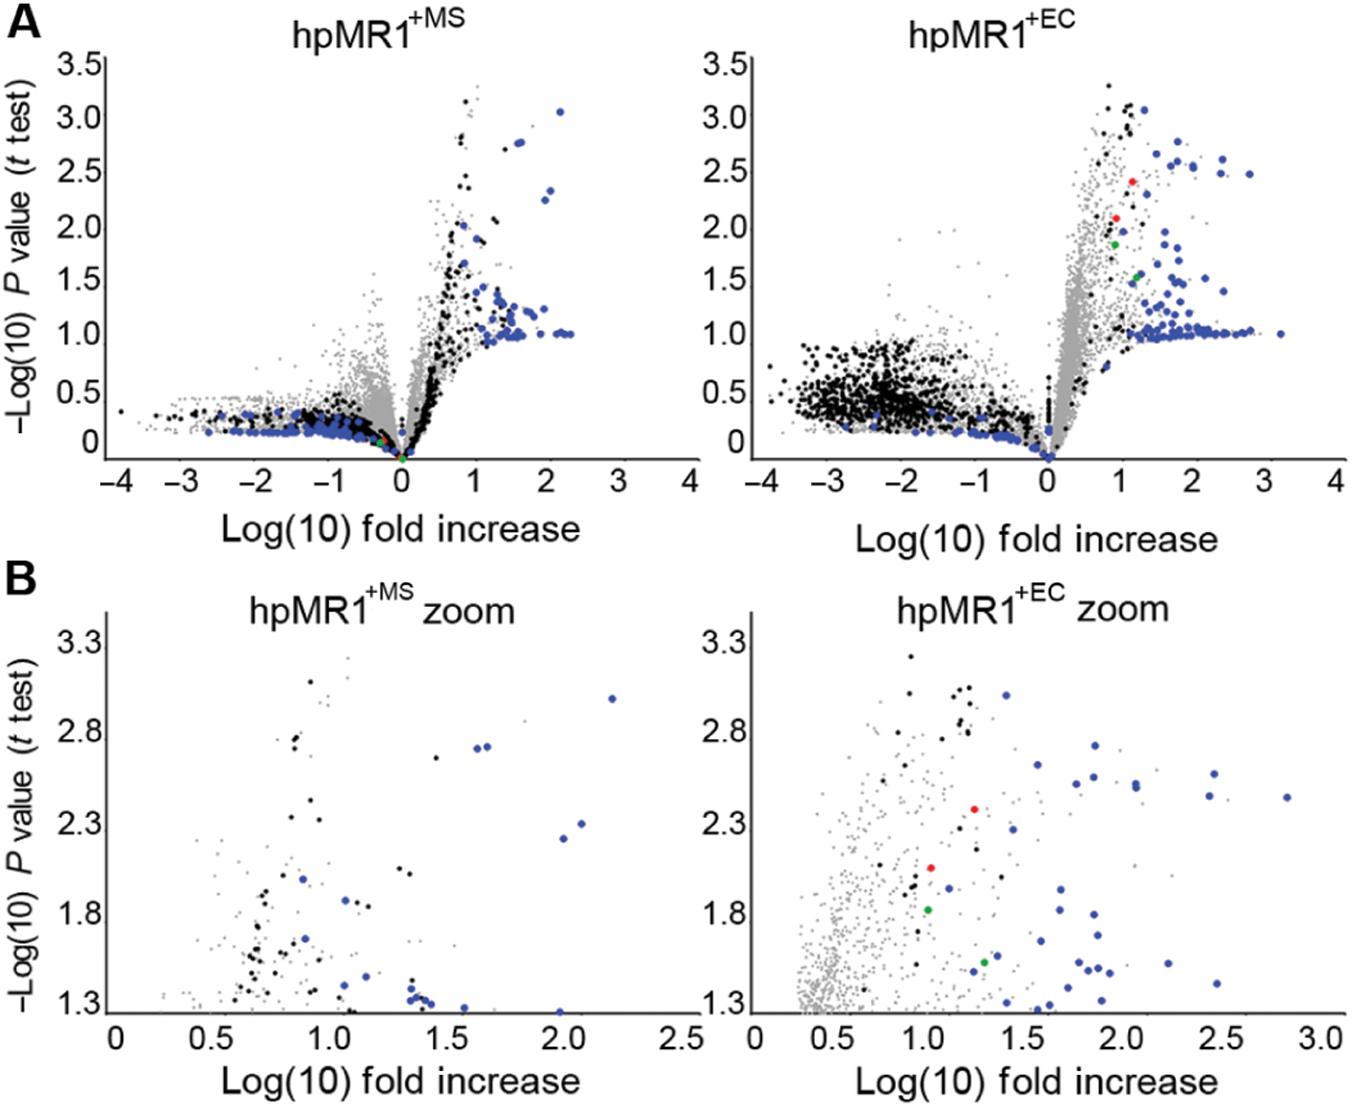
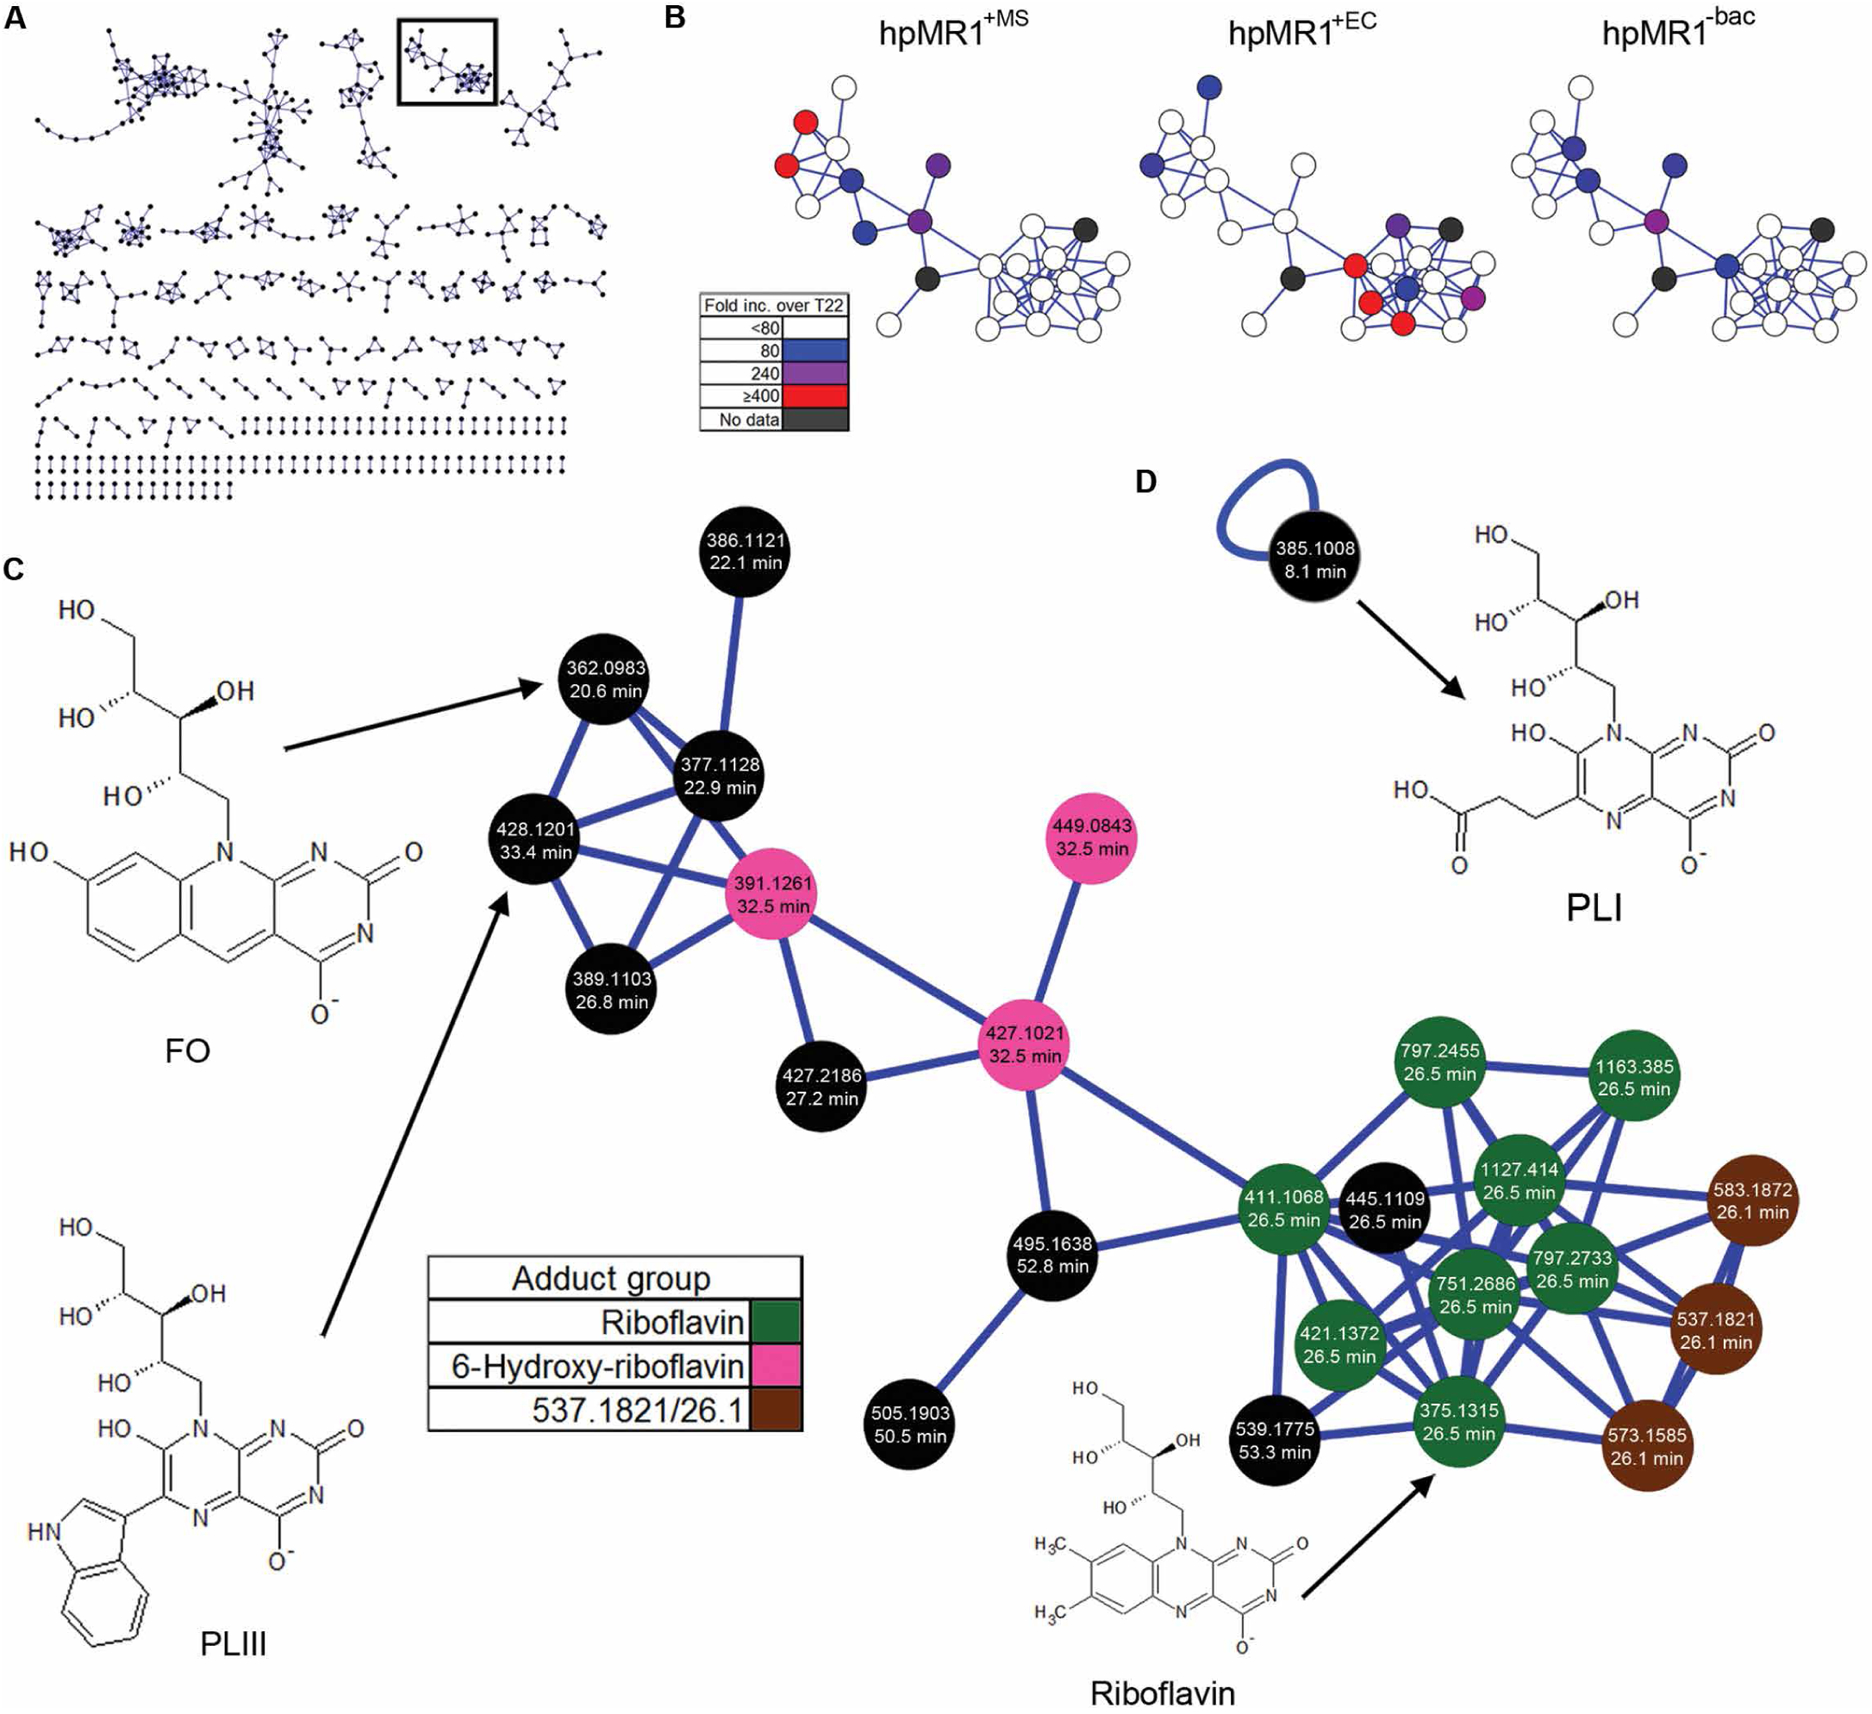
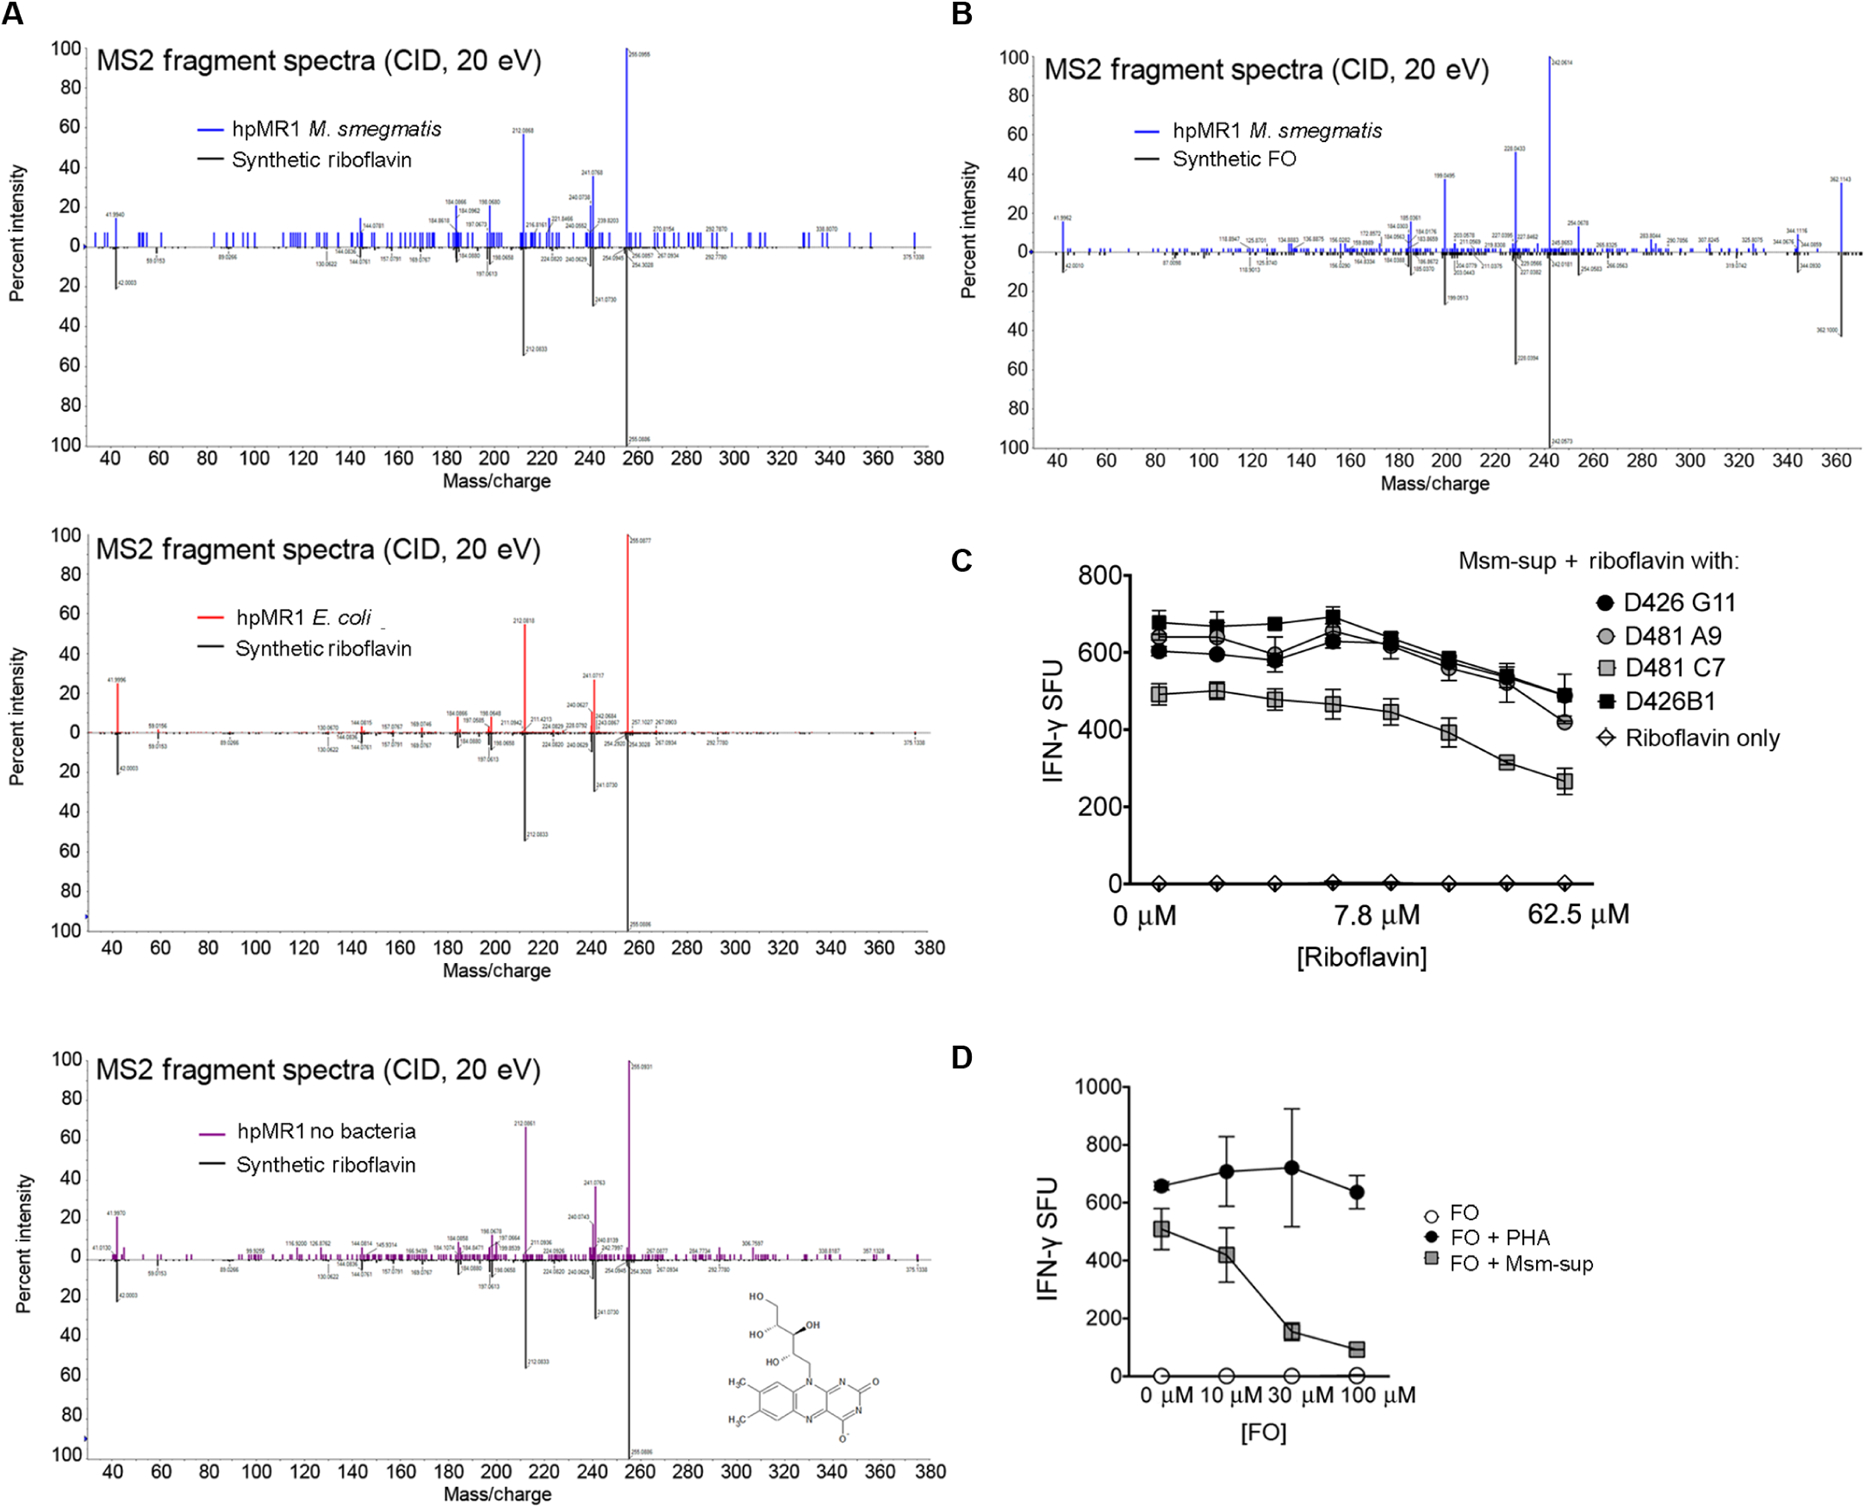
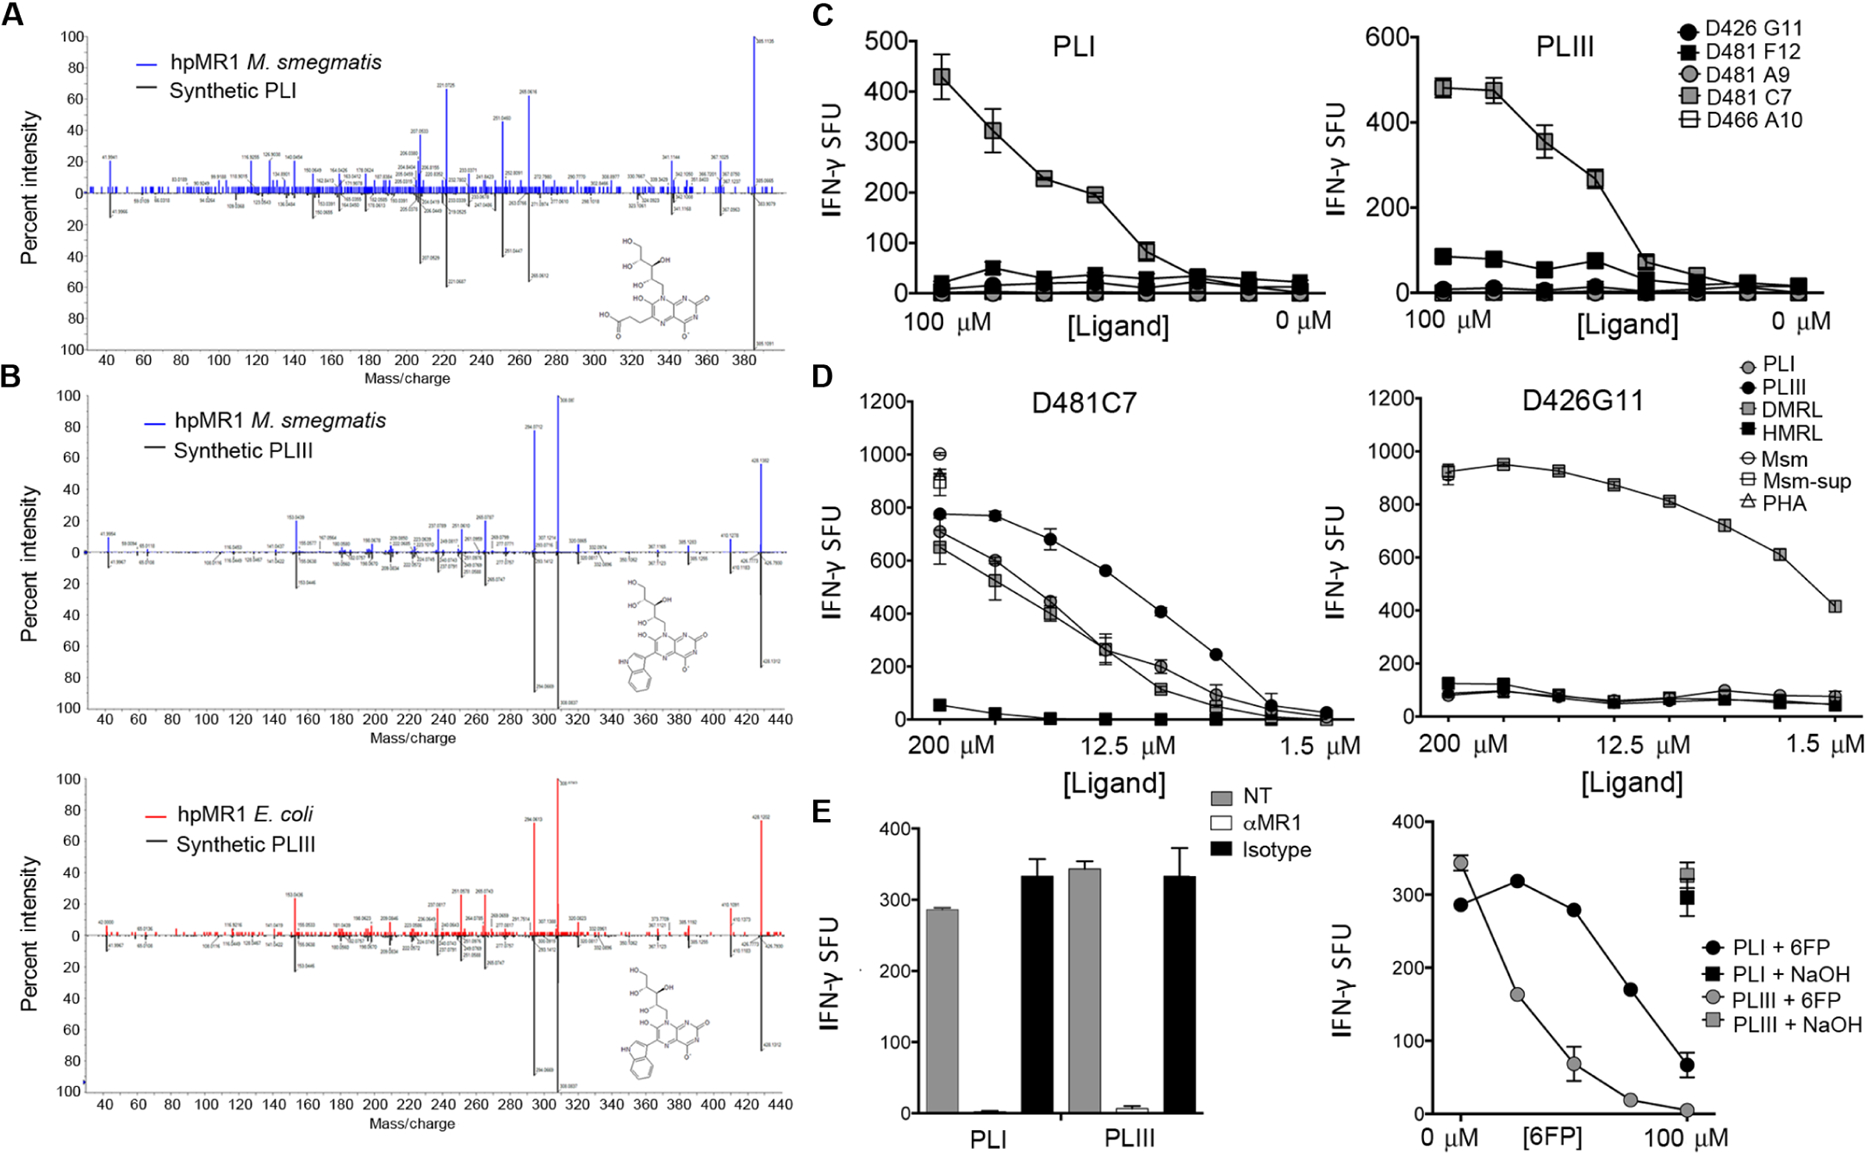
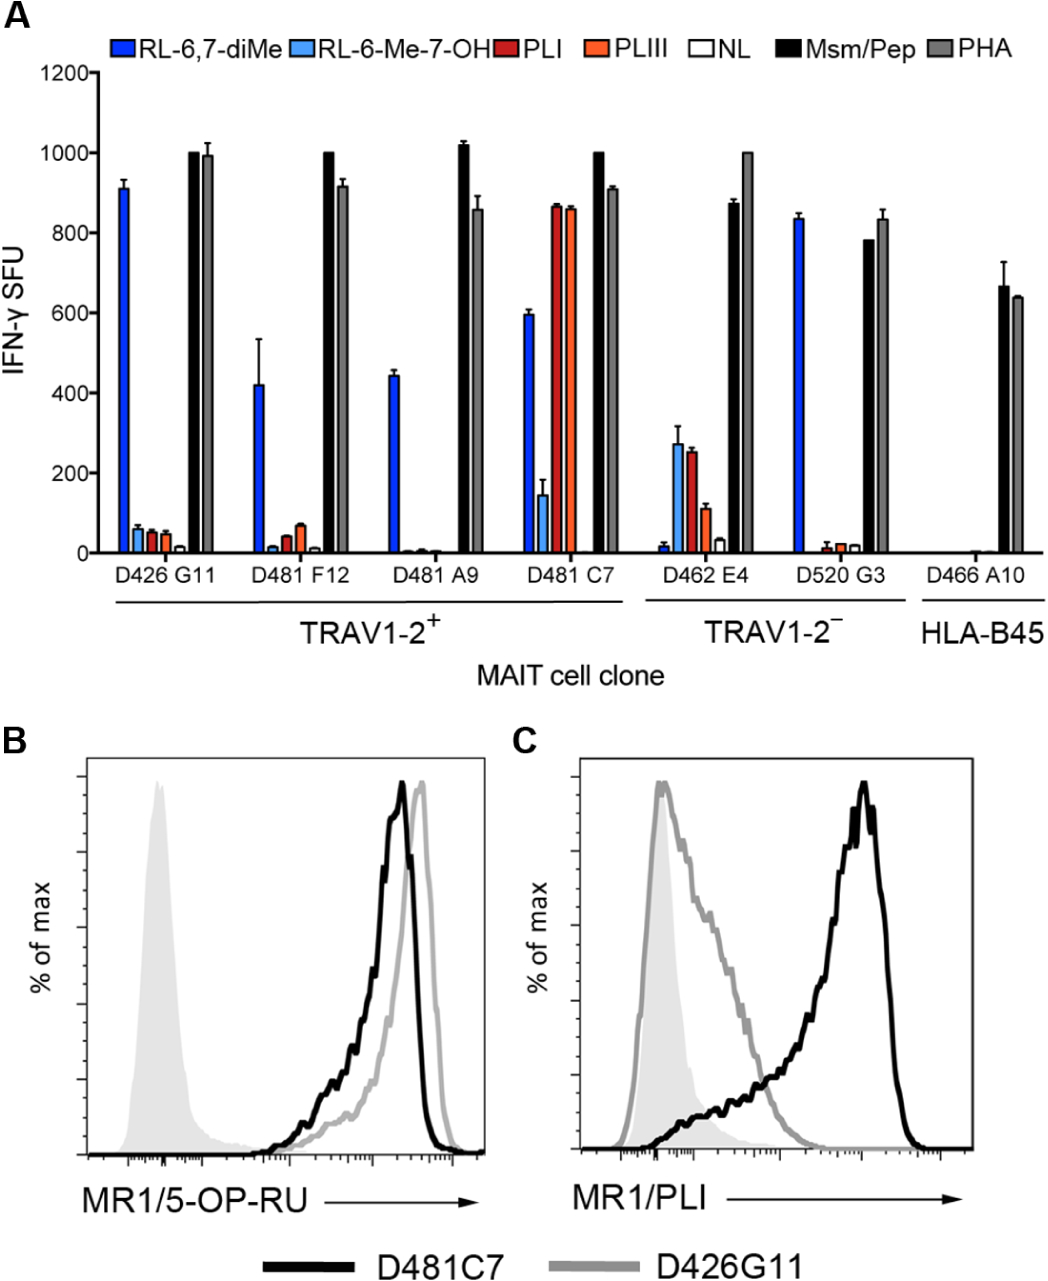
MR1-restricted T cells (MR1Ts) are a T cell subset that recognize and mediate host defense to a broad array of microbial pathogens, including respiratory pathogens (e.g., Mycobacterium tuberculosis, Streptococcus pyogenes, and Francisella tularensis) and enteric pathogens (e.g., Escherichia coli and Salmonella species). Mucosal-associated invariant T (MAIT) cells, a subset of MR1Ts, were historically defined by the use of a semi-invariant T cell receptor (TCR) and recognition of small molecules derived from the riboflavin biosynthesis pathway presented on MR1. We used mass spectrometry to identify the repertoire of ligands presented by MR1 from the microbes E. coli and Mycobacterium smegmatis We found that the MR1 ligandome is unexpectedly broad, revealing functionally distinct ligands derived from E. coli and M. smegmatis The identification, synthesis, and functional analysis of mycobacterial ligands reveal that MR1T ligands can be distinguished by MR1Ts with diverse TCR usage. These data demonstrate that MR1 can serve as an immune sensor of the microbial ligandome.


Conflict of interest statement

Competing interests:

The authors declare that they have no competing interests.

Figures

Fig. 1.
Fig. 1.. MR1Ts are recognized by hpMR1 tetramers loaded with a heterogeneous mixture of microbially derived ligands.
(A to C) PBMCs from 15 donors were stained with the hpMR1+EC tetramer (12.5 nM per test) or the MR1/5-OP-RU tetramer (1:500; NIH tetramer core) and a panel of phenotypic markers. (A) Representative dot plots for three donors. Blue boxes denote the frequency of CD3+CD4 tetramer+ cells. All plots are log scales. (B) The graphs depict the frequency of CD3+CD4MR1/5-OP-RU or hpMR1+EC tetramer+ cells for all 15 PBMC donors. (C) The graphs in (B) are paired to demonstrate the relationship between the hpMR1+EC and MR1/5-OP-RU for each donor.
Fig. 2.
Fig. 2.. MR1Ts recognized by the hpMR1+EC tetramer are more likely to be TRAV1–2.
PBMCs from 15 donors were stained as described in Fig. 1, and the population of tetramer+ cells was analyzed for phenotypic MAIT cell markers. (A) TRAV1–2 staining of tetramer+ cells for three representative donors. Black indicates TRAV1–2+ cells, and red indicates TRAV1–2 cells, with the gate defined by the population of CD3+CD4TRAV1–2+CD161+ cells, as shown in fig. S2B. (B) The graphs depict the frequency of CD3+CD4 tetramer+TRAV1–2 cells for all 15 PBMC donors. Right: Frequencies of TRAV1–2 tetramer+ cells in left graphs have been paired for each donor. (C) Frequency of CD26+CD161+ cells among tetramer+ cells between the tetramers. (D and E) PBMCs from each donor were simultaneously stained in panels with or without the tetramer to analyze tetramer inhibition of TRAV1–2 staining. (D) Frequency of CD26+CD161+TRAV1–2+ cells for two representative donors. (E) Left: Tetramer inhibition of TRAV1–2 staining is calculated for all donors using the method in (D). Right: For each donor, the inhibition of TRAV1–2 staining by tetramer was used to calculate what proportion of the TRAV1–2 events depicted in (B) are not explained by tetramer inhibition of TRAV1–2 staining. (F) TRAV1–2 MR1T clones from D520 (E10, F1, F7, and G3) and a TRAV1–2+ MR1T clone (D481C7) were analyzed by flow cytometry for tetramer and TRAV1–2 staining. (G) MR1-dependent activation of TRAV1–2 MR1T clones by human DCs infected with M. smegmatis (Msm) was measured by IFN-γ ELISPOT assay using the anti-MR1 blocking antibody (aMR1 ab). (F and G) Results are representative of three independent experiments. Error bars represent means and SD from technical replicates.
Fig. 3.
Fig. 3.. MR1Ts respond to microbially derived ligands loaded on hpMR1 tetramers.
(A) MR1T clone IFN-γ responses to hpMR1+EC or hpMR1+MS tetramers at 7.8 to 500 ng per well. TRBV, TRAJ, and CDR3 sequences are indicated for each MR1T clone. Results are representative of four independent experiments. Error bars represent means and SD from technical replicates. (B) IFN-γ responses from 5 × 10⁵ PBMCs from 15 donors to hpMR1−bac, hpMR1+EC, or hpMR1+MS tetramers, plotted by individual donor (left) or pooled (right). *P < 0.0001 (paired two-tailed t test).
Fig. 4.
Fig. 4.. Ligands eluted from hpMR1+EC and hpMR1+MS contain both shared and unique ions.
Intensities from all observed MS1 ions in triplicate injections of hpMR1+MS, hpMR1+EC, hpMR1−bac, and T22 were determined using extracted ion AUC analysis. For all ions, average intensities in hpMR1+MS (left) and hpMR1+EC (right) ions were compared with the combined average intensity of all other samples and are plotted as the log(10) of the fold increase. P values were obtained with a t test and plotted as the inverse log(10). (A) Plot of all ions for hpMR1+MS (left) and hpMR1+EC (right). (B) Only significantly (P ≤ 0.05, −log P = 1.3) increased ions for either hpMR1+MS (left) or hpMR1+EC (right). Red and green dots, previously identified MR1T ligands; blue dots, hpMR1+EC or hpMR1+MS unique ligands; black dots, hpMR1 ligands; gray dots, all other ligands. Results are representative of three independent experiments.
Fig. 5.
Fig. 5.. GNPS assists in the identification of novel hpMR1 eluted ions.
(A) Molecular network of ions eluted from hpMR1 in a force-directed layout showing clusters ≥2 nodes. Each black node represents an ion MS2 fragment spectra connected by a blue edge based on spectral similarity. The black outline denotes the riboflavin cluster in (B) and (C). (B) Relative abundance of ions in the riboflavin cluster for hpMR1+MS (left), hpMR1+EC (middle), and hpMR1−bac (right). Color indicates the fold increase over T22 in each respective hpMR1 sample. (C) Detailed image of the riboflavin network. The average ion m/z and normalized average retention time for each ion are indicated. Green nodes, riboflavin adducts; pink nodes, adducts of ion 391.1261/32.5; brown nodes, adducts of ion 537.1821/26.1. (D) Single nonclustering node associated with PLI (385.1008/8.1).
Fig. 6.
Fig. 6.. Riboflavin and FO are blocking ligands for MR1Ts.
(A) MS2 fragment spectra of precursor ion in the indicated sample, indicating that synthetic riboflavin matches the eluted ion in hpMR1+EC, hpMR1+MS, and hpMR1−bac. (B) MS2 fragment spectra of precursor ion in the indicated sample, indicating that synthetic FO matches the eluted ion in hpMR1+MS. CID, collision-induced dissociation. (C and D) MR1T clone responses to BEAS-2B cells incubated with riboflavin (C) (7.8 to 500 μM) or FO (D) (10, 30, or 100 μM) before the addition of Msm-sup. Phytohemagglutinin (PHA) was used as a control for toxicity. Results in (C) and (D) are representative of three independent experiments. Error bars represent means and SD from technical replicates.
Fig. 7.
Fig. 7.. PLI and PLIII are activating ligands for MR1Ts.
(A) MS2 fragment spectra of precursor ion in the indicated sample, indicating that synthetic PLI matches the eluted ion in hpMR1+MS. (B) MS2 fragment spectra of precursor ion in the indicated sample, indicating that synthetic PLIII matches the eluted ion in hpMR1+EC and hpMR1+MS. (C) MR1T clone responses to DC pulsed with PLI or PLIII at the indicated concentration. (D) MR1 cell clone D481C7 or D426G11 responses to DC incubated with synthetic PLI, PLIII, RL-6,7-diMe (DMRL), or RL-6-Me-7-OH (HMRL), at 1.56 to 200 μM, or M. smegmatis (Msm), Msm-sup, or PHA. (E) Left: The D481C7 MR1T clone response to DC pulsed with PLI or PLIII was blocked with the anti-MR1 blocking antibody. Right: 6-FP was added at increasing concentrations to DC before pulsing with PLI or PLIII. Results in (C) and (D) are representative of three independent experiments. Error bars represent means and SD from technical replicates.
Fig. 8.
Fig. 8.. MR1T clones with distinct TCR usage display differential recognition of discrete activating ligands.
(A) MR1T clones using the TRAV1–2+ or TRAV1–2 α-chain, or an HLA-B45–restricted T cell clone (D466 A10), responses to DC incubated with 100 μM PLI, PLIII, RL-6,7-diMe, or RL-6-Me-7-OH. M. smegmatis (Msm) for MR1T clones and the CFP102–9 peptide (Pep) for the HLA-B45 clone were used as positive controls. NL indicates the no ligand control condition. (B) hpMR1 loaded with PLI was generated and used to stain the D481C7 and D426G11 clones to demonstrate that distinct TCR-diverse MR1T clone responses to PLI correspond to tetramer staining. Gray histograms are MR1/PLI tetramer staining of a control HLA-A2–restricted CD8+ T cell clone. Results are representative of three independent experiments. Error bars represent means and SD from technical replicates.

References

    1. Van Rhijn I, Godfrey DI, Rossjohn J, Moody DB, Lipid and small-molecule display by CD1 and MR1. Nat. Rev. Immunol 15, 643–654 (2015). - PMC - PubMed
    1. Riegert P, Wanner V, Bahram S, Genomics, isoforms, expression, and phylogeny of the MHC class I-related MR1 gene. J. Immunol 161, 4066–4077 (1998). - PubMed
    1. Gold MC, Cerri S, Smyk-Pearson S, Cansler ME, Vogt TM, Delepine J, Winata E, Swarbrick GM, Chua WJ, Yu YYL, Lantz O, Cook MS, Null MD, Jacoby DB, Harriff MJ, Lewinsohn DA, Hansen TH, Lewinsohn DM, Human mucosal associated invariant T cells detect bacterially infected cells. PLOS Biol. 8, e1000407 (2010). - PMC - PubMed
    1. Le Bourhis L, Martin E, Péguillet I, Guihot A, Froux N, Coré M, Lévy E, Dusseaux M, Meyssonnier V, Premel V, Ngo C, Riteau B, Duban L, Robert D, Huang S, Rottman M, Soudais C, Lantz O, Antimicrobial activity of mucosal-associated invariant T cells. Nat. Immunol 11, 701–708 (2010). - PubMed
    1. Dusseaux M, Martin E, Serriari N, Péguillet I, Premel V, Louis D, Milder M, Le Bourhis L, Soudais C, Treiner E, Lantz O, Human MAIT cells are xenobiotic-resistant, tissue-targeted, CD161hi IL-17-secreting T cells. Blood 117, 1250–1259 (2011). - PubMed

Publication types

MeSH terms