. 2018 Jul 13;8(1):10600.
doi: 10.1038/s41598-018-28855-3.

Calcium-activated chloride channels clamp odor-evoked spike activity in olfactory receptor neurons

Affiliations

Calcium-activated chloride channels clamp odor-evoked spike activity in olfactory receptor neurons

Joseph D Zak et al. Sci Rep. .

Abstract

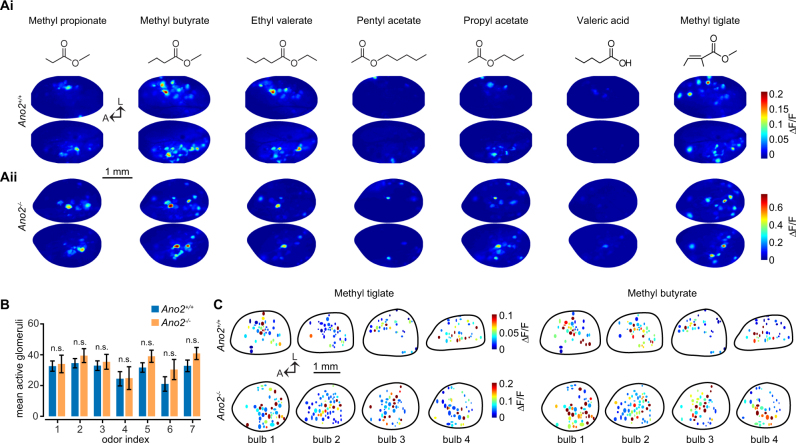
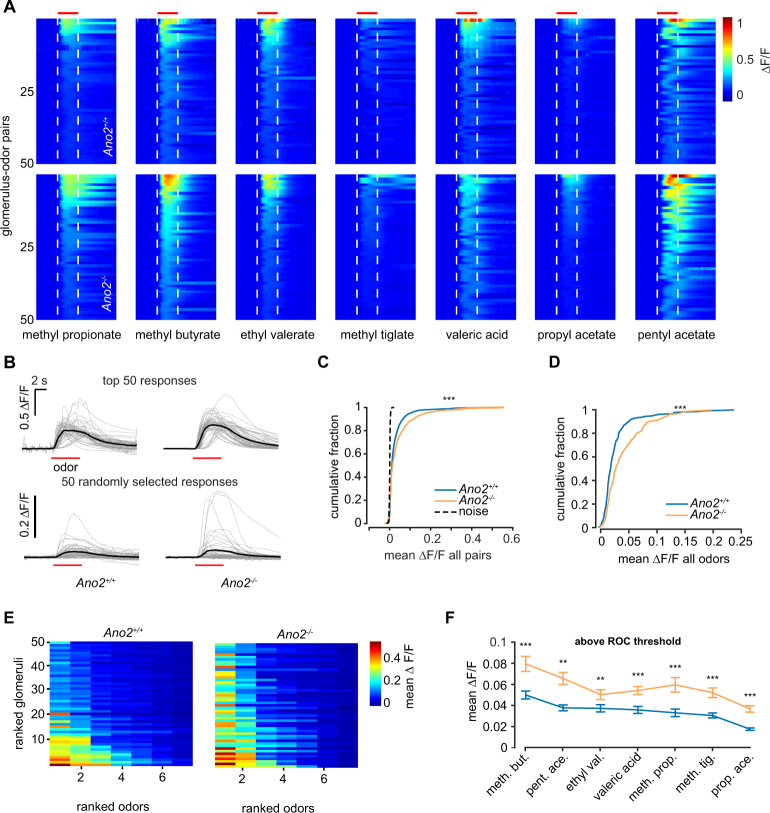
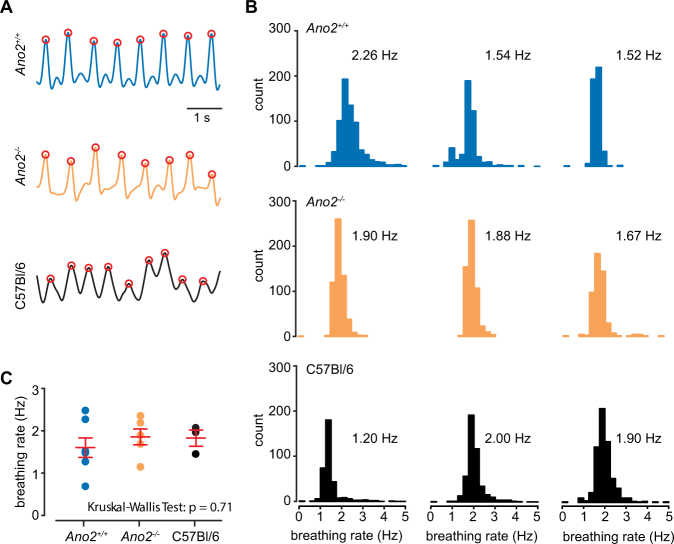
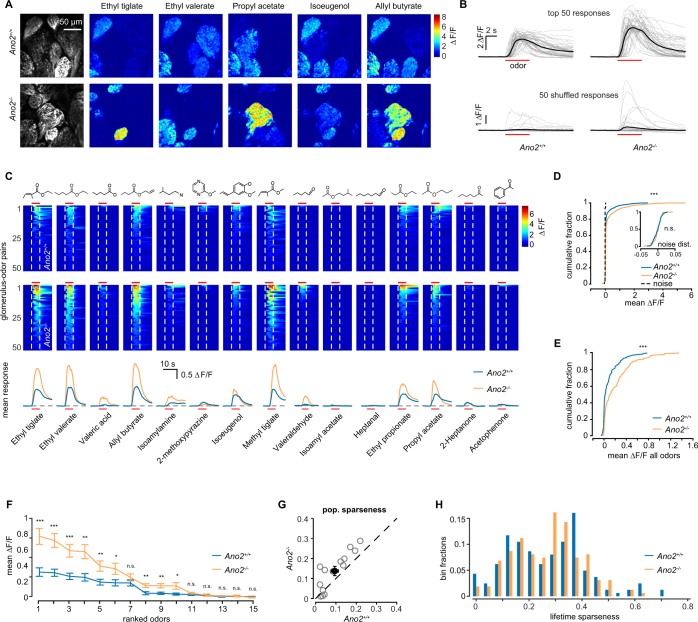
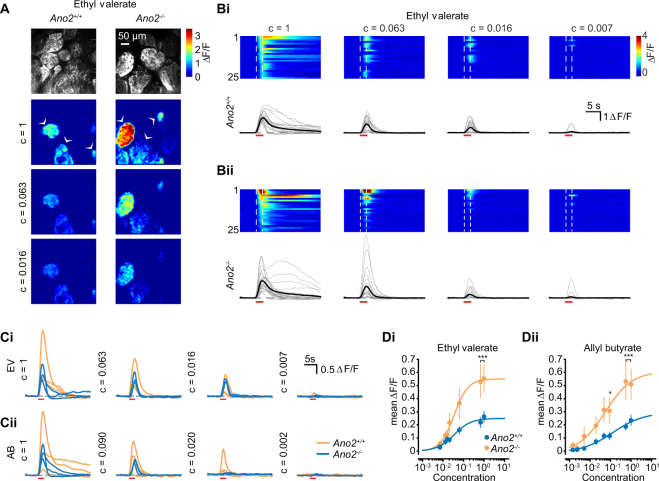
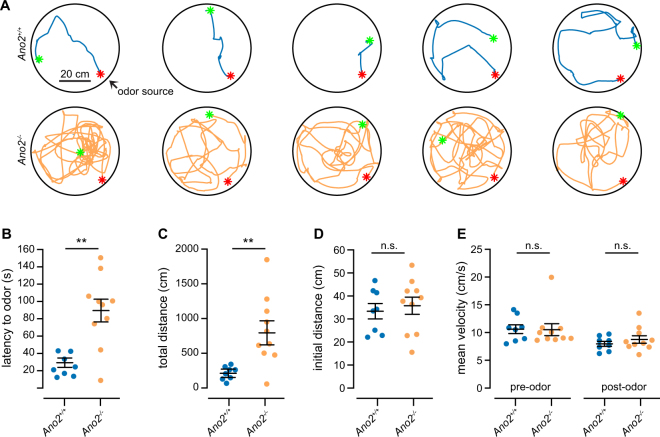
The calcium-activated chloride channel anoctamin-2 (Ano2) is thought to amplify transduction currents in olfactory receptor neurons (ORNs), a hypothesis supported by previous studies in dissociated neurons from Ano2-/- mice. Paradoxically, despite a reduction in transduction currents in Ano2-/- ORNs, their spike output for odor stimuli may be higher. We examined the role of Ano2 in ORNs in their native environment in freely breathing mice by imaging activity in ORN axons as they arrive in the olfactory bulb glomeruli. Odor-evoked responses in ORN axons of Ano2-/- animals were consistently larger for a variety of odorants and concentrations. In an open arena, Ano2-/- animals took longer to approach a localized odor source than Ano2+/+ animals, revealing clear olfactory behavioral deficits. Our studies provide the first in vivo evidence toward an alternative or additional role for Ano2 in the olfactory transduction cascade, where it may serve as a feedback mechanism to clamp ORN spike output.


Conflict of interest statement

The authors declare no competing interests.

Figures

Figure 1
Figure 1
Functional maps of ORN activity. Ai-Aii. Example functional maps for seven unique odors in a representative Ano2+/+ (top) and Ano2−/− (bottom) animal. Molecular structures of the odors in the panel are depicted above. (B) Number of glomeruli per bulb (n = 11 Ano2+/+ bulbs, n = 5 Ano2−/− bulbs) responding to each of the seven odors above ROC threshold (threshold = 0.005 ΔF/F; p > 0.05, Wilcoxon rank-sum test with Bonferroni multiple comparison correction). (C) Example functional maps from four Ano2+/+ and Ano2−/− bulbs each for two different, but related odors. Glomeruli are represented as pseudocolored ellipses. The position of each ellipse reflects the location of a glomerulus within one olfactory bulb hemisphere. The black line designates the boundary of the imaged region of each olfactory bulb.
Figure 2
Figure 2
Odor responses in Ano2−/− and Ano2+/+ mice. (A) The 50 largest odor-evoked Ca2+ signals across all animals for each of the seven odors in both groups. Dashed lines and red bar indicate odor delivery period. Data are sorted by the largest mean response during odor delivery. (B) Traces of the 50 largest (top) Ca2+ responses for Ano2+/+ and Ano2−/− animals across all odors and 50 randomly selected responses (bottom). (C) Cumulative distribution of the mean Ca2+ response in the odor period across all glomerulus-odor pairs (n = 2093 Ano2+/+ and 1526 Ano2−/− glomerulus-odor pairs, p < 0.001 Kolmogorov–Smirnov test). (D) Cumulative distribution of the mean Ca2+ response across all odors at each glomerulus (n = 299 Ano2+/+ glomeruli and 218 Ano2−/− glomeruli, p < 0.001, Kolmogorov–Smirnov test). (E) The top 50 glomeruli ranked by mean response across all odors and further ranked by individual odor responses for Ano2+/+ (right) and Ano2−/− (left) animals. (F) Mean response of all glomeruli responding above ROC-defined threshold (threshold = 0.005 ΔF/F, Wilcoxon rank-sum test with Bonferroni correction, *p < 0.05, **p < 0.01, ***p < 0.001).
Figure 3
Figure 3
Loss of Ano2 does not impact respiration rate. (A) Example respiration traces from a Ano2+/+, Ano2−/− and C57BL/6 J animals recorded with a thermocouple placed near the animal’s nose (see Supplemental Fig. 2 for technique validation). (B) Histograms of the instantaneous respiration frequency in a 5-minute window from three representative animals from each group. Mean instantaneous frequency is displayed next to each plot. (C) Mean instantaneous frequency for all animals in each group. Red bars denote mean and standard error across all animals (p = 0.71, Kruskal-Wallis test).
Figure 4
Figure 4
Calcium responses in ORNs measured with multiphoton microscopy. (A) Example multiphoton-acquired images of glomeruli from an example Ano2+/+ and Ano2−/− animal, as well as example ΔF/F responses for five selected odors. Mean images from 20 frames preceding and during the odor delivery period were used. (B) Traces of the 50 largest (top) Ca2+ responses for Ano2+/+ and Ano2−/− animals across all odors and 50 randomly selected responses (bottom). (C) The 50 largest odor-evoked Ca2+ signals across all animals for each of 15 odors. Dashed line denotes odor onset and offset and red bar indicates odor duration. Molecular structures are depicted above. Bottom, mean response time course for each odor. (D) Cumulative distribution of the mean Ca2+ response in the odor period across all glomerulus-odor pairs (n = 2430 Ano2+/+ and 2415 Ano2−/− glomerulus-odor pairs, p < 0.001, Kolmogorov–Smirnov test). Inset, distribution of blank odor trial responses used to determine ROC threshold (threshold = 0.02 n = 162 Ano2+/+ and 161 Ano2−/− glomeruli, p > 0.05, Kolmogorov–Smirnov test). (E) Cumulative distribution of the mean Ca2+ response across all odors at each glomerulus (n = 162 Ano2+/+ and 161 Ano2−/− glomeruli, p < 0.001, Kolmogorov–Smirnov test). (F). Mean response of all glomeruli responding above threshold for each odor (Wilcoxon rank-sum test with Bonferroni correction, *p < 0.05, **p < 0.01, ***p < 0.001). (G) Scatter plot of population sparseness for each odor. Mean across all odors is the filled black circle (mean sparseness = 0.09 ± 0.02 in Ano2+/+ and 0.13 ± 0.02 in Ano2−/−, p = 0.002, Wilcoxon sign-rank test). (H) Histogram of lifetime sparseness across all glomeruli (mean sparseness = 0.28 ± 0.01 in Ano2+/+ and 0.28 ± 0.01 in Ano2−/−, p = 0.89, Wilcoxon rank-sum test.
Figure 5
Figure 5
ORN responses in Ano2−/− animals are enhanced at high odor concentrations. (A) Example multiphoton-acquired images of glomeruli and ΔF/F responses at three odor concentrations. Odor concentrations were normalized to the highest concentration (~10% v/v) using a photoionization detector (see Supplemental Fig. 4). (Bi-ii) Examples of the 25 largest responses to the highest concentration of Ethyl valerate followed through four other concentrations for Ano2+/+ (top) and Ano2-/- (bottom) animals. Individual traces are displayed below. Dashed line denotes odor onset and offset, red bar indicates odor period. (Ci-ii) Example traces from three glomeruli in part A, identified by arrowheads followed through four concentrations of Ethyl valerate (EV; top) and Allyl butyrate (AB; bottom) Di-ii. Mean response (filled circles) at eight odor concentrations for both odors and sigmoidal fit to each (Wilcoxon rank-sum, *p < 0.05, **p < 0.01, ***p < 0.001).
Figure 6
Figure 6
Latency to odor localization is increased in Ano2−/− animals. (A) Examples of five Ano2+/+ and Ano2−/− animals tracking to the source of odorized air carrying a 1% dilution of peanut oil. Green and red asterisks mark the initial and final position of each animal. (B) Time latency for animals to locate the odor source (n = 8 Ano2+/+ and 10 Ano2−/− animals, p = 0.003, Wilcoxon rank-sum test). (C) Total distance traveled before finding the odor source across all animals (p = 0.002, Wilcoxon rank-sum test). (D) Initial distance from odor source (at odor onset) across all animals (p > 0.05, Wilcoxon rank-sum test). (E) Mean velocity of each animal prior to and following odor onset (p > 0.05, Wilcoxon rank-sum test).

References

    1. Schild D, Restrepo D. Transduction mechanisms in vertebrate olfactory receptor cells. Physiol.Rev. 1998;78:429–466. doi: 10.1152/physrev.1998.78.2.429. - DOI - PubMed
    1. Kleene SJ, Gesteland RC. Calcium-activated chloride conductance in frog olfactory cilia. J. Neurosci. 1991;11:3624–9. doi: 10.1523/JNEUROSCI.11-11-03624.1991. - DOI - PMC - PubMed
    1. Lowe G, Gold GH. Nonlinear amplification by calcium-dependent chloride channels in olfactory receptor cells. Nature. 1993;366:283–6. doi: 10.1038/366283a0. - DOI - PubMed
    1. Firestein S, Shepherd GM. Interaction of anionic and cationic currents leads to a voltage dependence in the odor response of olfactory receptor neurons. J Neurophysiol. 1995;73:562–567. doi: 10.1152/jn.1995.73.2.562. - DOI - PubMed
    1. Kleene SJ. High-gain, low-noise amplification in olfactory transduction. Biophys. J. 1997;73:1110–7. doi: 10.1016/S0006-3495(97)78143-8. - DOI - PMC - PubMed

Publication types

LinkOut - more resources