. 2018 Jul 13;9(1):2724.
doi: 10.1038/s41467-018-05072-0.

Co-expression of CD39 and CD103 identifies tumor-reactive CD8 T cells in human solid tumors

Affiliations

Co-expression of CD39 and CD103 identifies tumor-reactive CD8 T cells in human solid tumors

Thomas Duhen et al. Nat Commun. .

Abstract

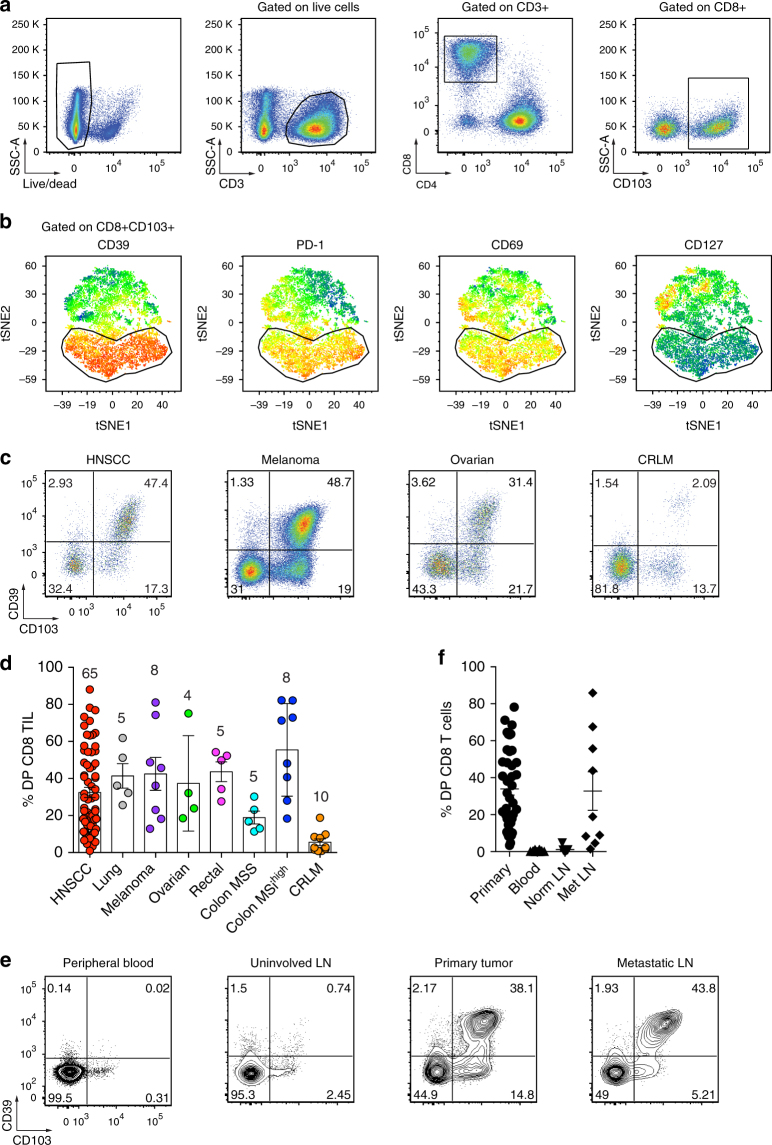
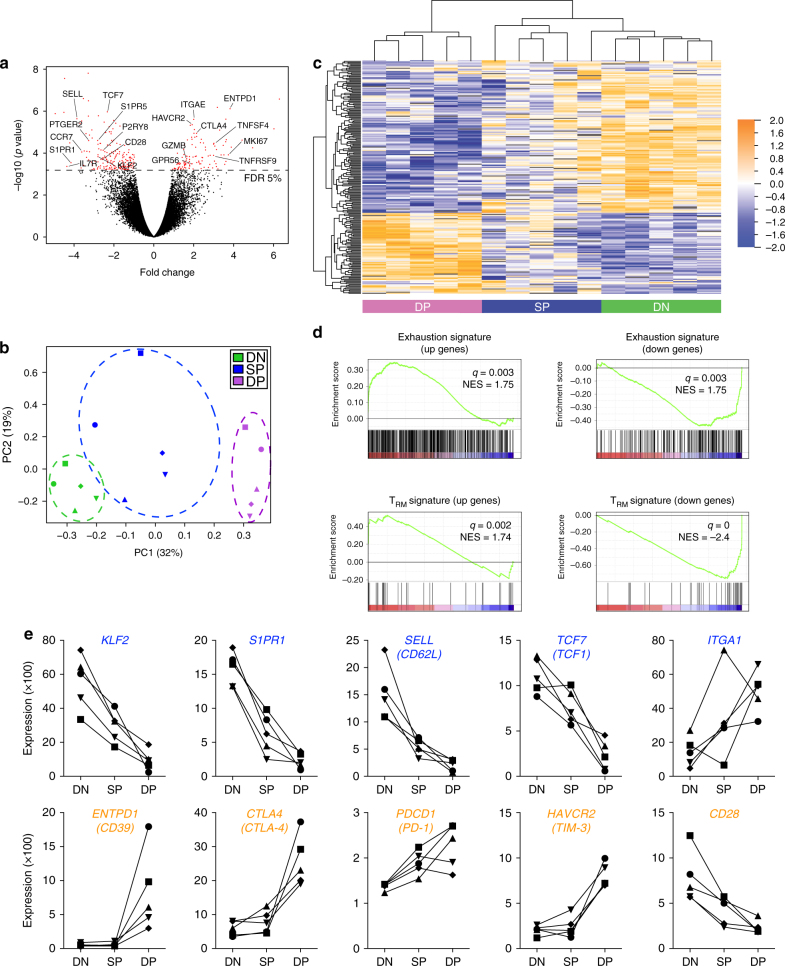
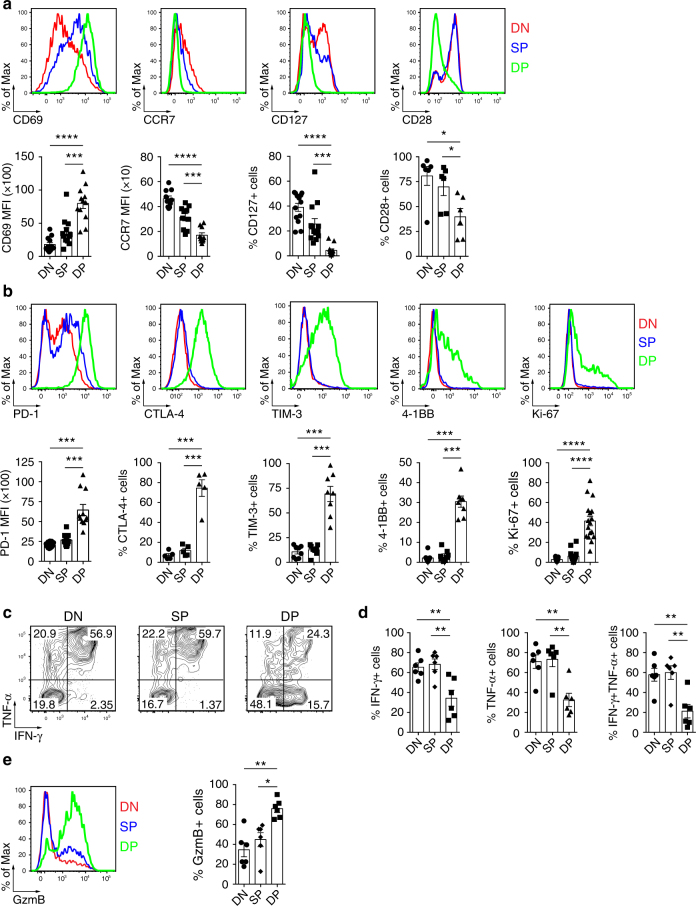
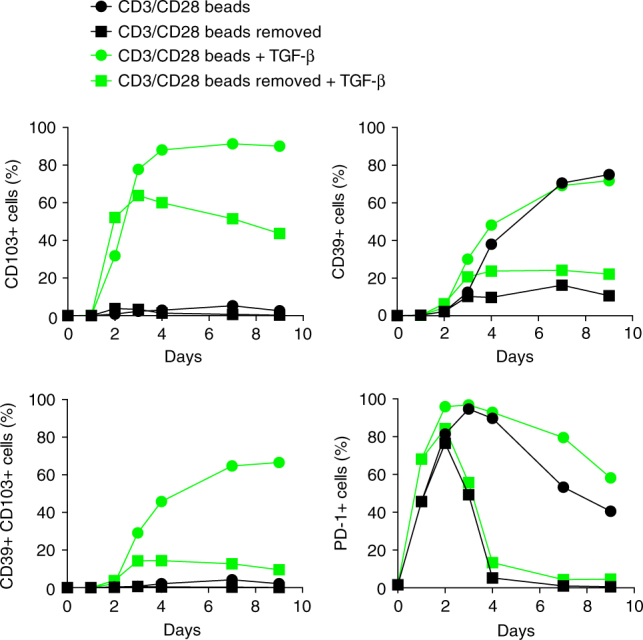
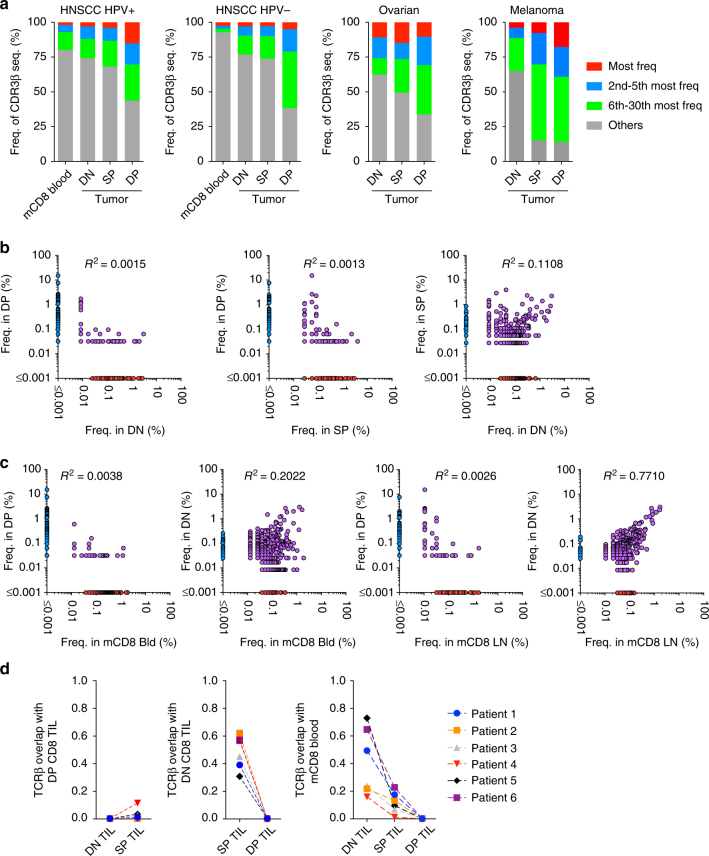
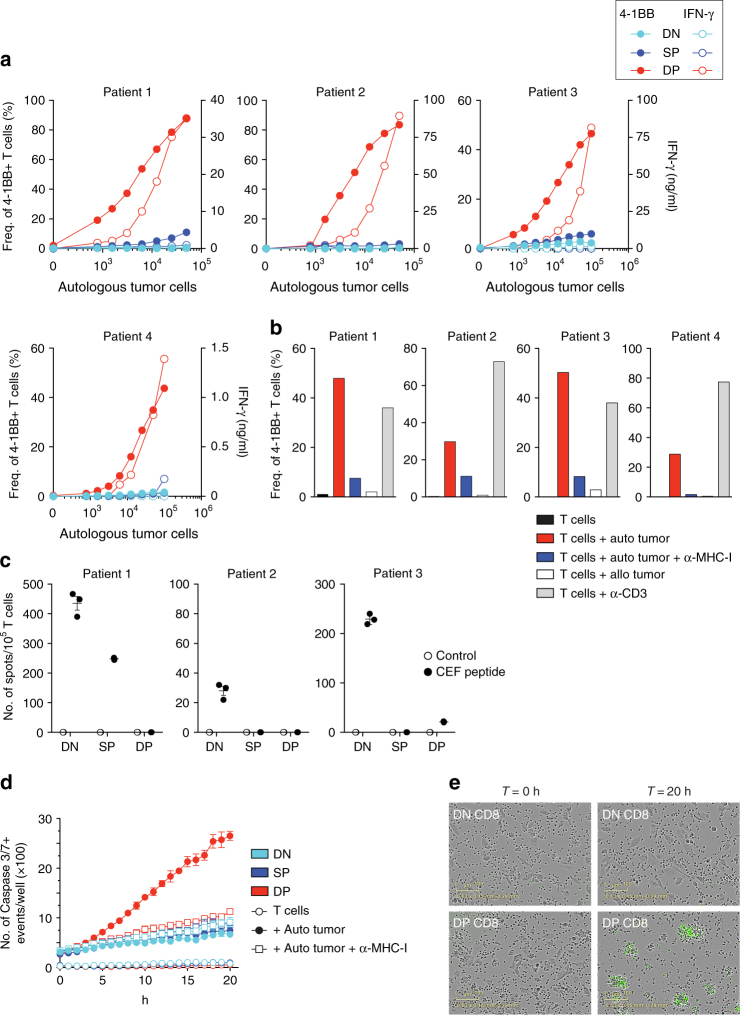
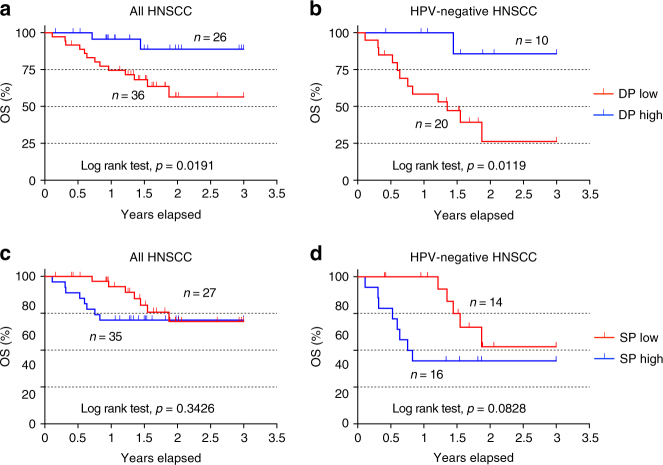
Identifying tumor antigen-specific T cells from cancer patients has important implications for immunotherapy diagnostics and therapeutics. Here, we show that CD103+CD39+ tumor-infiltrating CD8 T cells (CD8 TIL) are enriched for tumor-reactive cells both in primary and metastatic tumors. This CD8 TIL subset is found across six different malignancies and displays an exhausted tissue-resident memory phenotype. CD103+CD39+ CD8 TILs have a distinct T-cell receptor (TCR) repertoire, with T-cell clones expanded in the tumor but present at low frequencies in the periphery. CD103+CD39+ CD8 TILs also efficiently kill autologous tumor cells in a MHC-class I-dependent manner. Finally, higher frequencies of CD103+CD39+ CD8 TILs in patients with head and neck cancer are associated with better overall survival. Our data thus describe an approach for detecting tumor-reactive CD8 TILs that will help define mechanisms of existing immunotherapy treatments, and may lead to future adoptive T-cell cancer therapies.


Conflict of interest statement

T.D., R.D., R.M. and A.D.W. disclose that they have submitted a patent regarding therapeutic and diagnostic use of these cells in cancer patients. The remaining authors declare no competing interests.

Figures

Fig. 1
Fig. 1
Tumor-infiltrating CD103+ CD8 T cells coexpress the ectonucleotidase CD39. a Representative gating strategy for the flow cytometric analysis of tumor-infiltrating CD8 T cells (CD8 TIL) for a HNSCC patient. Numbers in plots indicate the percent cells in respective gates. b viSNE analysis of CD103+ CD8 TILs as shown in a. The gate identifies the CD103+ CD8 T cells with the highest expression of CD39. The gate is applied to all plots showing expression levels of PD-1, CD69, and CD127. c Flow cytometric analysis of CD8 TIL isolated from representative HNSCC, melanoma, ovarian cancer, and CRLM patients. Numbers in each quadrant indicate percent cells positive for CD39 and/or CD103 on CD3+CD8+ T cells. d Summary of the frequency of CD39+CD103+ (DP) CD8 TILs among patients with different solid malignancies. Shown are 65 HNSCC, 5 lung cancers, 8 melanomas, 4 ovarian cancers, 5 rectal cancers, 5 MSS colon cancers, 8 MSIhigh colon cancers, and 10 CRLM. e Flow cytometric analysis of the percentage of DP CD8 T cells in peripheral blood, uninvolved LN, primary tumor, and metastatic LN from a representative HNSCC patient. Numbers in each quadrant indicate percent cells positive for CD39 and/or CD103 on CD3+CD8+ T cells. Data are representative of 41 HNSCC patients analyzed (7 patients for uninvolved LN and 9 patients for Met LN). Percentages are summarized in f. Small horizontal lines indicate mean ± SEM
Fig. 2
Fig. 2
Gene-expression analysis of DP CD8 TILs reveals an exhausted profile and a gene signature reminiscent of TRM cells. a Volcano plot showing differential gene expression of the DP vs. DN CD8 T-cell subsets (log2-transformed). The dashed line delineates the differentially expressed genes (red dots) when using a false-discovery rate (FDR) <5%. b PCA of the 219 differentially expressed genes between the DP and DN CD8 TILs with a FDR <5% among all three subsets. Dots indicate samples of the three different populations from a total of five patients. PCA 1 and 2 represents the largest source of variation, combined accounting for 51%. Each symbol represents one patient. c Unsupervised clustering of the 219 differentially expressed genes between DP and DN CD8 on all three subsets of CD8 TIL from five patients. Blue color indicates downregulated genes, orange indicates upregulated genes. d GSEA of “T-cell exhaustion” and “TRM” gene sets in the transcriptome of DP CD8 vs. that of DN CD8 TILs, presented as the normalized enrichment score (NES). e Examples of differentially expressed genes between DP CD8 and DN CD8 TILs present in the “TRM” (blue) or the “T-cell exhaustion” (orange) gene sets. Each symbol/line represents one patient, which is connected by a line
Fig. 3
Fig. 3
Phenotypic and functional properties of DP, SP and DN CD8 TILs. a Ex vivo phenotypic analysis of the expression of surface proteins CD69, CCR7, CD127, and CD28, delineating a TRM phenotype, on the three CD8 TIL subsets (top, one representative patient shown, colors match key). Summary of the frequency/expression level of the above-mentioned markers among several cancer patients (n = 12 for CD69; n = 10 for CCR7; n = 13 for CD127; and n = 6 for CD28, bottom). Each dot represents one patient. b Ex vivo phenotypic analysis of the expression of surface and intracellular proteins PD-1, CTLA-4, TIM-3, 4-1BB, and Ki-67, delineating an activated/chronically stimulated phenotype, on the three CD8 TIL subsets (top, one representative patient shown, colors match key). Summary of the frequency of the above-mentioned markers among several cancer patients (n = 11 for PD-1; n = 5 for CTLA-4; n = 8 for TIM-3; n = 8 for 4-1BB; and n = 17 for Ki-67, bottom). Each dot represents one patient. c Representative flow cytometric analysis of IFN-γ and TNF-α production by the three CD8 TIL subsets stimulated for 4 h with Phorbol 12-Myristate 13-Acetate (PMA)/ionomycin. Numbers in each quadrant indicate percent cells positive for IFN-γ and/or TNF-α for each subset. d Frequency of IFN-γ, TNF-α, IFN-γ/TNF-α double-positive cells by each CD8 TIL subsets. Data are from 6 HNSCC patients. e Representative flow cytometric analysis of granzyme B production by CD8 TIL subsets (left, colors match key) and summary of six different HNSCC patients (right). Small horizontal lines indicate mean ± SEM; *p < 0.05; **p < 0.01; ***p < 0.001; ****p < 0.0001; p-values were determined by one-way analysis of variance with Tukey’s post hoc testing (a, b, d, e)
Fig. 4
Fig. 4
TGF-β and sustained TCR stimulation are required for CD103 and CD39 upregulation on CD8 T cells. Kinetics of CD39, CD103, and PD-1 expression on sorted naive CD8 T cells from peripheral blood after in vitro activation. Cells were stimulated with CD3/CD28-coated beads at a bead:T-cell ratio of 1:2 in the presence or absence of TGF-β1 (2 ng/ml), and expression of CD39, CD103, and PD-1 was analyzed by flow cytometry at the indicated time points. Data are from one representative healthy donor
Fig. 5
Fig. 5
DP CD8 T cells are highly clonal and share little overlap with other CD8 TILs or peripheral CD8 T cells. a Diversity of the TCRβ repertoire within blood memory CD8 T cells, DN, SP, and DP CD8 TILs. The frequencies of the most frequent clonotype, the 2nd to 5th most frequent, the 6th to 30th most frequent, and the rest of the clonotypes (others) are shown for a HPV-positive HNSCC patient, a HPV-negative HNSCC patient, an ovarian cancer patient, and a melanoma patient. b The 500 most frequent CD8 TIL clonotypes for each subset are plotted based on their frequency in DN, SP, and DP CD8 TILs. Each dot represents a distinct TCR clonotype. Dots on the axis indicate the clonotypes detected within a single repertoire; purple dots indicate clonotypes shared between two CD8 T-cell populations. c Same analysis as in b comparing the frequency of the top 500 clones in memory CD8 T cells in peripheral blood and uninvolved LN to the frequency in DN and DP CD8 TIL subsets. d Similarity between the TCR repertoires of CD8 T-cell subsets was measured using the Morisita–Horn index on six cancer patients connected with a dashed line
Fig. 6
Fig. 6
DP CD8 TILs recognize and kill autologous tumor cells. DN, SP, and DP CD8 TILs were sorted from tumor digest and expanded in vitro. a Expanded CD8 TILs were tested for tumor reactivity by cultivating them for 20 h with increasing numbers of autologous tumor cells, and tumor recognition was assessed by measuring the frequency of 4-1BB expression (filled symbols) and IFN-γ secretion (open symbols). Results are shown for four melanoma patients. b Reactivity of DP CD8 TILs was confirmed by culture with autologous tumor cells with and without MHC-I blocking antibody, allogeneic tumor cells, and plate-bound anti-CD3. The upregulation of 4-1BB after 20 h is shown for four melanoma patients. c The reactivity of expanded DN, SP, and DP CD8 TILs against a pool of 32 peptides derived from EBV, CMV, and influenza virus was assessed by measuring IFN-γ secretion by ELISPOT. Experiments were performed in triplicate and results are shown for three melanoma patients. All TIL sub-populations showed similar levels of IFN-γ when stimulated with anti-CD3. d Expanded DN, SP, and DP CD8 TILs were cultured with and without autologous tumor cells, in presence and absence of MHC-I blocking antibody. Caspase 3/7+ events (green fluorescence) were monitored every hour with the Incucyte live-cell imaging system over a 20 h period and analyzed as described in the Methods section. Small horizontal lines indicate the mean ± SEM. e Representative images for DN and DP CD8 T cells taken at the beginning (T = 0) and at the end of the co-culture with autologous tumor cells (T = 20 h). Green fluorescence indicates caspase 3/7 activity. Results shown in d and e are representative of two patients
Fig. 7
Fig. 7
High frequency of DP CD8 TILs is associated with better overall survival in a cohort of HNSCC patients. Following surgery, the frequency of DP (a, b) and SP (c, d) CD8 T cells among total CD8 TILs was determined within the primary tumor by flow cytometry. a HNSCC patients (n = 62) were segregated based on the frequency of the DP CD8 T cells, with DP high and DP low groups stratified above or below the mean frequency (32.9%) followed by Kaplan–Meier analysis. b Similar analysis performed on the HPV-negative HNSCC patients (n = 30). c HNSCC patients (n = 62) were segregated based on the frequency of the SP CD8 T cells, with SP high and SP low groups stratified above or below the mean frequency (18%) followed by Kaplan–Meier analysis. d Similar analysis performed on the HPV-negative HNSCC patients (n = 30). The log-rank test was used to compare curves and p-values <0.05 were considered significant

References

    1. Hinrichs CS, Rosenberg SA. Exploiting the curative potential of adoptive T-cell therapy for cancer. Immunol. Rev. 2014;257:56–71. doi: 10.1111/imr.12132. - DOI - PMC - PubMed
    1. Sadelain M, Riviere I, Riddell S. Therapeutic T cell engineering. Nature. 2017;545:423–431. doi: 10.1038/nature22395. - DOI - PMC - PubMed
    1. Klebanoff CA, Gattinoni L, Restifo NP. CD8+ T-cell memory in tumor immunology and immunotherapy. Immunol. Rev. 2006;211:214–224. doi: 10.1111/j.0105-2896.2006.00391.x. - DOI - PMC - PubMed
    1. Finn OJ. Human tumor antigens yesterday, today, and tomorrow. Cancer Immunol. Res. 2017;5:347–354. doi: 10.1158/2326-6066.CIR-17-0112. - DOI - PMC - PubMed
    1. Gros A, et al. PD-1 identifies the patient-specific CD8(+) tumor-reactive repertoire infiltrating human tumors. J. Clin. Invest. 2014;124:2246–2259. doi: 10.1172/JCI73639. - DOI - PMC - PubMed

Publication types

MeSH terms