. 2018 Jul 13;9(1):2702.
doi: 10.1038/s41467-018-05093-9.

ATP synthase F1 subunits recruited to centromeres by CENP-A are required for male meiosis

Affiliations

ATP synthase F1 subunits recruited to centromeres by CENP-A are required for male meiosis

Caitríona M Collins et al. Nat Commun. .

Abstract

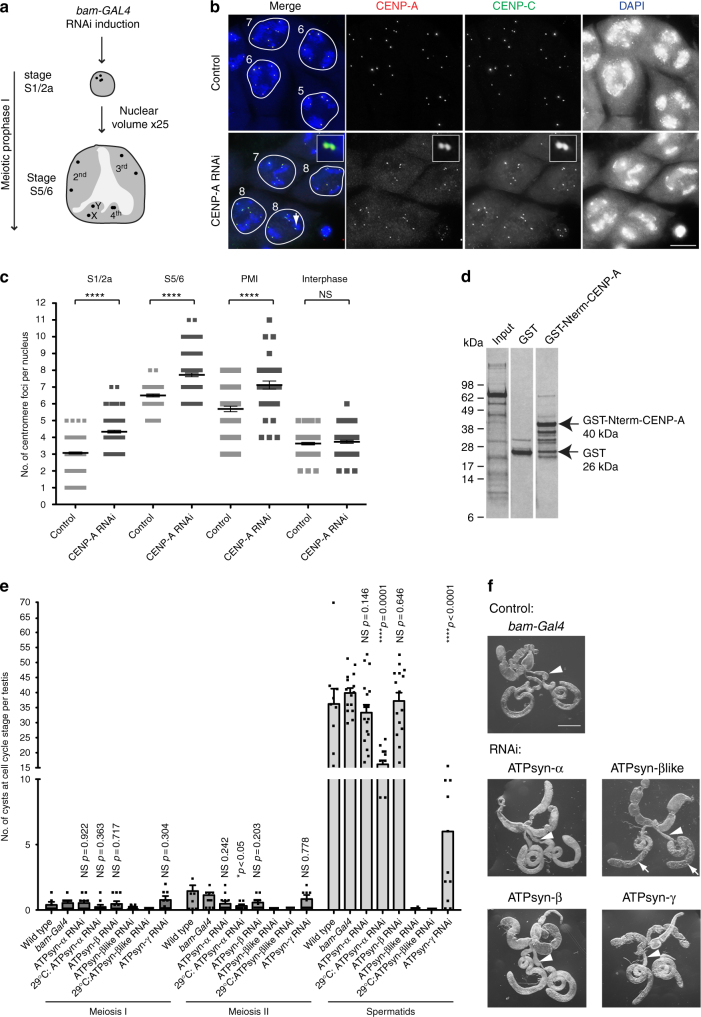
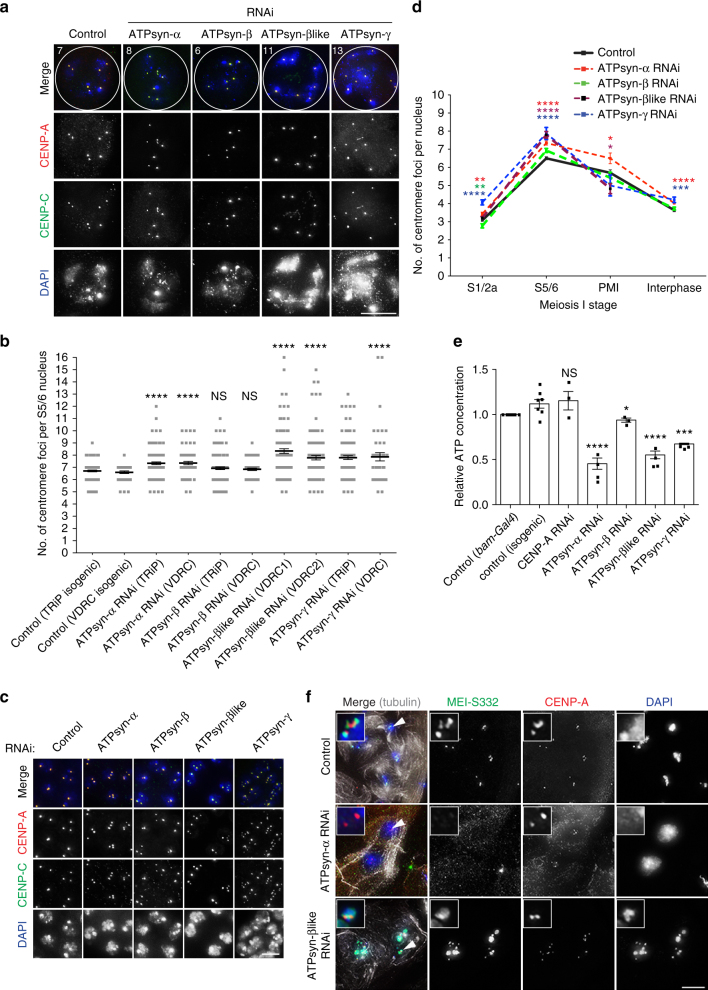
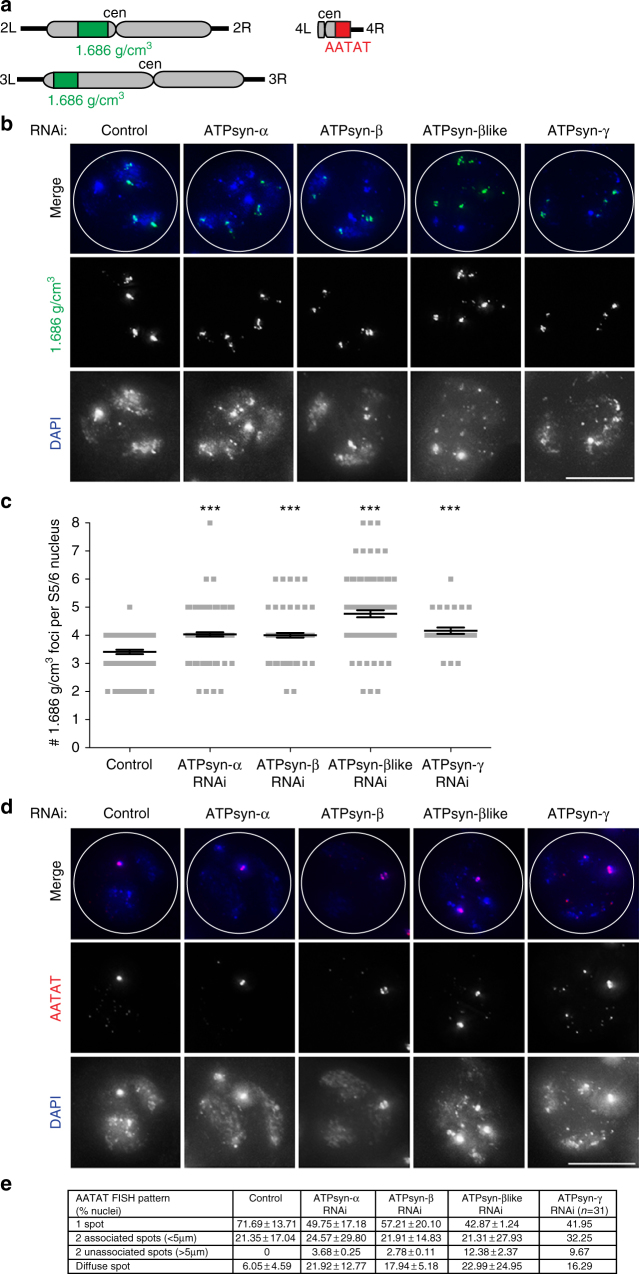
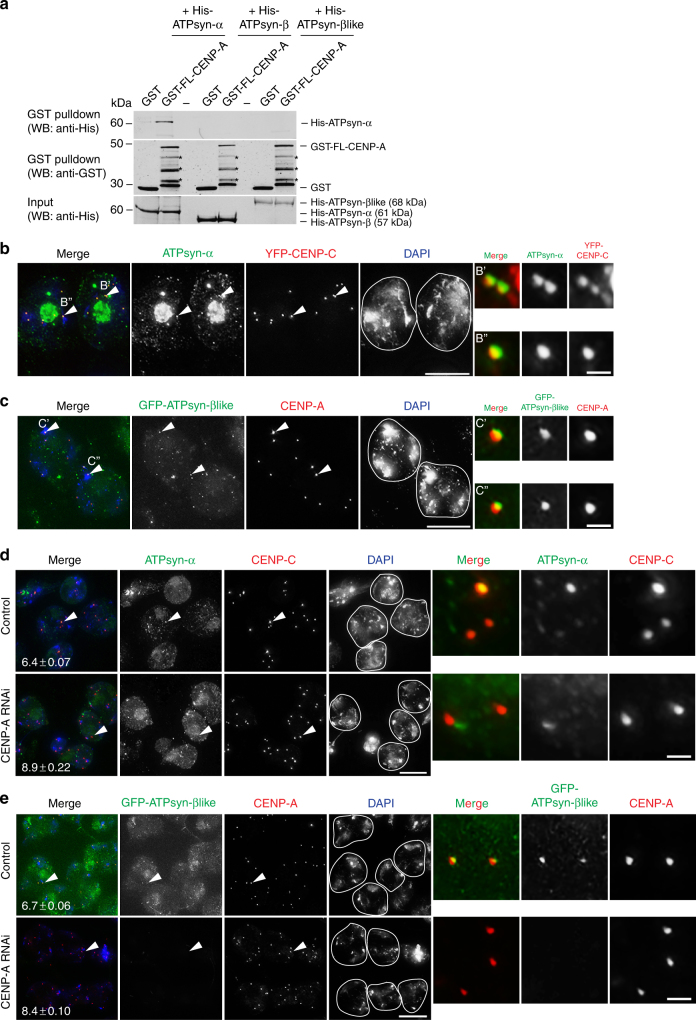
The histone H3 variant CENP-A epigenetically defines the centromere and is critical for chromosome segregation. Here we report an interaction between CENP-A and subunits of the mitochondrial ATP synthase complex in the germline of male Drosophila. Furthermore, we report that knockdown of CENP-A, as well as subunits ATPsyn-α, -βlike (a testis-specific paralogue of ATPsyn-β) and -γ disrupts sister centromere cohesion in meiotic prophase I. We find that this disruption is likely independent of reduced ATP levels. We identify that ATPsyn-α and -βlike localise to meiotic centromeres and that this localisation is dependent on the presence of CENP-A. We show that ATPsyn-α directly interacts with the N-terminus of CENP-A in vitro and that truncation of its N terminus perturbs sister centromere cohesion in prophase I. We propose that the CENP-A N-terminus recruits ATPsyn-α and -βlike to centromeres to promote sister centromere cohesion in a nuclear function that is independent of oxidative phosphorylation.


Conflict of interest statement

The authors declare no competing interests.

Figures

Fig. 1
Fig. 1
Knockdown of CENP-A and ATP synthase F1 subunits in testis. a Cartoon of the typical nuclear morphology of meiotic prophase I S1/2a and S5/6 stage spermatocytes showing autosomal and sex chromosome territories (grey) and associated centromeres (black foci). Timing of the bam-GAL4 driven RNAi is indicated. b Immuno-fluorescent micrograph of control (isogenic) S5/6 nuclei or nuclei RNAi-depleted of CENP-A (at 25 °C) stained with antibodies against CENP-A (red) and CENP-C (green) (n = 3). DNA is stained with DAPI (blue). Numbers indicate centromere foci per nucleus; inset shows two spots (indicated by white arrow) typically counted as two individual centromere foci. Scale bar = 10 μm. c Quantitation of centromere foci in control nuclei or nuclei RNAi-depleted of CENP-A (at 25 °C) at S1/2a, S5/6, prometaphase (PMI) or interphase stages of meiosis I. Data pooled from two independent experiments, 50 nuclei quantified per experiment. Error bars = SEM. The data were analysed using an unpaired Student's t-test, ****p < 0.0001, NS = not significant, p > 0.05. d Silver-stained SDS-PAGE gel showing input, GST only and GST-Nterm-CENP-A pull-down fractions. Arrows indicate molecular weights of GST and GST-Nterm-CENP-A in kilodaltons (kDa). e Quantitation of cysts at respective cell cycle stages (meiosis I, II or spermatids) in wild type (TRiP isogenic) or bam-Gal4 control adult testes (n = 18) or testes in which ATPsyn-α (n = 17), -β (n = 15), -βlike (n = 13) and –γ (n = 12) is RNAi-depleted at 25 °C or 29 °C. Data pooled from two individual RNAi experiments; significance tests were carried out using pooled controls (wild type and bam-Gal4). Error bars = SEM. The data were analysed using an unpaired Student's t-test, NS = not significant. f Bright-field micrograph of 5 day old control adult testis (bam-Gal4) or testis RNAi-depleted of ATPsyn-α, -β, βlike and –γ at 25 °C (n = 3). Arrowheads indicate seminal vesicles and arrows indicate abnormal testis morphology. Scale bar = 500 μm
Fig. 2
Fig. 2
Centromere defects upon ATP synthase-α/-β/-βlike/-γ RNAi. a Immuno-fluorescent micrograph of control S5/6 nuclei or nuclei RNAi-depleted of ATPsyn-α, -β, -βlike and –γ (at 25 °C) stained with antibodies against CENP-A (red) and CENP-C (green) (n = 3). DNA is stained with DAPI (blue). Numbers indicate centromere foci per nucleus. Scale bar = 10 μm. b Quantitation of centromere foci per control S5/6 nucleus or nucleus RNAi-depleted of ATPsyn-α, -β, -βlike and –γ (at 25 °C). For each RNAi sample, p-values were calculated compared to respective TRiP or VDRC isogenic controls using an unpaired Student's t-test. The data (n = 100 nuclei) are pooled from three individual experiments. Error bars = SEM. ****p < 0.0001, NS = not significant, p > 0.05. c Immuno-fluorescent micrograph of control S1/2a nuclei or nuclei RNAi-depleted of ATPsyn-α, -β, -βlike and –γ (at 25 °C) stained with antibodies against CENP-A (red) and CENP-C (green) (n = 3). DNA is stained with DAPI (blue). Scale bar = 5 μm. d Line graph showing quantitation of the number of centromere foci per control nucleus or nucleus RNAi-depleted of ATPsyn-α, -β, -βlike and –γ at S1/2a, S5/6, prometaphase (PMI) or interphase stages of meiosis I. The data (n = 100) are pooled from three individual experiments and was analysed using an unpaired Student's t-test, ****p < 0.0001, ***p < 0.001, **p < 0.01 and *p < 0.05. Error bars = SEM. e Relative ATP concentration in control adult testes (isogenic, bam-Gal4) or testes RNAi-depleted (at 25 °C) for CENP-A, ATPsyn-α, -β, -βlike and –γ. T-test compares RNAi knockdowns to isogenic control. Experiments were carried out in triplicate and data are pooled from three independent RNAi experiments. Significance was analysed using an unpaired Student's t-test, ****p < 0.0001, *p < 0.05, NS = not significant p > 0.05. Error bars = SEM. f Immuno-fluorescent micrograph of control nuclei at prometaphase I or perturbed prometaphase I nuclei RNAi-depleted for ATPsyn-α or -βlike stained for MEI-S332 (green), CENP-A (red) and tubulin (grey) (n = 2). DNA is stained with DAPI (blue). Scale bar = 10 μm
Fig. 3
Fig. 3
Arm cohesion defects upon ATP synthase-α/-β/-βlike/-γ RNAi. a Cartoon showing chromosomal location of FISH probes used in the study. The 1.686 g/cm3 satellite probe (green) targets both the second (2 L) and third (3 L) chromosome arms. The AATAT repeat probe (red) targets the fourth (4 R) chromosome arm. b Micrograph of 1.686 g/cm3 FISH probe (green) performed on control S5/6 nuclei or nuclei RNAi-depleted at 25 °C of ATPsyn-α, -β, -βlike and –γ. DNA is stained with DAPI; white circle outlines the nucleus (n = 3). Scale bar = 10 μm. c Quantitation of 1.686 g/cm3 foci in control S5/6 nuclei (n = 81) or nuclei RNAi-depleted for ATPsyn-α (n = 122), -β (n = 95), -βlike (n = 102) and –γ (n = 31). Data pooled from two individual experiments. Significance was determined using an unpaired Student's t-test, ***p < 0.001. Error bars = SEM. d Micrograph of AATAT FISH probe (red) performed on control S5/6 nuclei or nuclei RNAi-depleted of ATPsyn-α, -β, -βlike and -γ. DNA is stained with DAPI; white circle outlines the nucleus (n = 3). Scale bar = 10 μm. e Quantitation (% nuclei ± SD) of the AATAT hybridisation pattern in control S5/6 nuclei or nuclei RNAi-depleted of ATPsyn-α, -β, -βlike (n = 2, 50 nuclei quantified per experiment) and -γ (n = 31 nuclei)
Fig. 4
Fig. 4
ATPsyn-α and ATPsyn-βlike localisation at centromeres. a In vitro pull-down interaction with full-length GST-tagged CENP-A (GST-FL-CENP-A) and His-tagged ATPsyn-α, -β or –βlike revealed by western analysis with an anti-His antibody (n = 3). *GST-FL-CENP-A cleavage products. b Immuno-fluorescent micrograph of prophase S5/6 nuclei from flies expressing YFP-CENP-C (red) co-stained with antibodies against ATPsyn-α (green). DNA is stained with DAPI (blue). Co-localisation was observed in three independent experiments. Scale bar = 15 μm. B′ and B″ indicate centromeres enlarged in inset. Scale bar = 1 μm c Immuno-fluorescent micrograph of prophase S5/6 nuclei from flies expressing GFP-ATPsyn-βlike (green) co-stained with antibodies against CENP-A (red). DNA is stained with DAPI (blue). Co-localisation was observed in three independent experiments. Scale bar = 15 μm. C′ and C″ indicate centromeres enlarged in inset. Scale bar = 1 μm. d Immuno-fluorescent micrograph of adult testis in which CENP-A was RNAi-depleted at 29 °C or controls (TRIP isogenic) stained with antibodies against ATPsyn-α (green) and CENP-C (red) (n = 3). Scale bar = 15 μm. Arrowheads indicate centromeres enlarged in inset. Scale bar = 1 μm. Average number of centromere foci per nucleus ± SEM is marked (n = 100 nuclei, pooled from two experiments). e Immuno-fluorescent micrograph of adult testis from flies expressing GFP-ATPsyn-βlike (green) in which CENP-A was RNAi-depleted at 29 °C or sibling controls stained with antibodies against CENP-A (red) (n = 3). Scale bar = 15 μm. Arrowheads indicate centromeres enlarged in inset. Scale bar = 1 μm. Average number of centromere foci per nucleus ± SEM is marked (n = 100 nuclei, pooled from two experiments)
Fig. 5
Fig. 5
Requirement for CENP-A N terminus in centromere cohesion. a Peptide arrays encompassing the CENP-A N terminus (amino acids 1–126) probed with His-ATPsyn-α, followed by western analysis with an anti-His antibody (n = 3). Schematic of CENP-A N terminus showing position of conserved B1, B2 and B3 domains and histone fold domain. Table displays the amino acid identity of interacting peptides 8, 9, 10 and 19. b Schematic showing the position of GFP between amino acid 118 and 119 of CENP-A in GFP-CENP-A full length and GFP-CENP-A-Δ118 transgenes. c Top: quantitation of the number of centromere foci per S5/6 nucleus from fly lines expressing GFP-CENP-A or GFP-CENP-A-Δ118 (both homozygous insertions) in addition to endogenous CENP-A. Data pooled from three individual RNAi experiments. Significance was determined using an unpaired Student's t-test, ****p < 0.0001, **p < 0.01, *p < 0.05. Error bars = SEM. Bottom: representative images of S5/6 nuclei immuno-stained for CENP-C (red) and CENP-A or GFP (green). White arrowhead indicates two sister centromeres. Number of centromere foci per nucleus is marked. Scale bar = 10 μm

Similar articles

Cited by

References

    1. Hassold T, Hunt P. To err (meiotically) is human: the genesis of human aneuploidy. Nat. Rev. Genet. 2001;2:280–291. doi: 10.1038/35066065. - DOI - PubMed
    1. Allshire RC, Karpen GH. Epigenetic regulation of centromeric chromatin: old dogs, new tricks? Nat. Rev. Genet. 2008;9:923–937. doi: 10.1038/nrg2466. - DOI - PMC - PubMed
    1. Ravi M, et al. Meiosis-specific loading of the centromere-specific histone CENH3 in Arabidopsis thaliana. PLoS Genet. 2011;7:e1002121. doi: 10.1371/journal.pgen.1002121. - DOI - PMC - PubMed
    1. Lermontova I, et al. Knockdown of CENH3 in Arabidopsis reduces mitotic divisions and causes sterility by disturbed meiotic chromosome segregation. Plant J. 2011;68:40–50. doi: 10.1111/j.1365-313X.2011.04664.x. - DOI - PubMed
    1. Ravi M, Chan SW. Haploid plants produced by centromere-mediated genome elimination. Nature. 2010;464:615–618. doi: 10.1038/nature08842. - DOI - PubMed

Publication types

MeSH terms

LinkOut - more resources