Multicenter Study
. 2018 Jul 13;8(1):10635.
doi: 10.1038/s41598-018-28907-8.

Dynamics of Plasma Lipidome in Progression to Islet Autoimmunity and Type 1 Diabetes - Type 1 Diabetes Prediction and Prevention Study (DIPP)

Affiliations
Multicenter Study

Dynamics of Plasma Lipidome in Progression to Islet Autoimmunity and Type 1 Diabetes - Type 1 Diabetes Prediction and Prevention Study (DIPP)

Santosh Lamichhane et al. Sci Rep. .

Abstract

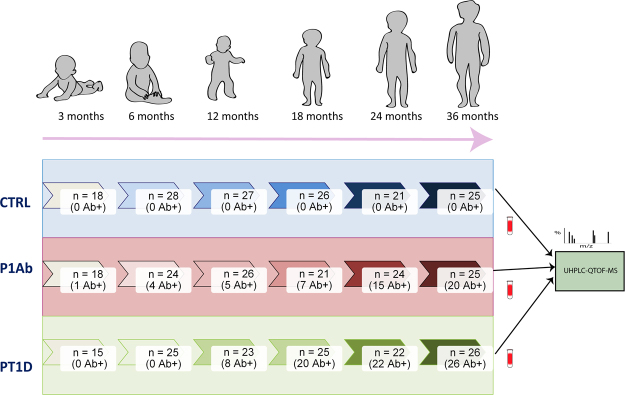
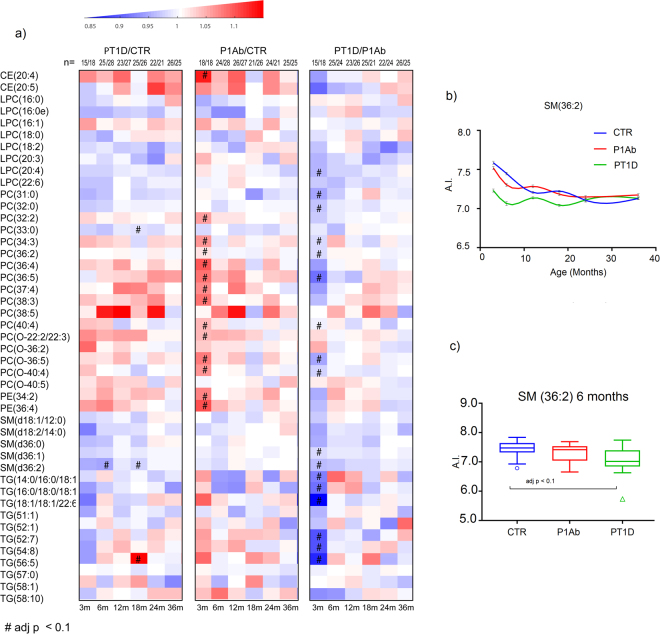
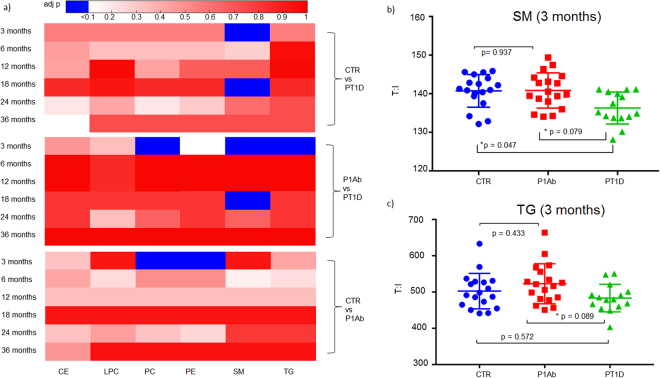
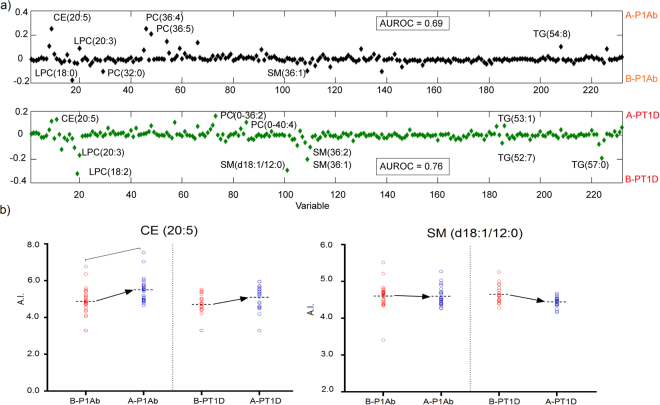
Type 1 diabetes (T1D) is one of the most prevalent autoimmune diseases among children in Western countries. Earlier metabolomics studies suggest that T1D is preceded by dysregulation of lipid metabolism. Here we used a lipidomics approach to analyze molecular lipids in a prospective series of 428 plasma samples from 40 children who progressed to T1D (PT1D), 40 children who developed at least a single islet autoantibody but did not progress to T1D during the follow-up (P1Ab) and 40 matched controls (CTR). Sphingomyelins were found to be persistently downregulated in PT1D when compared to the P1Ab and CTR groups. Triacylglycerols and phosphatidylcholines were mainly downregulated in PT1D as compared to P1Ab at the age of 3 months. Our study suggests that distinct lipidomic signatures characterize children who progressed to islet autoimmunity or overt T1D, which may be helpful in the identification of at-risk children before the initiation of autoimmunity.


Conflict of interest statement

The authors declare no competing interests.

Figures

Figure 1
Figure 1
An overview of the study setting. The plasma samples for lipidomic analysis were obtained from the Finnish Type 1 Diabetes Prevention and Prediction Study (DIPP). The study cohort comprises the samples from three groups: children who progressed to T1D during the follow-up (PT1D), who developed at least a single islet autoantibody but did not progress to T1D during the follow-up (P1Ab), and control (CTR) subjects who remained islet autoantibody negative during the follow-up until the age of 15 years. The three study groups were matched by HLA-associated diabetes risk, gender and period of birth. For each child, longitudinal samples were obtained corresponding to the ages of 3, 6, 12, 18, 24, and 36 months. These age groups were selected with the objective of understanding the dynamics of the lipidome preceding the overt T1D. For each age cohort and study group, number of autoantibody positive children is marked.
Figure 2
Figure 2
Principal component analysis (PCA) score plots and loadings based on ANOVA-simultaneous component analysis (ASCA). (a) Principal component (PC1) score plot obtained based on age score in ASCA analysis. This figure represent the lipidomics dataset arranged according to age in the PCA score plot. Here each sample is represented by a point and colored according to the age (red diamond: 3 month of age, green square: 6 month of age, cyan triangle down: 12 months of age, light yellow circle: 18 months, blue square: 24 months, grey white circle 36 months). These ages of the participants are also marked on the x-axis while y-axis represents the sample score. Samples with similar score are clustered together. (b) The corresponding PC1 loading plot. The loadings explain the pattern seen in the score plot which provides the means to interpret the class specific lipid alteration related to age. X-axis is the variable order (i.e. lipids) and y-axis represents the lipids pattern corresponding to the score plot. Each color in the loadings represents a lipid class: cholesterol ester (CE), diacylglycerol (DG), lysophosphatidylcholine (LPC), phosphatidylcholine (PC), phosphatidylethanolamine (PE), sphingomyelin (SM) and triacylglycerol (TG). The loading depicts that the levels of SMs (green circle’s) and LPCs (light blue circle’s) were elevated at early time points (3, 6, 12 months) while CEs and PEs appeared to be higher in later time point (18, 24, 36 months).
Figure 3
Figure 3
Regression coefficient plot from PLS-DA analysis at 3 months of age. This plot has the regression coefficient on the x-axis and variable importance in the projection (VIP) scores in the y-axis. A VIP score is a statistical estimate of importance of each variable in the PLS-DA model. In general, VIP score of >1 is suggest as a good candidates for the PLS-models. The regression coefficient represents the average changes in the response variable. The regression coefficient describe the relationship between a predictor variable (lipids) and the response (categorical variable CTR or PT1D). Positive sign indicates that as the predictor variable is positively correlated to given response variable. Here, positive and negative regression coefficients represent CTR and PT1D group response in the given PLS-DA model, respectively. Each lipid class is color coded. Abbreviations: cholesterol ester (CE), diacylglycerol (DG), lysophosphatidylcholine (LPC), phosphatidylcholine (PC), phosphatidylethanolamine (PE), sphingomyelin (SM) and triacylglycerol (TG).
Figure 4
Figure 4
Comparison of global lipidome between the children who progressed to T1D, who developed at least a single antibody but not develop T1D during the follow-up (P1Ab), and control (CTR) subjects who remained islet autoantibody negative during the follow-up. (a) Heat map showing 45 lipid species representative of lipid classes that change between PT1D, P1Ab and CTR. Differences in lipid concentrations were calculated by dividing mean concentration in PT1D by the mean concentrations in P1Ab and CTR. Differences were determined at 3, 6, 12, 18, 24 and 36 months of age between the study groups. (b) The smoothened line plot based on the mean SM (36:2) concentration in the three study groups. The error bar shows the standard error of the mean. (c) Concentrations of SM (36:2) in the three study groups at 6 months of age. # represents the adjusted p-values < 0.1.
Figure 5
Figure 5
Total lipid concentration in each lipid class difference between the children who progressed to T1D, who developed at least a single antibody but did not develop T1D during the follow-up (P1Ab), and control (CTR) subjects who remained islet autoantibody negative during the follow-up. The comparisons were done in the longitudinal cohort at the ages of 3, 6, 12, 18, 24 and 36 months. Adjusted p-values < 0.1 are colored blue. The figure shows that SMs were downregulated in the PT1D group at the age of 3 months compared to P1Ab and CTR (adjusted p = 0.047). TGs were also downregulated in PT1D as compared to P1Ab (adjusted p = 0.079) at the age of 3 months. Furthermore, PEs and PCs were also higher in P1Ab than in CTR at the age of 3 months. There was no persistent trend with respect of total lipid concentration between CTR, P1Ab and PT1D in other the perspective series of samples.
Figure 6
Figure 6
The multi-level (ML)-PLS-DA regression coefficient plot showing the most discriminating lipids between the samples obtained before the first islet autoantibody appeared and the samples after the emergence of the first islet autoantibody in the children who progressed to T1D (PT1D) and who developed a single autoantibody but not overt T1D during the follow-up (P1Ab). ML-PLS-DA can be regarded as a multivariate extension of a paired t-test. (a) The pairwise scatter plot shows that SM (d36:1), SM (d36:2), LPC (18:0), LPC (18:2) and LPC (16:0) were up-regulated while CEs (CE 20:4), CE (20:5)) were downregulated before the seroconversion. In addition, the plot depicts that SM (18:1/12:0) and CE (20:5) are differentially altered in P1Ab as compared to PT1D. (b) Univariate pairwise plot. The result from paired t-test shows that only CE (20:5) passed the FDR threshold of 0.1 in P1Ab after seroconversion. Abbreviations: Before seroconversion in P1Ab (B-P1Ab), after seroconversion in P1Ab (A-P1Ab), before seroconversion in progressors (B-PT1D), after seroconversion in progressors (A-PT1D).

References

    1. Atkinson MA, Eisenbarth GS, Michels AW. Type 1 diabetes. Lancet. 2014;383:69–82. doi: 10.1016/S0140-6736(13)60591-7. - DOI - PMC - PubMed
    1. Katsarou A, et al. Type 1 diabetes mellitus. Nat Rev Dis Primers. 2017;3:17016. doi: 10.1038/nrdp.2017.16. - DOI - PubMed
    1. Patterson, C. C., Dahlquist, G. G., Gyurus, E., Green, A. & Soltesz, G. Incidence trends for childhood type 1 diabetes in Europe during 1989–2003 and predicted new cases 2005–20: a multicentre prospective registration study. Lancet373, 2027–2033 (2009). - PubMed
    1. Noble, J. A. & Erlich, H. A. Genetics of Type 1 Diabetes. Cold Spring Harb Perspect Med2 (2012). - PMC - PubMed
    1. Achenbach P, Bonifacio E, Koczwara K, Ziegler AG. Natural history of type 1 diabetes. Diabetes. 2005;54(Suppl 2):S25–31. doi: 10.2337/diabetes.54.suppl_2.S25. - DOI - PubMed

Publication types

MeSH terms