. 2018 Jul 13;9(1):2715.
doi: 10.1038/s41467-018-05121-8.

Single neurons may encode simultaneous stimuli by switching between activity patterns

Affiliations

Single neurons may encode simultaneous stimuli by switching between activity patterns

Valeria C Caruso et al. Nat Commun. .

Abstract

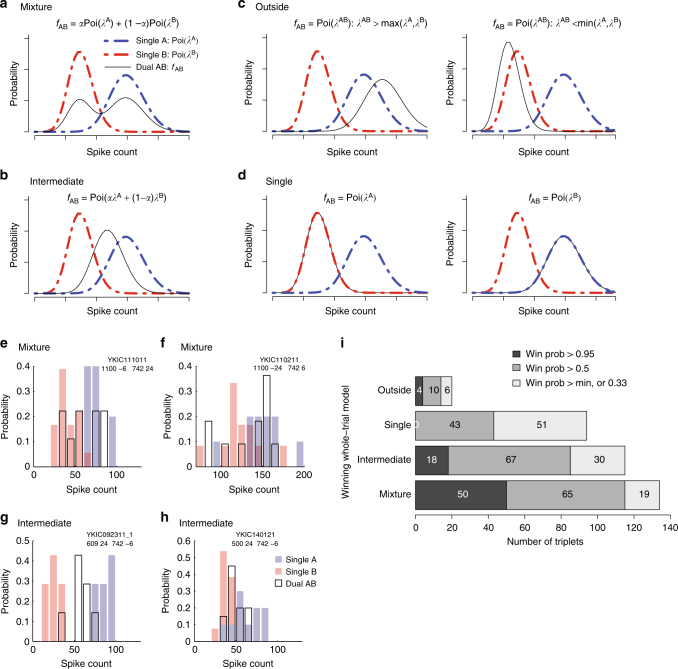
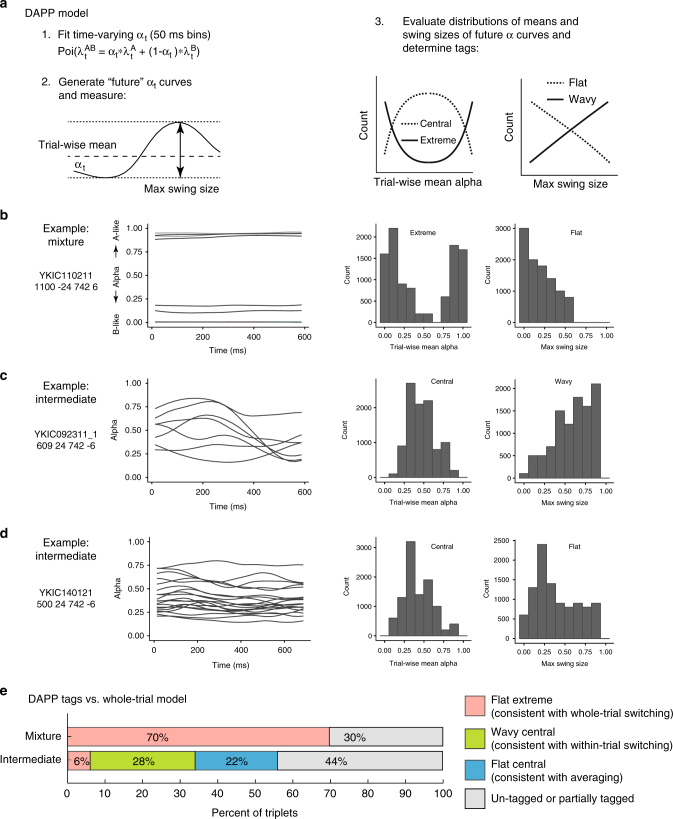
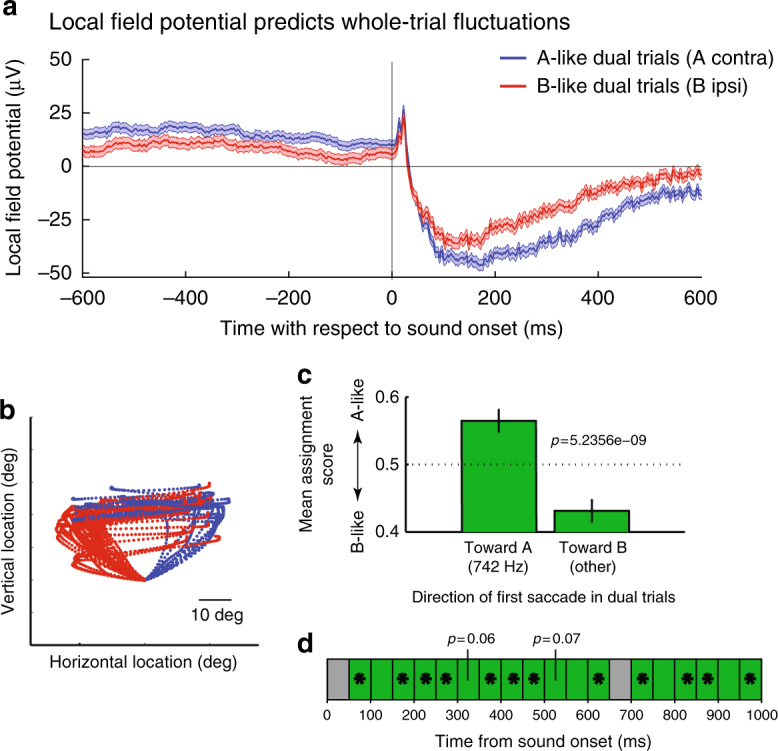
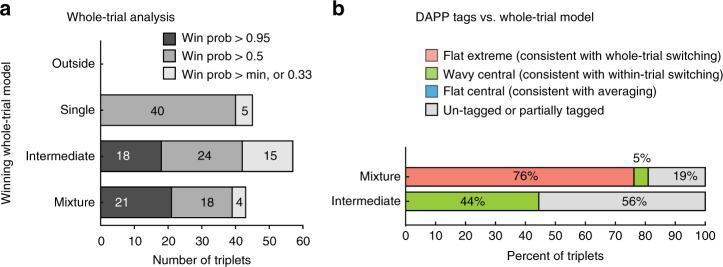
How the brain preserves information about multiple simultaneous items is poorly understood. We report that single neurons can represent multiple stimuli by interleaving signals across time. We record single units in an auditory region, the inferior colliculus, while monkeys localize 1 or 2 simultaneous sounds. During dual-sound trials, we find that some neurons fluctuate between firing rates observed for each single sound, either on a whole-trial or on a sub-trial timescale. These fluctuations are correlated in pairs of neurons, can be predicted by the state of local field potentials prior to sound onset, and, in one monkey, can predict which sound will be reported first. We find corroborating evidence of fluctuating activity patterns in a separate dataset involving responses of inferotemporal cortex neurons to multiple visual stimuli. Alternation between activity patterns corresponding to each of multiple items may therefore be a general strategy to enhance the brain processing capacity, potentially linking such disparate phenomena as variable neural firing, neural oscillations, and limits in attentional/memory capacity.


Conflict of interest statement

: The authors declare no competing interests.

Figures

Fig. 1
Fig. 1
Experimental rationale, task and visualization of individual trial activity. a In telecommunications, multiple signals can be conveyed along a single channel by interleaving samples of each, thus increasing the amount of information transmitted by a single physical resource. Here we investigated whether the brain might employ a similar strategy: do neurons encode multiple items (A and B) using spike trains that alternate between the firing rates corresponding to each item, at some unknown time scale? Such a strategy would preserve information about both items, in contrast to alternatives such as winner-take-all, summation, or averaging, which involve varying degrees of information loss. b Sound localization task. Two monkeys were successfully trained to report one or two simultaneous (bandlimited noise) sounds by saccading at them. See Supplementary Figure 1 for accuracy. c Eye traces of the saccades towards one (left) or two targets (right) during a sample session. d Time-and-trial aggregated dual-sound responses resemble the averaging more than the summation of single-sound responses. For 81% of the triplets tested, the absolute values of the Z-score of each dual-sound response relative to the average were smaller than those relative to the sum. e, f Visualization of individual trials of two IC neurons in which dual-sound responses alternate between firing rates corresponding to single-sounds, across trials for the neuron in e, or within trials for the neuron in f. In each panel, the red and blue shaded areas indicate the median and central 50% of the data on the single-sound trials. The black traces are the individual trials, for single-sound and dual-sound trials as indicated above the panel. For the neuron in e, individual traces on dual-sound trials were classified based on whether they matched the responses to single-sounds A and B (A vs. B assignment score, see Methods) and are plotted in two separate panels accordingly. For the neuron in f, the fluctuations occurred faster, within trials, and are plotted in the same panel. See Supplementary Figure 4 for peristimulus time histograms and frequency sensitivity of these two example neurons
Fig. 2
Fig. 2
Whole-trial analysis. ad show the four models that could describe the distribution of spike counts on individual dual-sound trials (0–600 or 0–1000 ms after sound onset, see Methods). a Mixture of the Poisson distributions of spike counts for the component single-sound trials, b Intermediate Poisson distribution, with rate between the rates of single-sounds responses, c Outside, Poisson distribution with rate larger or lower than the rates of single-sounds responses, d Single, Poisson distribution with rate equal to one of the two single-sound rates. eh Four examples of spike count distributions for triplets classified as Mixtures or Intermediates. Red and blue shades indicate distributions of spike counts for single-sounds; black outlines indicate distributions for dual sounds. The triplets in e, f were classified as Mixture with winning probability > 0.95 (e shows the same triplet as Fig. 1e; f shows the same triplet as Fig. 3b). Triplets in g, h were classified as Intermediate with winning probability > 0.95 (g shows the same triplet as Fig. 1f and Fig. 3c; h shows the same triplet as Fig. 3d). i Population results of the whole-trial analysis. Shading indicates the confidence level of the assignment of individual triplets to winning models
Fig. 3
Fig. 3
Dynamic Admixture Point Process (DAPP) model: rationale and results. a The DAPP model fits smoothly time-varying weights (α and (1−α)) capturing the relative contribution of A- and B-like response distributions to each AB dual-sound trial (point1). The dynamic tendencies of the α curves were then used to generate projected new α curves for hypothetical future draws from this distribution. The waviness and central tendencies were quantified by computing the max swing size and trial-wise mean for an individual trial drawn from the distribution (point 2). Low max swing sizes indicate flat curves and higher values indicate wavy ones (point 3, right panel). Similarly, the distribution of trial-wise means could be bimodal (Extreme) or unimodal (Central) (point 3, left panel). bd Fit alphas for three example triplets (triplets in bd are the same as in Fig. 2f, g, h, respectively) and the distributions of trial-wise means and max swing sizes for future draws from the alpha curve generator. e The pattern of DAPP results extended the whole-trial analysis results. Triplets categorized as Mixtures with a win probability > 0.95 tended to be tagged as Flat-Extreme (as example in b). Triplets categorized as Intermediates fell in two different main groups, Wavy-Central (as example in c) and Flat-Central (as example in d). Information about the Skewed vs. Symmetric tag is not shown. See Supplementary Table 1 and Supplementary Figures 6 and 7 for a complete listing of all the tag combinations and additional analyses
Fig. 4
Fig. 4
Pairs of neurons tend to show positive within-trial correlations. a Schematics of the analysis. Raster plots of two neurons recorded simultaneously; trials shown are for a particular set of dual-sound conditions. We evaluated the spike count in a given 50 ms time bin, trial, and member of the neuron pair for a given set of dual-sound conditions to determine if it was more similar to the spikes evoked during that bin on the corresponding sound A alone or B alone trials (blue box). We then converted these A vs. B assignment probabilities to a Z-score based on the mean and standard deviation of the assignment probabilities in that time bin on the other trials that involved the same stimulus conditions (red box). Finally, we computed the correlation coefficient between the set of Z score values for a given trial between the pair of simultaneously recorded neurons (green box). b Across the population of pairs of triplets recorded simultaneously, the distribution of mean correlation coefficients tended to be positive (t-test comparing the mean correlation coefficients to zero; p = 6.8 × 10-6). See Supplementary Figure 8 for the same analysis based on spike counts and broken down according to whether the neurons in the pair shared the same or had different preferences for sound A vs. sound B
Fig. 5
Fig. 5
Fluctuations can be predicted from pre-stimulus LFP and in turn predict behavior. a To assess the relation between the LFP prior to sound onset and the spiking response after sound onset, we assigned each dual-sound trial to one of two groups, A-like or B-like, based on whether the spike count matched the response to single-sound A or B (see Methods). We then compared the average LFP voltage (without filtering for any particular frequency band) of the two groups. The average LFP (mean ± SE) is shown in blue for 1917 trials classified as A-like (A = contralateral sound) and in red for 1565 trials classified as B-like. The traces are significantly different in the 600 ms before sound onset and in the 600 ms after sound onset (two-tailed t-test, p < 0.01). bd The target of the first saccade on dual-sound trials can be predicted by the spike count during sound presentation. b Eye trajectories during dual-sound trials to the same pair of single-sounds (one triplet). The traces are color-coded based on which of the two sounds the monkey looked at first in the response sequence. For clarity, all traces are aligned on a common starting position despite some variation in fixation accuracy. c The average assignment score of trials in which the monkey looked at sound A first is more A-like than that of trials in which the monkey looked at sound B first. Bars indicate SEM; p value is for a two-tailed t-test involving a total of n = 1171 trials. d The relationship between assignment score and first saccade target was also evident at the scale of 50 ms bins (green = positive correlation; *p < 0.05 for t-test of assignment score on A-first vs. B-first trials)
Fig. 6
Fig. 6
Evidence of fluctuations in face patch MF. a Population results of whole-trial analysis. As in Fig. 2i, shading indicates the confidence level of the assignment of individual triplets to winning models. b Population results of DAPP analysis by winning model from whole-trial analysis (win probability > 0.95). Results resemble those found in the IC, except that there was no evidence of Flat-Central among the Intermediates; Wavy-Central was the predominant label for this group among triplets that could be categorized
Fig. 7
Fig. 7
Two possible mechanisms for de-multiplexing a fluctuating signal. A clock signal that knows about coding transitions is not necessarily needed if signals are read out into a map (a), but is required if signals are retained in a meter or rate-coded format (b). Both models have an input signal that employs a meter code for sound location (purple, c top panel), and this signal is assumed to fluctuate between two response levels when two sounds are present (c bottom panel). In the meter-to-map model (a), the second stage consists of group of excitatory neurons (open circles) with varying thresholds, paired with inhibitory neurons (filled circles) that have slightly higher thresholds. These neurons all receive input from the input meter signal. An individual excitatory neuron is activated when the input signal exceeds its own threshold and is lower than the threshold of the paired inhibitory interneuron, producing tuning curves like those shown in d. The net drive across time to two examples A and B is shown schematically as the thin gray line in the two inset graphs (e). These two neurons would turn on and off out of phase with each other based on their external inputs alone. Adding a positive autofeedback loop to each excitatory neuron in the map (green) provides integration of the activity of each neuron and permits the activity to be sustained across periods of time when there is no external drive (dark line). This model is derived from a portion of the Vector Subtraction model of. In the meter-to-meter model (b), the input is forked to an A meter channel neuron and a B meter channel neuron. A bistable oscillator coupled to the same unknown clock (shared timing signal) that controls the input fluctuations would be needed to appropriately route the output to these two units. The resulting output, in the absence of positive autofeedback, would also fluctuate but between an off state and a level that corresponds to signaling the presence of sound A or B respectively (f gray lines). Adding positive autofeedback would again allow bridging across the off states (dark lines)

References

    1. Meister M. Multineuronal codes in retinal signaling. Proc. Natl Acad. Sci. USA. 1996;93:609–614. doi: 10.1073/pnas.93.2.609. - DOI - PMC - PubMed
    1. Lisman JE, Idiart MA. Storage of 7 +/- 2 short-term memories in oscillatory subcycles. Science. 1995;267:1512–1515. doi: 10.1126/science.7878473. - DOI - PubMed
    1. Hoppensteadt FC, Izhikevich EM. Thalamo-cortical interactions modeled by weakly connected oscillators: could the brain use FM radio principles? Bio. Syst. 1998;48:85–94. - PubMed
    1. Akam T, Kullmann DM. Oscillatory multiplexing of population codes for selective communication in the mammalian brain. Nat. Rev. Neurosci. 2014;15:111–122. doi: 10.1038/nrn3668. - DOI - PMC - PubMed
    1. Tallon-Baudry C. The roles of gamma-band oscillatory synchrony in human visual cognition. Front. Biosci. 2009;14:321–332. doi: 10.2741/3246. - DOI - PubMed

Publication types