. 2018 Sep 1;165(1):198-212.
doi: 10.1093/toxsci/kfy152.

Machine Learning of Toxicological Big Data Enables Read-Across Structure Activity Relationships (RASAR) Outperforming Animal Test Reproducibility

Affiliations

Machine Learning of Toxicological Big Data Enables Read-Across Structure Activity Relationships (RASAR) Outperforming Animal Test Reproducibility

Thomas Luechtefeld et al. Toxicol Sci. .

Abstract

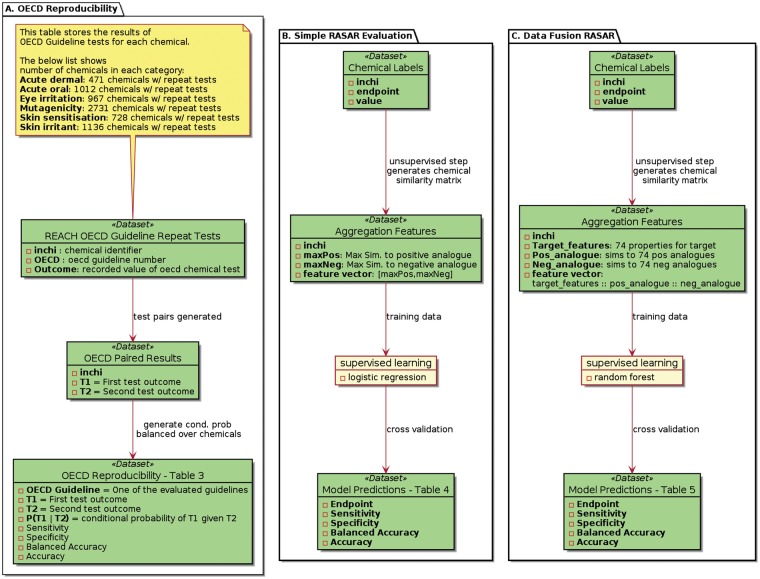
Earlier we created a chemical hazard database via natural language processing of dossiers submitted to the European Chemical Agency with approximately 10 000 chemicals. We identified repeat OECD guideline tests to establish reproducibility of acute oral and dermal toxicity, eye and skin irritation, mutagenicity and skin sensitization. Based on 350-700+ chemicals each, the probability that an OECD guideline animal test would output the same result in a repeat test was 78%-96% (sensitivity 50%-87%). An expanded database with more than 866 000 chemical properties/hazards was used as training data and to model health hazards and chemical properties. The constructed models automate and extend the read-across method of chemical classification. The novel models called RASARs (read-across structure activity relationship) use binary fingerprints and Jaccard distance to define chemical similarity. A large chemical similarity adjacency matrix is constructed from this similarity metric and is used to derive feature vectors for supervised learning. We show results on 9 health hazards from 2 kinds of RASARs-"Simple" and "Data Fusion". The "Simple" RASAR seeks to duplicate the traditional read-across method, predicting hazard from chemical analogs with known hazard data. The "Data Fusion" RASAR extends this concept by creating large feature vectors from all available property data rather than only the modeled hazard. Simple RASAR models tested in cross-validation achieve 70%-80% balanced accuracies with constraints on tested compounds. Cross validation of data fusion RASARs show balanced accuracies in the 80%-95% range across 9 health hazards with no constraints on tested compounds.


Figures

Figure 1.
Figure 1.
Illustration of aggregation functions on the local network of 1-decene. 1-decene is marked as target. Positive and small dots indicates analogs that are positive for a modeled endpoint. Negative indicates analogs that are negative for the modeled endpoint. The table illustrates well known aggregation functions. Data Fusion aggregation function not given.
Figure 2.
Figure 2.
Force layout graph of 10 million chemicals. A, where each dot represents a chemical and their distance reflects chemical similarity, calculated by the number of PubChem 2D features shared by 2 chemicals divided by the total number of PubChem 2D features in both compounds (Jaccard similarity). B–D, Step-wise zooming in, where the frame indicates the area shown in the next graph, until in D, individual chemicals are seen with their similarity connections as gray lines, whose length represents % similarity.
Figure 3.
Figure 3.
Workflow of the presented studies. A, OECD Reproducibility is evaluated via conditional probabilities generated from repeated test pairs found in ECHA dossiers. B, A Simple RASAR built from ECHA C&L data is evaluated in cross-validation. C, A Data Fusion RASAR built from ECHA C&L data is evaluated in cross-validation.
Figure 4.
Figure 4.
Illustration of the closest positive and negative neighbor approach for 1-DECENE. The graph shows chemicals with similarity > 0.9 according to PubChem 2D Tanimoto. The RASAR uses similarity to the closest Positive (large positive node—1, 7-OCTADIENE) and closest Negative (large negative node—MYRCENE) along with other features to characterize a local similarity space. All small nodes here are positives.
Figure 5.
Figure 5.
Proximity to negative and positive neighbors and probability of skin sensitization. These graphs show how skin sensitizers and nonsensitizers distribute over features describing the closest negative and positive chemicals. A, shows how proximity to closest negative (MaxNeg3) and positive neighbor (MaxPos3) distribute for actually toxic (red) and non-toxic (green) chemicals. B, The associated probability for a positive classification (color gradient from green as low probability for a toxic to red for high probability of toxic property). (C, D) 2D histograms for negative (C) and positive (D) chemicals. In (C), hexes to the upper left of the red line are correct classifications. In (D), classifications to the lower right of the red line are correct classifications. Brighter hexes indicate more chemicals with the given feature values.
Figure 6.
Figure 6.
Distribution of sensitizers/nonsensitizers over Simple RASAR hazard estimates. The upper figure (A) is a histogram counting the number of ± chemicals receiving different probabilistic estimates (2.5% increments). The lower figure (B) shows the percentage of ± chemicals at each hazard probability estimate.
Figure 7.
Figure 7.
Modeling of sufficiently close neighbor availability with increasing number of chemicals with data. Two substance lists of 33 383 substances (European Inventory of Existing Commercial Chemical Substances [EINECS]), representing here chemicals with no data, and 1387 chemicals (Annex VI of the REACH legislation) are used, representing chemicals with labels. Please note that these are used here only as random lists of chemicals with CAS numbers. EINECS compounds are represented in blue and ANNEX VI Table 3.1 compounds are in red. At start, none of the 33 383 has neighbors with data. Choosing randomly an increasing number from the 1387-chemcial list, more and more chemicals find neighbors indicated by the contraction of dots linked by Jaccard similarities. We use a minimum similarity of 70% in these figures. The number of neighbors is symbolized by the size of red dots. Edges represent similarities between EINECS compounds and Annex compounds. These visualizations are made with the aid of Gephi graph visualization software.
Figure 8.
Figure 8.
Select features contributing to the Data Fusion RASAR prediction. The most important information sources in the data fusion approach for 9 hazards are shown. The length of each bar shows the relative importance of the feature (given on the left) towards prediction of the hazard (given at top). Row names take the form _T for a feature describing the target compound, _PosAna for a feature describing distance to closest negative analog, and _NegAna for a feature describing similarity to the closest negative analog. All relative contributions are given as Supplementary Table 1.

Comment in

References

    1. Adriaens E., Barroso J., Eskes C., Hoffmann S., McNamee P., Alepée N., Bessou‐Touya S., De Smedt A., De Wever B., Pfannenbecker U., et al. (2014). Retrospective analysis of the Draize test for serious eye damage/eye irritation: importance of understanding the in vivo endpoints under UN GHS/EU CLP for the development and evaluation of in vitro test methods. Arch. Toxicol. 88, 701–723. - PMC - PubMed
    1. Aulmann W., Pechacek N. (2014). Reach (and CLP). Its role in regulatory toxicology In Regulatory Toxicology (Reichl F.-X., Schwenk M., Eds.), pp. 779–795. Springer, Berlin, Heidelberg.
    1. Baker M. (2016). 1, 500 scientists lift the lid on reproducibility. Nature 533, 452–454. - PubMed
    1. Ball N., Cronin M. T. D., Shen J., Blackburn K., Booth E. D., Bouhifd M., Donley E., Egnash L., Hastings C., Juberg D. R., et al. (2016). Toward Good Read-Across Practice (GRAP) guidance. ALTEX 33, 149–166. - PMC - PubMed
    1. Basketter D. A., Clewell H., Kimber I., Rossi A., Blaauboer B., Burrier R., Daneshian M., Eskes C., Goldberg A., Hasiwa N., et al. (2012). A roadmap for the development of alternative (non-animal) methods for systemic toxicity testing. ALTEX 29, 3–89. - PubMed

Publication types

Substances