. 2018 Jul 12;174(2):465-480.e22.
doi: 10.1016/j.cell.2018.06.035.

A Suite of Transgenic Driver and Reporter Mouse Lines with Enhanced Brain-Cell-Type Targeting and Functionality

Affiliations

A Suite of Transgenic Driver and Reporter Mouse Lines with Enhanced Brain-Cell-Type Targeting and Functionality

Tanya L Daigle et al. Cell. .

Abstract

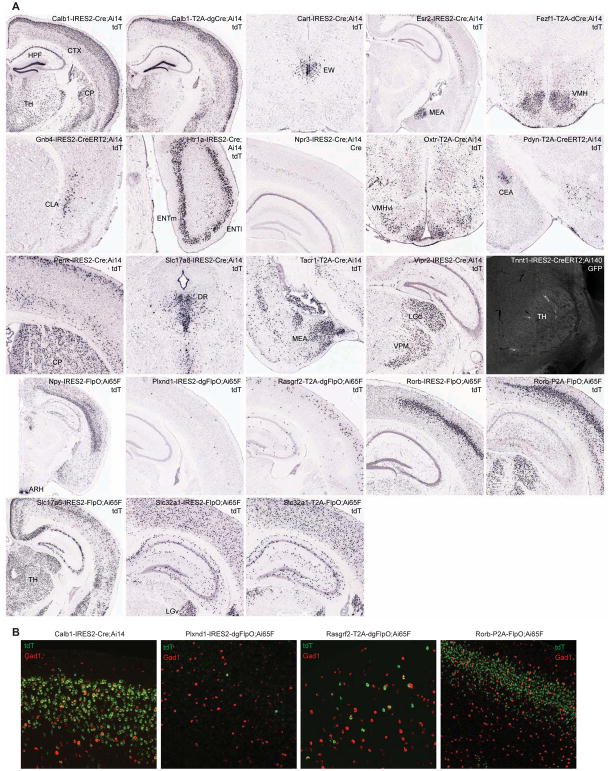
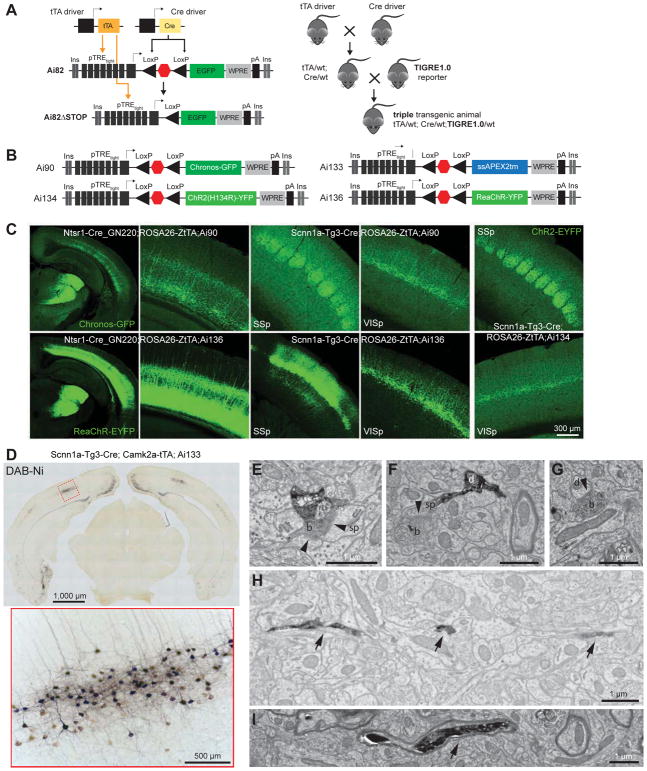
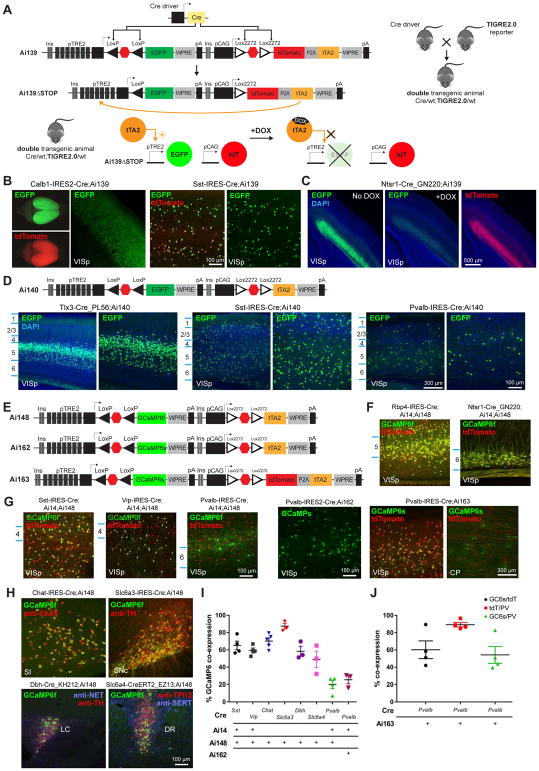
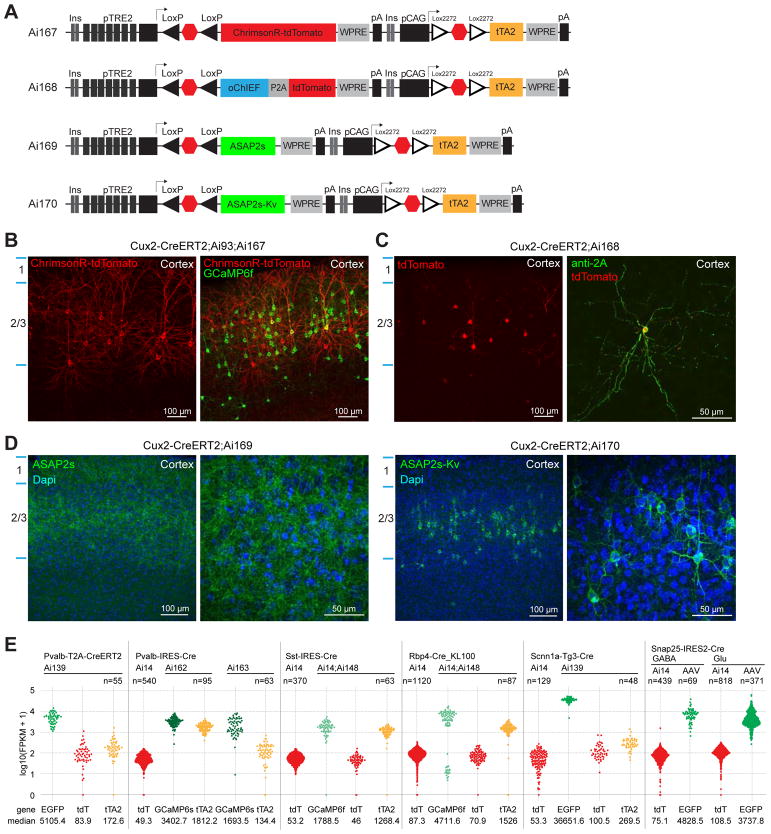
Modern genetic approaches are powerful in providing access to diverse cell types in the brain and facilitating the study of their function. Here, we report a large set of driver and reporter transgenic mouse lines, including 23 new driver lines targeting a variety of cortical and subcortical cell populations and 26 new reporter lines expressing an array of molecular tools. In particular, we describe the TIGRE2.0 transgenic platform and introduce Cre-dependent reporter lines that enable optical physiology, optogenetics, and sparse labeling of genetically defined cell populations. TIGRE2.0 reporters broke the barrier in transgene expression level of single-copy targeted-insertion transgenesis in a wide range of neuronal types, along with additional advantage of a simplified breeding strategy compared to our first-generation TIGRE lines. These novel transgenic lines greatly expand the repertoire of high-precision genetic tools available to effectively identify, monitor, and manipulate distinct cell types in the mouse brain.

Keywords: Cre; Flp; TIGRE; calcium sensor; cell type; channelrhodopsin; optogenetics; reporter; transgenic mice; voltage sensor.


Conflict of interest statement

DECLARATION OF INTERESTS

The authors declare no competing interests.

Figures

Figure 1
Figure 1. New Cre and Flp driver lines targeting specific cell populations in the brain
See also Tables S1 and S3. (A) Selected images from ISH characterization of all new driver lines using either tdTomato reporter probe or Cre probe as indicated on each panel. Full ISH datasets are viewable at http://connectivity.brain-map.org/transgenic. Ai14 was used to examine all Cre lines, and Ai65F was used for all FlpO lines. The only exception is Tnnt1-IRES2-CreERT2, which was crossed to a new TIGRE2.0 reporter Ai140 and TissueCyte imaging shows extremely sparse GFP labeling of thalamic neurons (after 1-day tamoxifen induction at P10). For region acronyms see STAR Methods. (B) Examination of excitatory and inhibitory neuronal labeling in example cortical layer-specific driver lines. Representative images of dFISH in VISp, using tdTomato reporter (green) and pan-GABAergic marker Gad1 (red) probes, are shown. The extent of reporter expression in inhibitory neurons varied from none (Plxnd1-IRES2-dgFlpO, Rorb-P2A-FlpO), to a few cells (Rasgrf2-T2A-dgFlpO), to many cells (Calb1-IRES2-Cre).
Figure 2
Figure 2. New TIGRE1.0 reporter lines for optogenetics and ultrastructural labeling
See also Table S2 and Figure S1. (A) Cre- and tTA-dependent intersectional TIGRE1.0 reporter line design and generalized triple transgenic breeding scheme. (B) Configurations of four new TIGRE1.0 reporter lines. (C) Robust Cre/tTA-dependent expression of opsins in cortical layer 6 and 4 neurons. (D) APEX2 activity revealed by DAB-Ni staining. Bright-field images reveal staining within somatic, dendritic and axonal compartments of neurons located in several cortical regions, including layer 4 of VISp (enlarged image). (E–G) Electron micrographs show APEX2-dependent labeling of both pre- and post-synaptic terminals. Examples include synapses (arrowheads) between a labelled bouton (b) and an unlabeled spine (sp) (E), between a labelled bouton and a labeled spine (F), and between a labelled bouton and an unlabeled dendritic shaft (d) (G). (H–I) Electron micrographs show APEX-dependent labeling of fine, unmyelinated (H) or myelinated (I) axons (arrows).
Figure 3
Figure 3. TIGRE2.0 lines display enhanced expression in a wide range of cell types
See also Table S2 and Figures S2–S3. (A) Cre-dependent TIGRE2.0 reporter line design and simplified double transgenic breeding scheme. The tTA2 activity and subsequent TRE2 promoter-driven expression can be suppressed by giving doxycycline (DOX) to double transgenic mice. (B) Representative images of native EGFP and tdTomato fluorescence in VISp of Cre;Ai139 double transgenic mice. (C) Representative images of native EGFP and tdTomato fluorescence in VISp of Ntsr1-Cre_GN220;Ai139 mice with or without DOX. (D) Configuration of Ai140 and representative images of native EGFP fluorescence in VISp from Cre;Ai140 mice. (E) Configurations of GCaMP6-expressing TIGRE2.0 reporter lines. (F) Representative images of native GCaMP6f and tdTomato fluorescence in Cre;Ai14;Ai148 mice demonstrate layer-specific expression patterns. (G) Representative images of native GCaMP6 and tdTomato fluorescence in major inhibitory neuron classes of indicated triple or double transgenic mice. (H) Co-localization of native GCaMP6f fluorescence and immunostaining for major neuromodulatory markers in corresponding Cre;Ai148 mice (anti-ChAT for cholinergic, anti-TH for dopaminergic, anti-NET and anti-TH for noradrenergic, and anti-TPH2 and anti-SERT for serotoninergic neurons). For region acronyms see STAR Methods. (I) Quantification of GCaMP6 expressing cells in Cre-defined cell classes. For cortical interneuron classes (Sst, Vip and Pvalb), native GCaMP6 co-expression with tdTomato (from Ai14) was quantified within VISp and expressed as a percentage of the number of tdTomato+ cells. For neuromodulatory neuron types, native GCaMP6f co-expression with the indicated cell-type specific markers in H was expressed as a percentage of the number of marker-positive cells. Data are presented as mean ± s.e.m. (same in J); n = 3–5 mice. (J) Quantification of GCaMP6s and tdTomato co-expression in Pvalb+ (anti-PV labeled) cells of Pvalb-IRES-Cre;Ai163 mice (n = 3–4).
Figure 4
Figure 4. TIGRE2.0 reporter lines exhibit high-level transgene expression
See also Figure S4 and Table S4. (A) Configurations of opsin or voltage indicator expressing TIGRE2.0 reporter lines. (B) Representative images of native ChrimsonR-tdT and GCaMP6f fluorescence in a Cux2-CreERT2;Ai93;Ai167 mouse with low-dose tamoxifen induction. (C) Expression of oChIEF as visualized by anti-2A peptide staining and its co-localization with tdTomato in a Cux2-CreERT2;Ai168 mouse. (D) Representative images of native ASAP2s and ASAP2s-Kv fluorescence in Ai169 and Ai170 crossed to Cux2-CreERT2. (E) Quantification of mRNA levels of reporter transgenes by single-cell RNA-seq. Normalized expression values are shown for each cell as fragments per kilobase per million reads (FPKM). Transgene expression levels in cells isolated from various Cre x TIGRE2.0 mice or from AAV injected mice were compared with control cells from corresponding Cre x Ai14 mice. Snap25-IRES2-Cre;Ai14 and Snap25-IRES2-Cre AAV cells were separated into glutamatergic (Glu) and GABAergic (GABA) groups for comparison.
Figure 5
Figure 5. In vivo 2P calcium imaging in cortical neurons with TIGRE2.0 GCaMP6 mice
See also Figure S5. (A) 2P Ca imaging of Sst;Ai14;Ai148 neurons. Left: Z-projection image (time series) showing the entire field-of-view (400 × 400 μm) at 212 μm below the pial surface. Right: ΔF/F traces for 250 seconds of imaging in 7 Sst neurons as labeled in the left panel. Time course of visual stimuli and running velocity was also shown. Same for B and C. (B) 2P Ca imaging of Vip;Ai14;Ai148 neurons at 192 μm depth. Note the fluorescence change started before the initiation of running. (C) 2P Ca imaging of Pvalb;Ai163 neurons at 280 μm depth. (D) Improved functionality of GCaMP6f in Sst cells in Ai148 relative to Ai95, as shown in population histograms of mean max responses (left), standard deviation of ΔF/F during gray screens (null stimuli, middle), and estimated signal-to-noise ratio (right). (E) Comparison of GCaMP6 functionality in Pvalb cells in Ai148, Ai162 and 163 mice.
Figure 6
Figure 6. Characterization of light-evoked responses in opsin-expressing TIGRE1.0 and TIGRE2.0 lines
Mouse lines examined are Scnn1a-Tg3-Cre;ROSA26-ZtTA;Ai90 (simplified as Scnn1a-Ai90 or Ai90, same below), Scnn1a-Tg3-Cre;ROSA26-ZtTA;Ai134, Scnn1a-Tg3-Cre;ROSA26-ZtTA;Ai136, Scnn1a-Tg3-Cre;Ai167, and Scnn1a-Tg3-Cre;Ai168. See also Figure S6. (A) Representative examples of light-evoked currents in response to 100-ms stimulation (indicated by grey shading). Traces are from individual neurons and are normalized to their peak current amplitude. (B) Average ± s.d. of peak current amplitude and data points for individual cells from each transgenic line. Ai90: 0.59 ± 0.36 nA; Ai134: 0.88 ± 0.36 nA; Ai136: 2.76 ± 1.34 nA; Ai167: 1.99 ± 0.50 nA; Ai168: 0.19 ± 0.18 nA. *P < 0.005 (n = 6–10 cells for each line). (C) Power-dependence of photocurrent activation for each transgenic line. Data are plotted as mean ± s.d. Current amplitudes evoked by powers < 1 mW/mm2 in the Ai168 line were not quantified due to their low amplitude. (D) Representative responses of a Scnn1a-Tg3-Cre;Ai167 cell to 5 ms light pulses of increasing power. (E) Cumulative spike probability plotted against photostimulation power for each transgenic line. (F) Comparison of high frequency firing between transgenic lines. Representative voltage recordings from individual cells in response to 10 repeated stimuli at the indicated frequencies. (G) Plot of AP fidelity versus stimulus frequency for each transgenic line. Data are plotted as the mean ± s.e.m. (n = 9–15 cells for each line).
Figure 7
Figure 7. Incidence of aberrant cortical activity in mice with cortical pan-excitatory GCaMP6 expression
See also Figure S7 and Tables S5–S6. Wide-field Ca imaging to examine interictal activities across the cortex. One or two representative examples are shown for each mouse line. For each mouse, left panel shows GCaMP6 fluorescence from the dorsal surface of the cortex, middle panel a 30-second example trace of calcium activity from a location in motor cortex (the red dot in the left panel), and right panel the relationship between event amplitude (prominence) and event width (hexagonally-binned scatterplot). (A) None of the 7 Slc17a7-IRES2-Cre;Ai162 mice examined had aberrant activity. (B) Aberrant activity was detected in 3 of 7 Slc17a7-IRES2-Cre;Ai148 mice examined, one of which is mouse #2 shown on the right. (C) Aberrant activity was detected in 1 of 5 Slc17a7-IRES2-Cre;Camk2a-tTA;Ai93 mice examined, and this is mouse #2 shown on the right. (D) An example Emx1-IRES-Cre;Camk2a-tTA;Ai93 mouse that had aberrant activity. (E) The only Emx1-IRES-Cre;Camk2a-tTA;Ai94 mouse we examined from this cross that exhibited aberrant activity (region shown is somatosensory cortex). Note the difference in event characteristics when reported by GCaMP6f (D) or GCaMP6s (E) indicator.

Comment in

References

    1. Abraira VE, Kuehn ED, Chirila AM, Springel MW, Toliver AA, Zimmerman AL, Orefice LL, Boyle KA, Bai L, Song BJ, et al. The Cellular and Synaptic Architecture of the Mechanosensory Dorsal Horn. Cell. 2017;168:295–310 e219. - PMC - PubMed
    1. Baker CA, Elyada YM, Parra A, Bolton MM. Cellular resolution circuit mapping with temporal-focused excitation of soma-targeted channelrhodopsin. eLife. 2016;5 - PMC - PubMed
    1. Bethge P, Carta S, Lorenzo DA, Egolf L, Goniotaki D, Madisen L, Voigt FF, Chen JL, Schneider B, Ohkura M, et al. An R-CaMP1.07 reporter mouse for cell-type-specific expression of a sensitive red fluorescent calcium indicator. PLoS ONE. 2017;12:e0179460. - PMC - PubMed
    1. Chamberland S, Yang HH, Pan MM, Evans SW, Guan S, Chavarha M, Yang Y, Salesse C, Wu H, Wu JC, et al. Fast two-photon imaging of subcellular voltage dynamics in neuronal tissue with genetically encoded indicators. eLife. 2017;6 - PMC - PubMed
    1. Dymecki SM, Ray RS, Kim JC. Mapping cell fate and function using recombinase-based intersectional strategies. Methods in enzymology. 2010;477:183–213. - PubMed

Publication types